| Param | Original file | Final file |
|---|---|---|
| Filename | modeM0/AS1T02_013T01_9000001976_13281cztM0_level2.evt | modeM0/AS1T02_013T01_9000001976_13281cztM0_level2_quad_clean.evt |
| Size (bytes) | 574,001,280 | 82,140,480 |
| Size | 547.4 MB | 78.3 MB |
| Events in quadrant A | 3,452,443 | 543,502 |
| Events in quadrant B | 6,407,494 | 412,586 |
| Events in quadrant C | 3,233,629 | 546,923 |
| Events in quadrant D | 3,836,603 | 518,002 |
| Mode M9 | |||
|---|---|---|---|
| Quadrant | BADHDUFLAG | Total packets | Discarded packets |
| A | 0 | 14 | 0 |
| B | 0 | 14 | 0 |
| C | 0 | 14 | 0 |
| D | 0 | 14 | 0 |
| Mode SS | |||
|---|---|---|---|
| Quadrant | BADHDUFLAG | Total packets | Discarded packets |
| A | 0 | 138 | 0 |
| B | 0 | 138 | 0 |
| C | 0 | 138 | 0 |
| D | 0 | 138 | 0 |
| Mode M0 | |||
|---|---|---|---|
| Quadrant | BADHDUFLAG | Total packets | Discarded packets |
| A | 0 | 14329 | 3 |
| B | 0 | 23265 | 2 |
| C | 0 | 13885 | 2 |
| D | 0 | 15724 | 2 |
| Quadrant | Total seconds | Saturated seconds | Saturation percentage |
|---|---|---|---|
| A | 6680 | 117 | 1.751497% |
| B | 6680 | 1538 | 23.023952% |
| C | 6680 | 66 | 0.988024% |
| D | 6680 | 182 | 2.724551% |
Noise dominated data is calculated using 1-second bins in cleaned event files. If a bin has >2000 counts, and if more than 50% of those come from <1% of pixels, then it is considered to be noise-dominated and hence unusable.
| Quadrant | # 1 sec bins | Bins with >0 counts | Bins with >2000 counts | High rate bins dominated by noise | Noise dominated (total time) | Noise dominated (detector-on time) | Marked lightcurve |
|---|---|---|---|---|---|---|---|
| A | 8071 | 6683 | 2 | 2 | 0.02% | 0.03% | 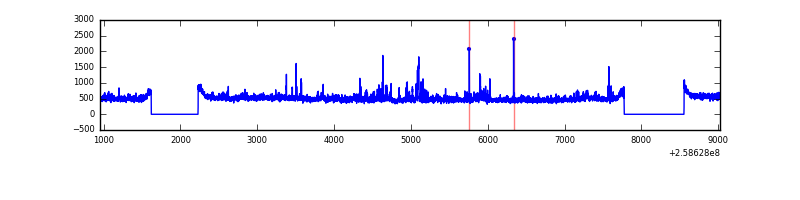 |
| B | 8071 | 6682 | 883 | 883 | 10.94% | 13.21% | 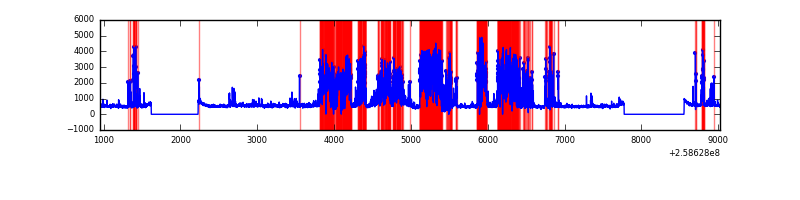 |
| C | 8071 | 6683 | 12 | 12 | 0.15% | 0.18% | 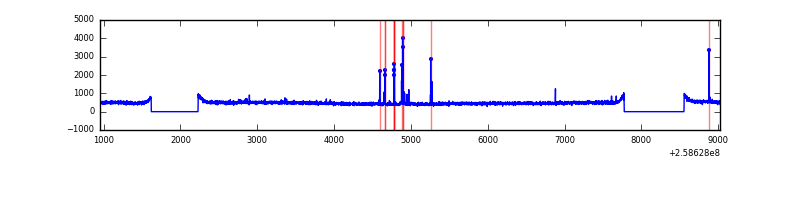 |
| D | 8071 | 6683 | 76 | 76 | 0.94% | 1.14% | 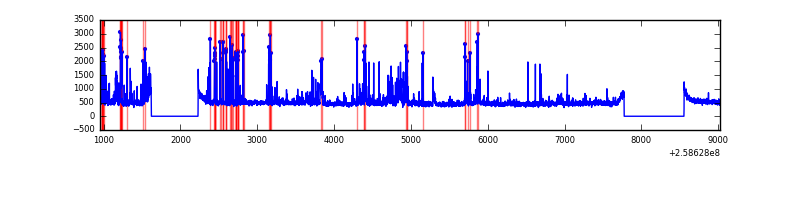 |
Top three noisy pixels from each quadrant. If the there are fewer than three noisy pixels in the level2.evt file, extra rows are filled as -1
| Pixel properties | Quadrant properties | ||||||
|---|---|---|---|---|---|---|---|
| Quadrant | DetID | PixID | Counts | Sigma | Mean | Median | Sigma |
| A | 8 | 15 | 182349 | 1066.06 | 827 | 809 | 170.3 |
| A | 1 | 162 | 39196 | 225.42 | 827 | 809 | 170.3 |
| A | 1 | 178 | 14087 | 77.97 | 827 | 809 | 170.3 |
| B | 4 | 239 | 3265606 | 23532.33 | 720 | 702 | 138.7 |
| B | 3 | 64 | 111903 | 801.5 | 720 | 702 | 138.7 |
| B | 10 | 244 | 64752 | 461.65 | 720 | 702 | 138.7 |
| C | 15 | 208 | 65496 | 341.41 | 811 | 818 | 189.4 |
| C | 14 | 234 | 8103 | 38.46 | 811 | 818 | 189.4 |
| C | 13 | 61 | 5857 | 26.6 | 811 | 818 | 189.4 |
| D | 1 | 52 | 379815 | 1936.3 | 802 | 782 | 195.8 |
| D | 13 | 249 | 321593 | 1638.88 | 802 | 782 | 195.8 |
| D | 8 | 195 | 28218 | 140.16 | 802 | 782 | 195.8 |
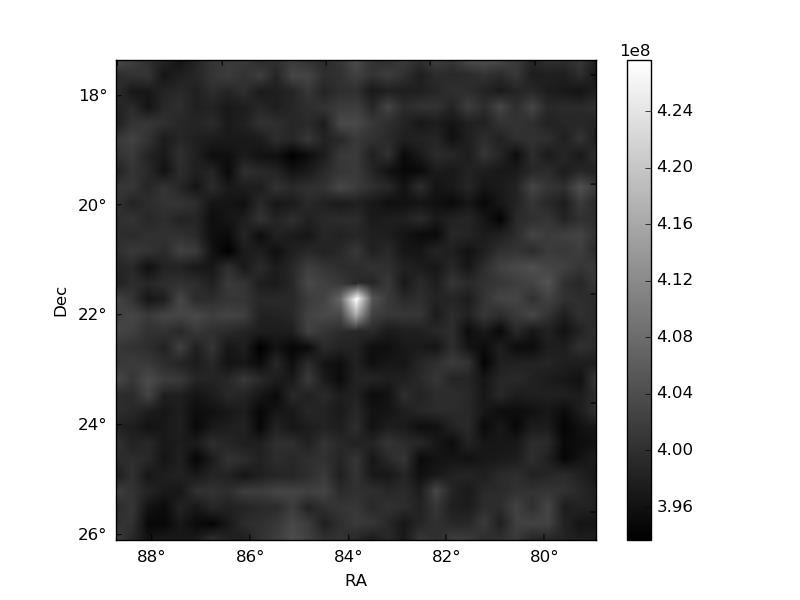
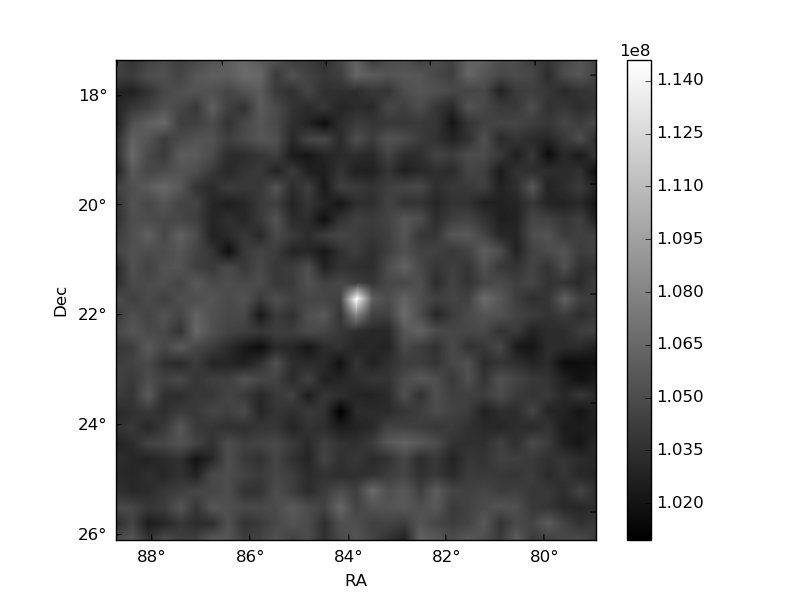
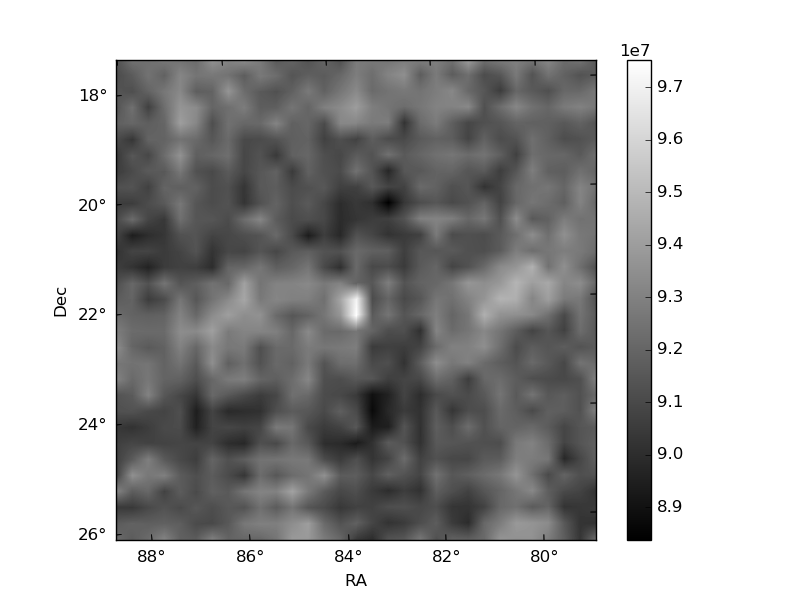
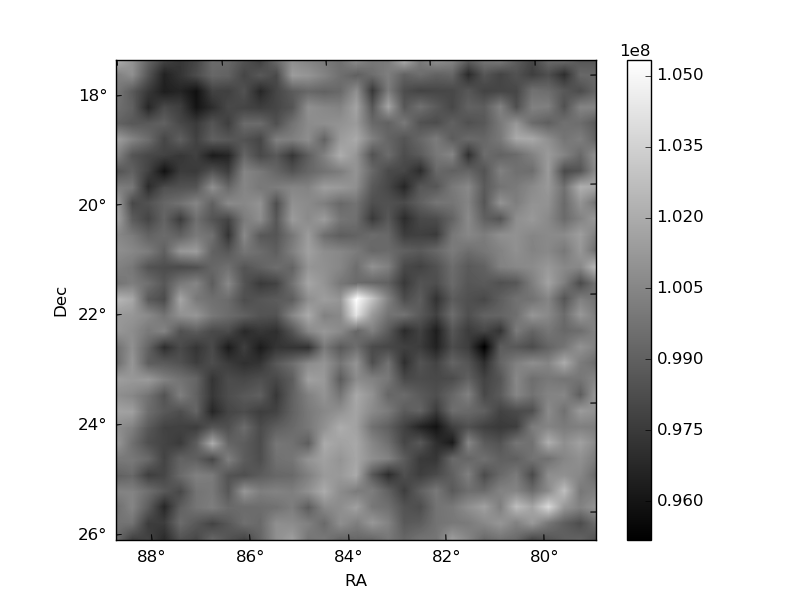
Histogram calculated using DETX and DETY for each event in the final _common_clean file
| Quadrant A | 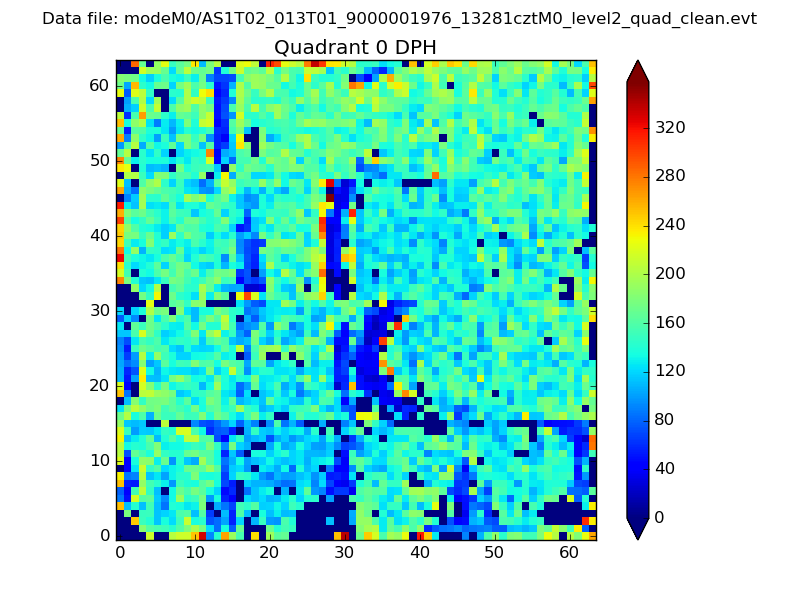 |
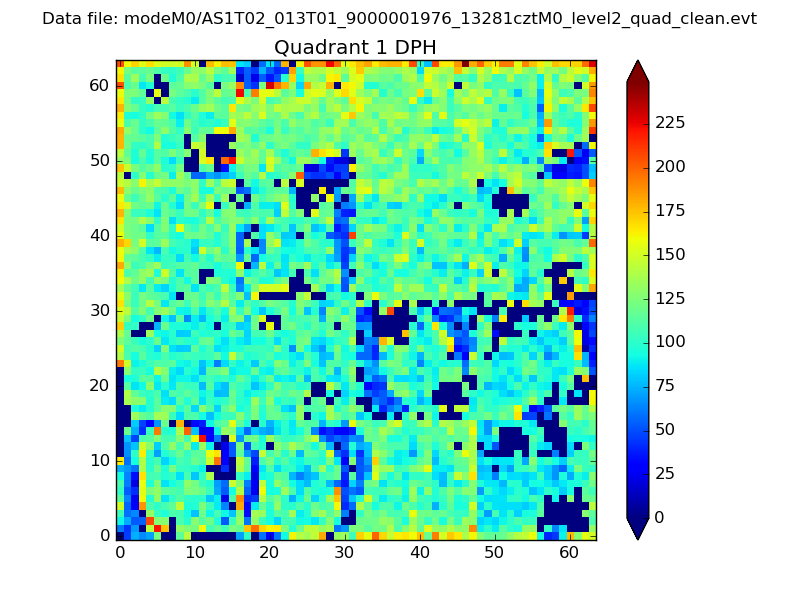 |
Quadrant B |
|---|---|---|---|
| Quadrant D |  |
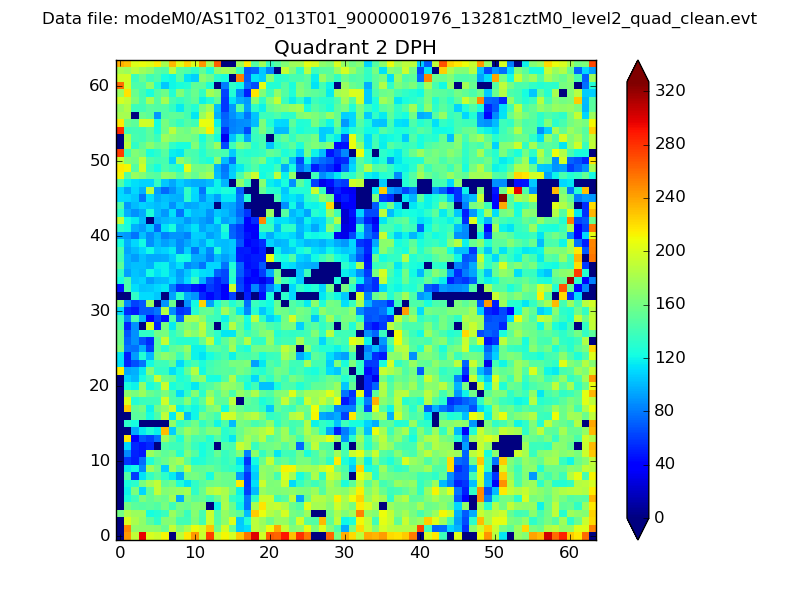 |
Quadrant C |
| Plot type | Count rate plots | Images |
|---|---|---|
| Comparison with Poisson distribution Blue bars denote a histogram of data divided into 1 sec bins. Red curve is a Poisson curve with rate = median count rate of data. |
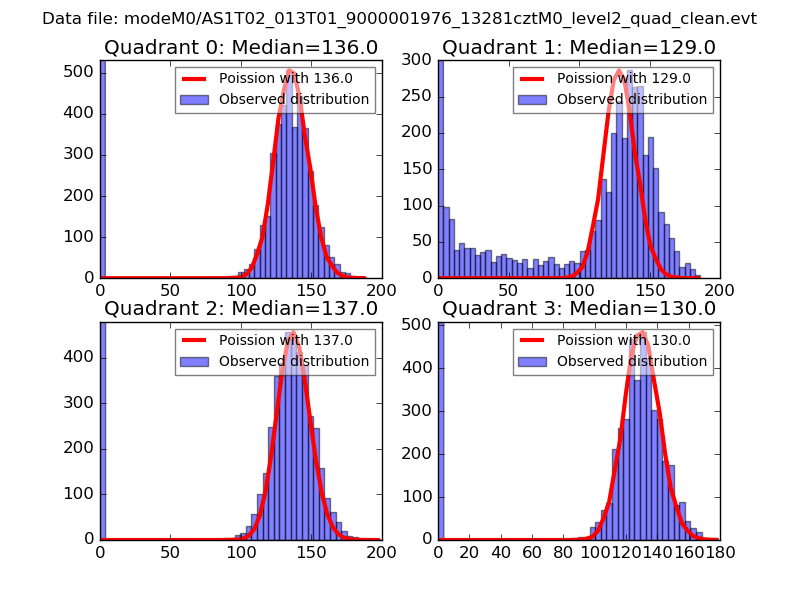 |
 |
| Quadrant-wise count rates Data is divided into 100 sec bins |
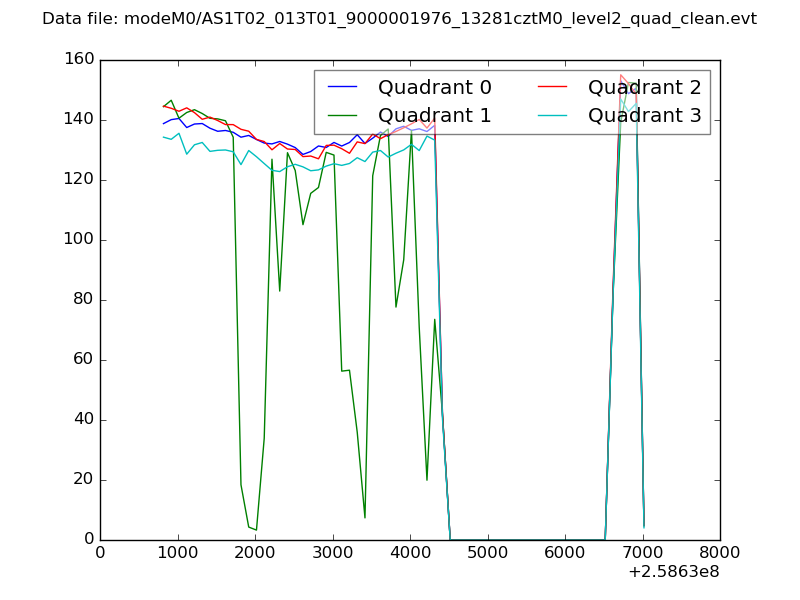 |
|
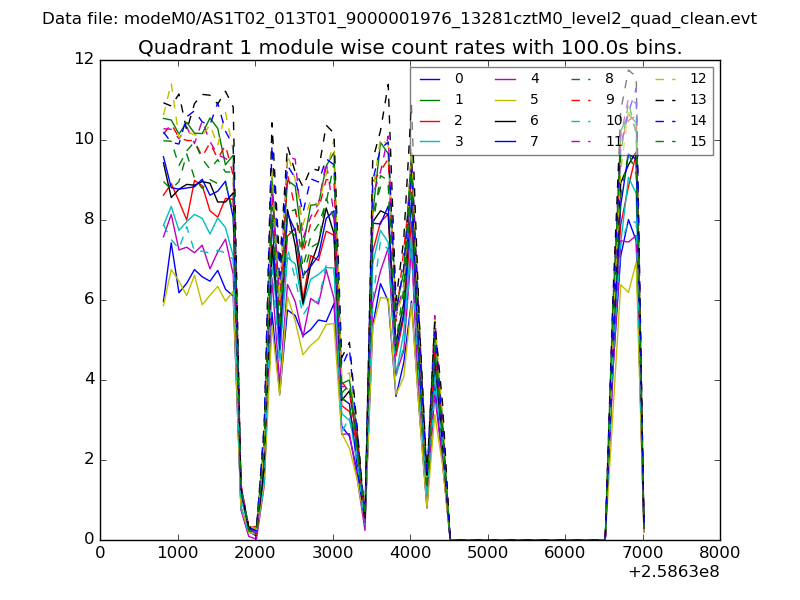
| Module-wise count rates for Quadrant A Data is divided into 100 sec bins |
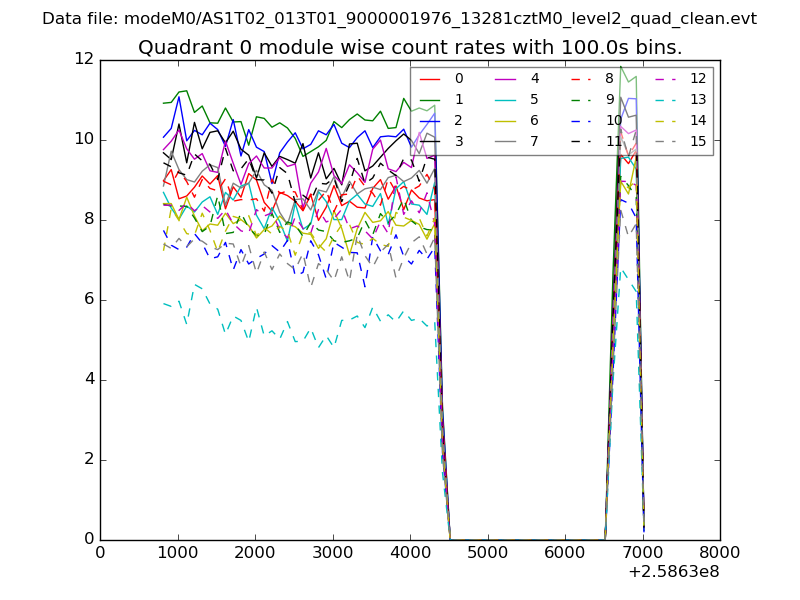 |
 |
| Module-wise count rates for Quadrant B Data is divided into 100 sec bins |
 |
 |
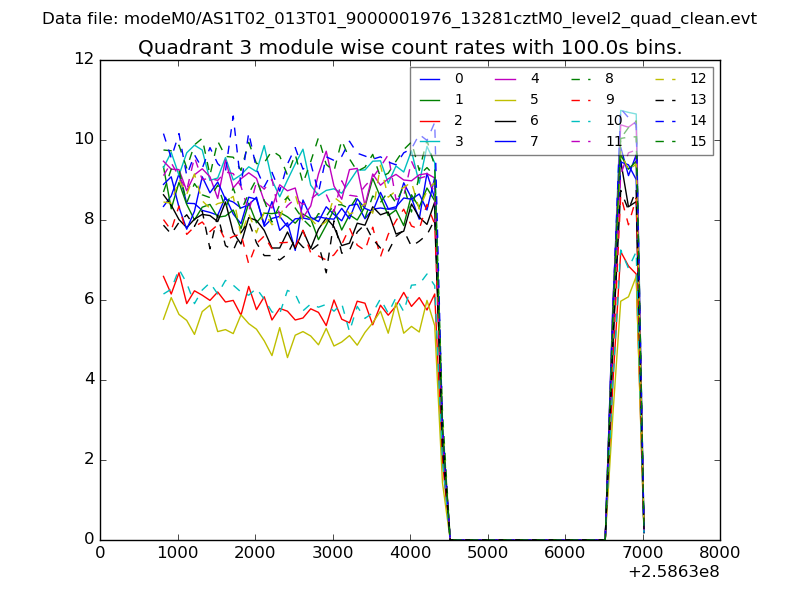
| Module-wise count rates for Quadrant C Data is divided into 100 sec bins |
 |
 |
| Module-wise count rates for Quadrant D Data is divided into 100 sec bins |
 |
 |
| Parameter | Plot |
|---|---|
| CZT HV Monitor | 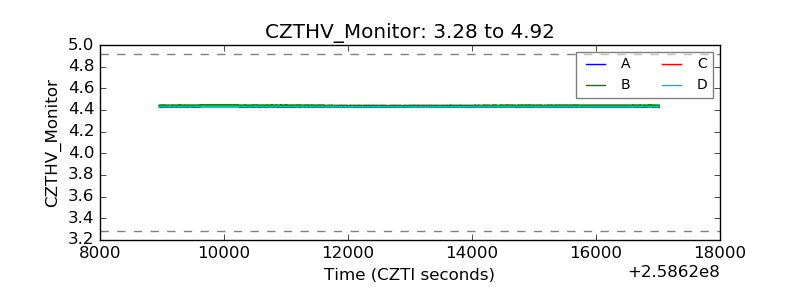 |
| D_VDD | 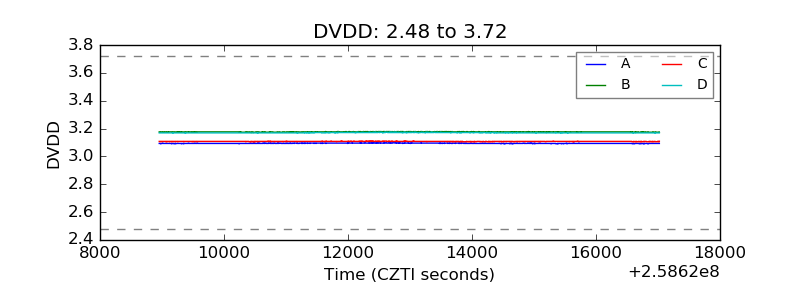 |
| Temperature 1 | 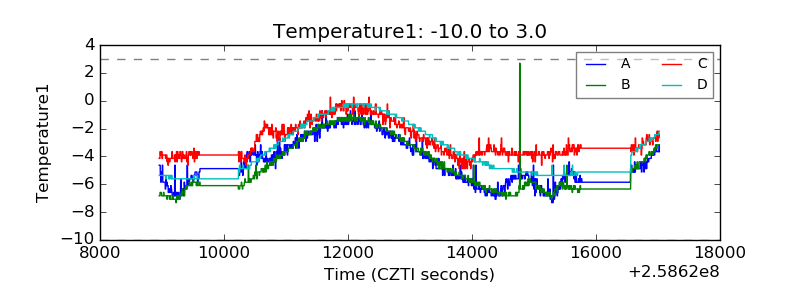 |
| Veto HV Monitor | 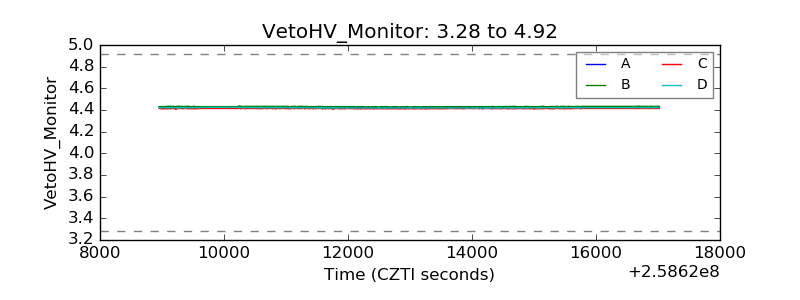 |
| Veto LLD | 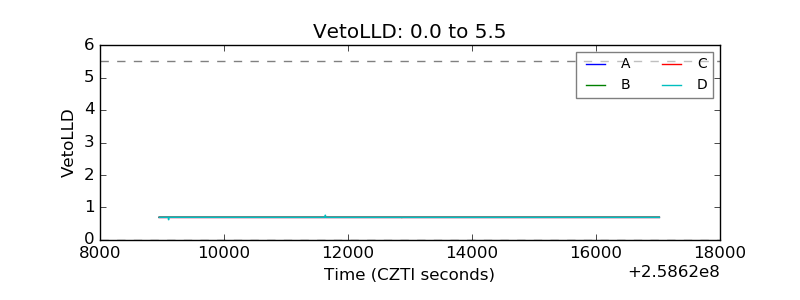 |
| Alpha Counter | 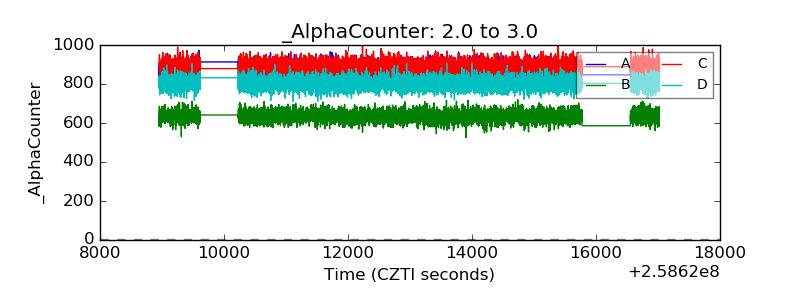 |
| _CPM_Rate | 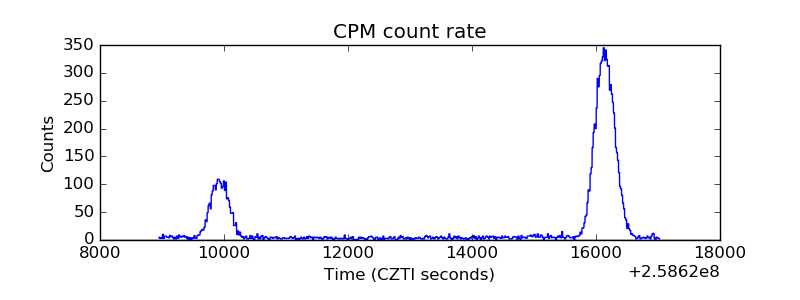 |
| CZT Counter | 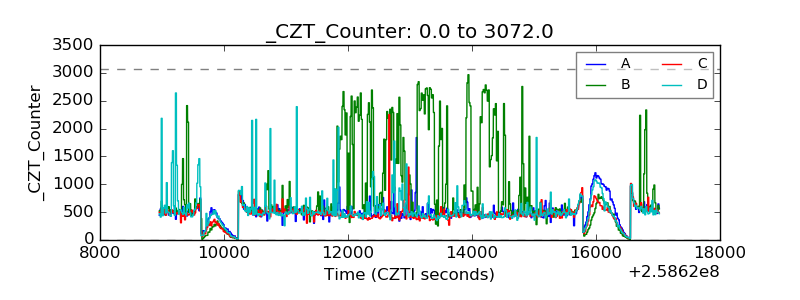 |
| +2.5 Volts monitor |  |
| +5 Volts monitor | 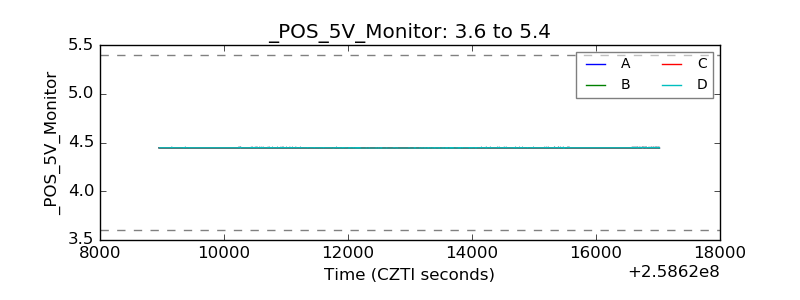 |
| _ROLL_ROT | 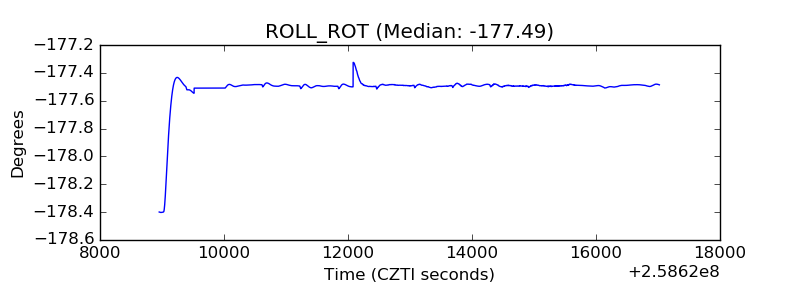 |
| _Roll_DEC | 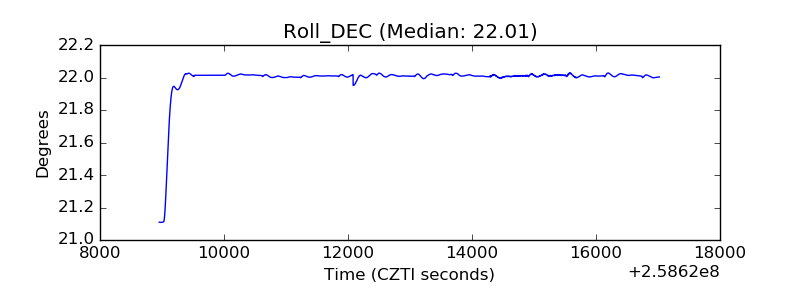 |
| _Roll_RA | 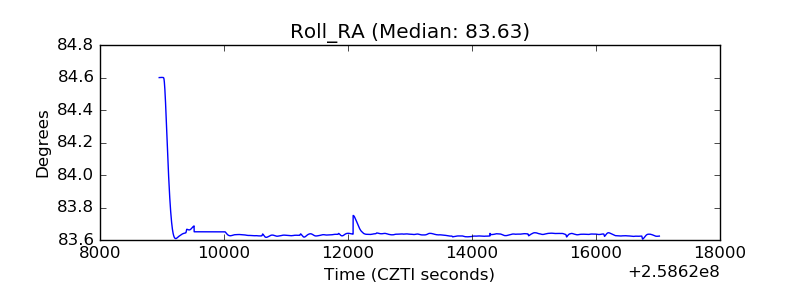 |
| Veto Counter | 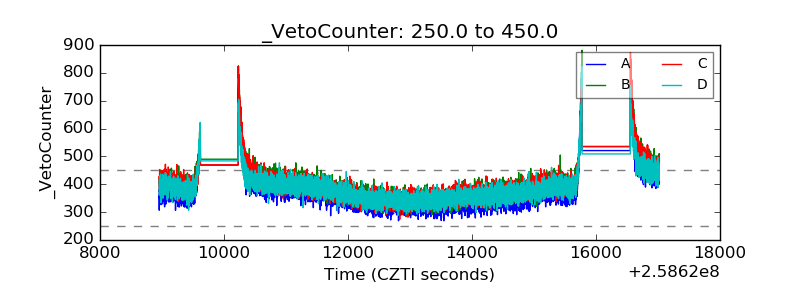 |