| Param | Original file | Final file |
|---|---|---|
| Filename | modeM0/AS1T02_013T01_9000001976_13284cztM0_level2.evt | modeM0/AS1T02_013T01_9000001976_13284cztM0_level2_quad_clean.evt |
| Size (bytes) | 644,932,800 | 87,445,440 |
| Size | 615.1 MB | 83.4 MB |
| Events in quadrant A | 3,101,070 | 655,833 |
| Events in quadrant B | 8,425,693 | 305,313 |
| Events in quadrant C | 3,003,769 | 647,017 |
| Events in quadrant D | 4,574,103 | 599,220 |
| Mode M9 | |||
|---|---|---|---|
| Quadrant | BADHDUFLAG | Total packets | Discarded packets |
| A | 0 | 11 | 0 |
| B | 0 | 11 | 0 |
| C | 0 | 11 | 0 |
| D | 0 | 11 | 0 |
| Mode SS | |||
|---|---|---|---|
| Quadrant | BADHDUFLAG | Total packets | Discarded packets |
| A | 0 | 128 | 0 |
| B | 0 | 128 | 0 |
| C | 0 | 128 | 0 |
| D | 0 | 128 | 0 |
| Mode M0 | |||
|---|---|---|---|
| Quadrant | BADHDUFLAG | Total packets | Discarded packets |
| A | 0 | 13344 | 2 |
| B | 0 | 29151 | 1 |
| C | 0 | 13100 | 1 |
| D | 0 | 17805 | 1 |
| Quadrant | Total seconds | Saturated seconds | Saturation percentage |
|---|---|---|---|
| A | 6294 | 49 | 0.778519% |
| B | 6294 | 3090 | 49.094376% |
| C | 6294 | 31 | 0.492533% |
| D | 6294 | 175 | 2.780426% |
Noise dominated data is calculated using 1-second bins in cleaned event files. If a bin has >2000 counts, and if more than 50% of those come from <1% of pixels, then it is considered to be noise-dominated and hence unusable.
| Quadrant | # 1 sec bins | Bins with >0 counts | Bins with >2000 counts | High rate bins dominated by noise | Noise dominated (total time) | Noise dominated (detector-on time) | Marked lightcurve |
|---|---|---|---|---|---|---|---|
| A | 7410 | 6296 | 1 | 1 | 0.01% | 0.02% | 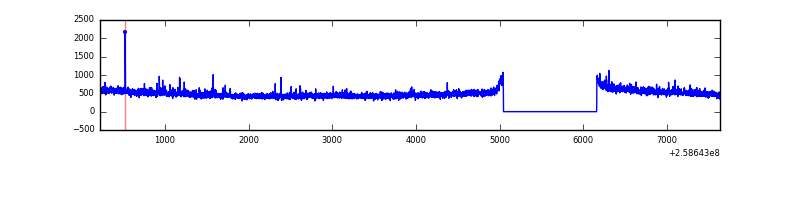 |
| B | 7410 | 6296 | 1677 | 1677 | 22.63% | 26.64% | 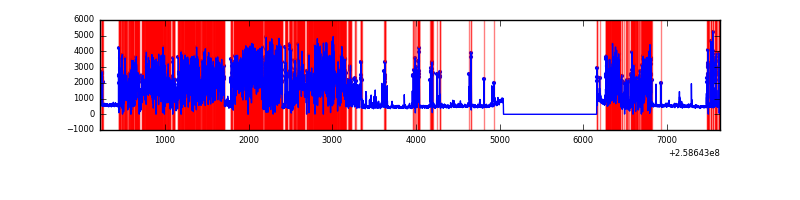 |
| C | 7410 | 6296 | 2 | 2 | 0.03% | 0.03% | 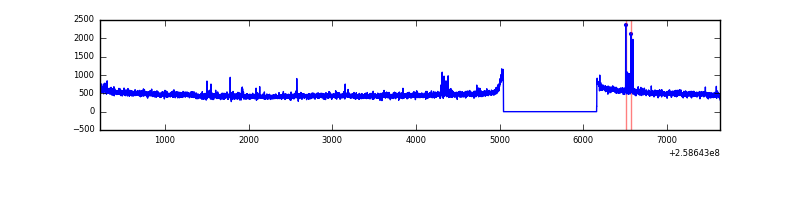 |
| D | 7410 | 6296 | 119 | 119 | 1.61% | 1.89% | 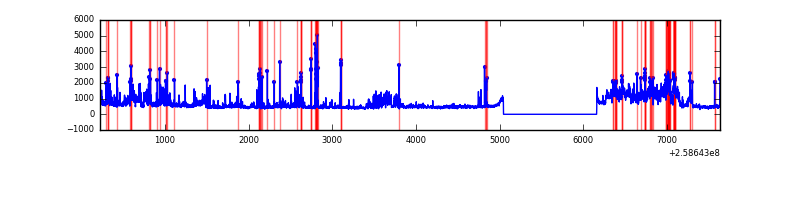 |
Top three noisy pixels from each quadrant. If the there are fewer than three noisy pixels in the level2.evt file, extra rows are filled as -1
| Pixel properties | Quadrant properties | ||||||
|---|---|---|---|---|---|---|---|
| Quadrant | DetID | PixID | Counts | Sigma | Mean | Median | Sigma |
| A | 1 | 162 | 24896 | 150.08 | 785 | 770 | 160.7 |
| A | 8 | 15 | 20113 | 120.33 | 785 | 770 | 160.7 |
| A | 9 | 143 | 16136 | 95.59 | 785 | 770 | 160.7 |
| B | 4 | 239 | 6142017 | 64222.08 | 502 | 491 | 95.6 |
| B | 10 | 245 | 148808 | 1550.95 | 502 | 491 | 95.6 |
| B | 0 | 189 | 43537 | 450.13 | 502 | 491 | 95.6 |
| C | 15 | 208 | 35861 | 199.71 | 760 | 767 | 175.7 |
| C | 13 | 61 | 5584 | 27.41 | 760 | 767 | 175.7 |
| C | 14 | 234 | 2015 | 7.1 | 760 | 767 | 175.7 |
| D | 13 | 104 | 743351 | 4105.74 | 754 | 736 | 180.9 |
| D | 1 | 52 | 560035 | 3092.23 | 754 | 736 | 180.9 |
| D | 8 | 195 | 190963 | 1051.72 | 754 | 736 | 180.9 |
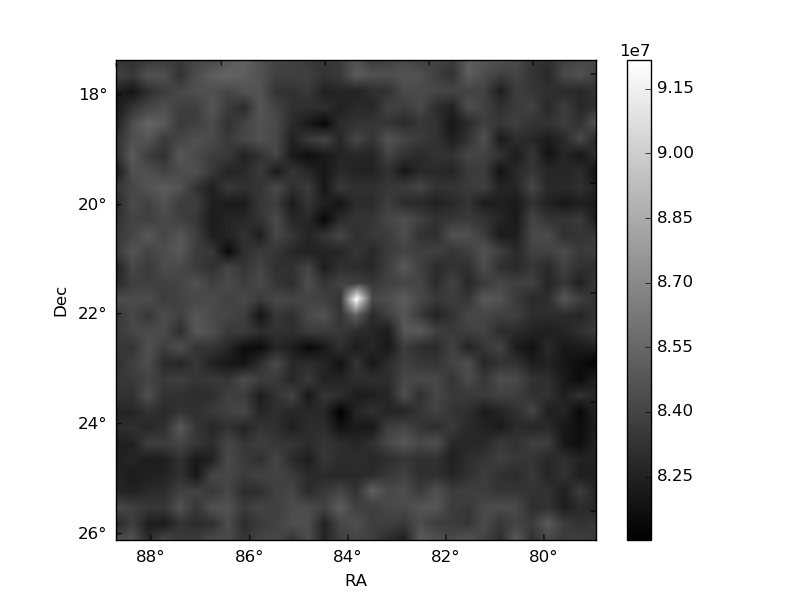
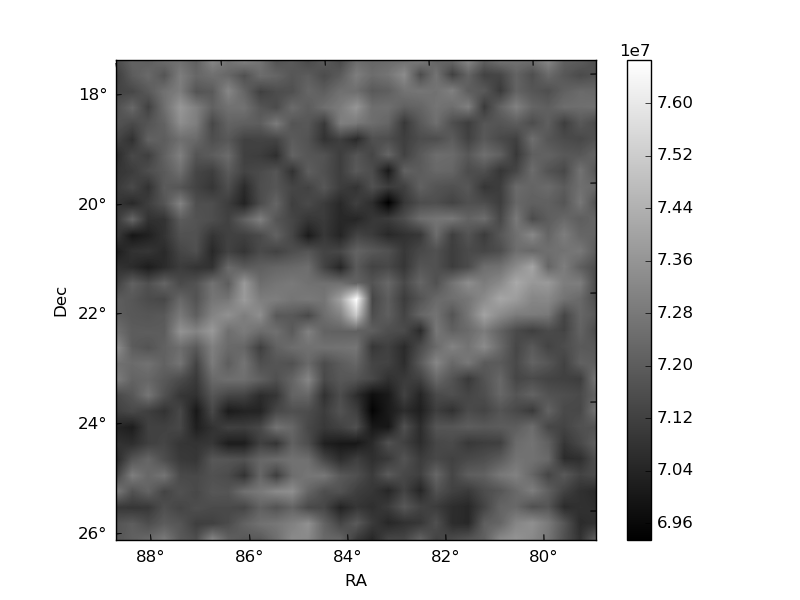
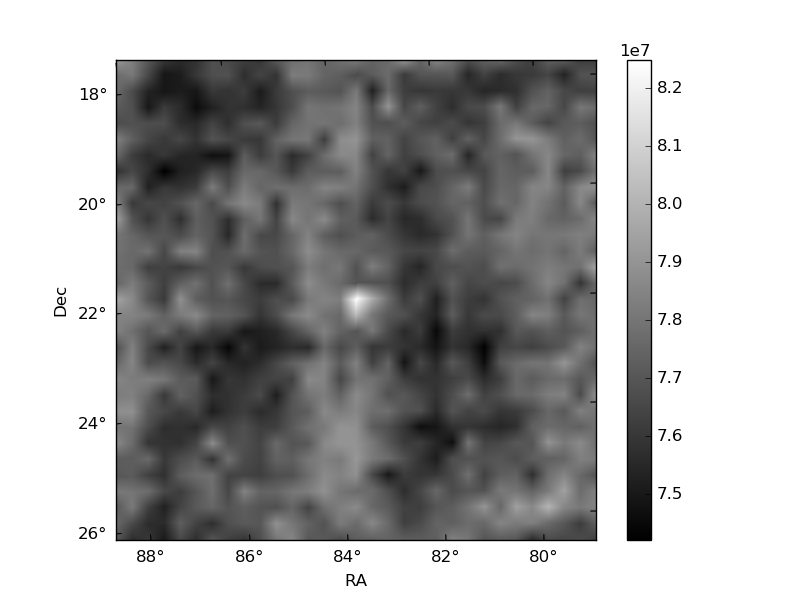
Histogram calculated using DETX and DETY for each event in the final _common_clean file
| Quadrant A | 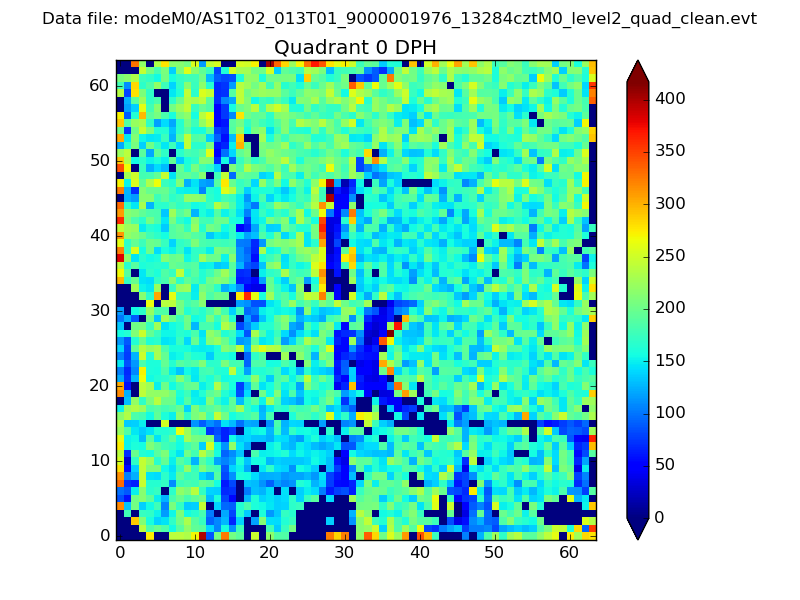 |
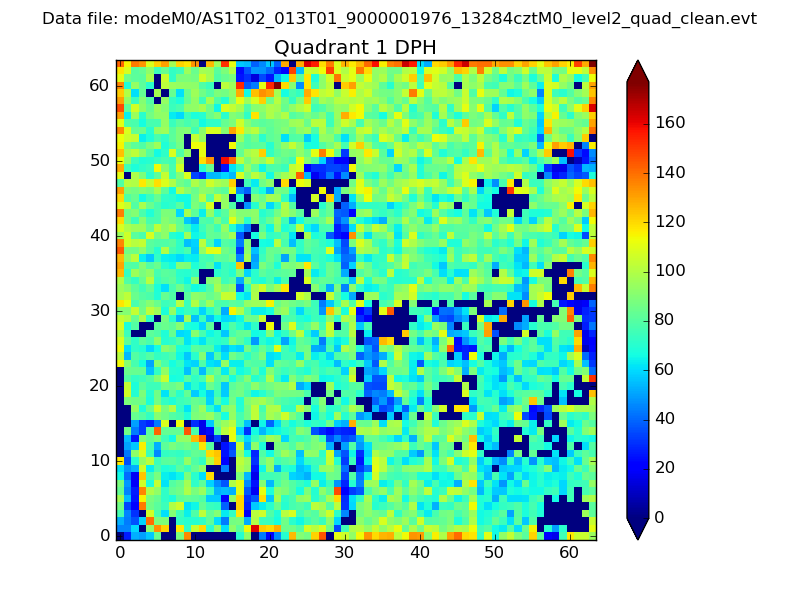 |
Quadrant B |
|---|---|---|---|
| Quadrant D | 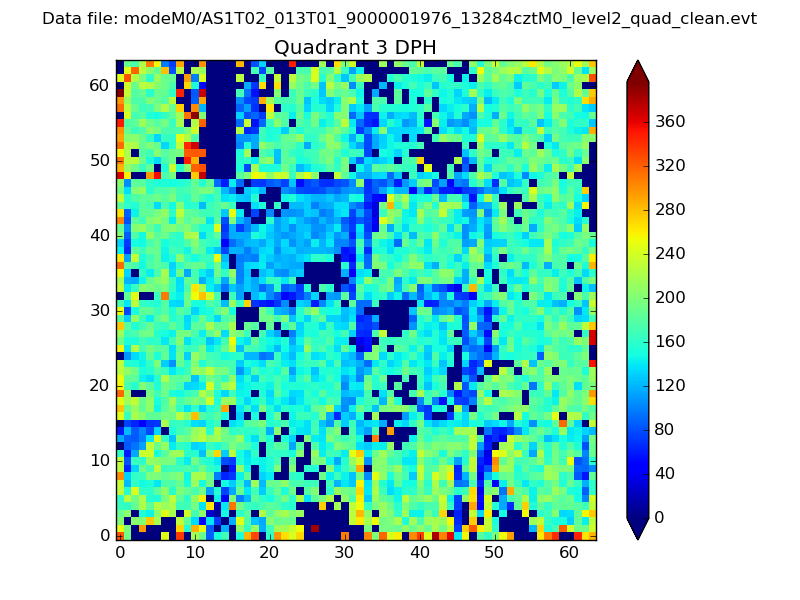 |
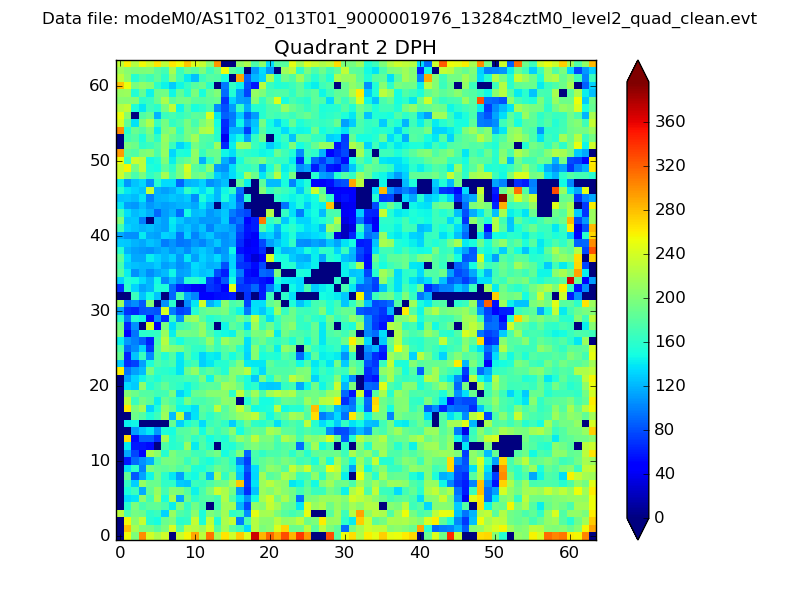 |
Quadrant C |
| Plot type | Count rate plots | Images |
|---|---|---|
| Comparison with Poisson distribution Blue bars denote a histogram of data divided into 1 sec bins. Red curve is a Poisson curve with rate = median count rate of data. |
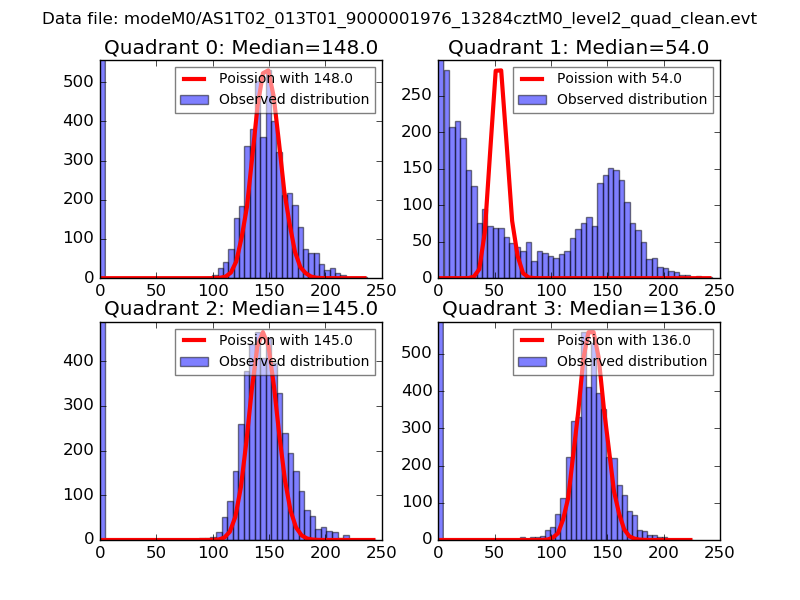 |
 |
| Quadrant-wise count rates Data is divided into 100 sec bins |
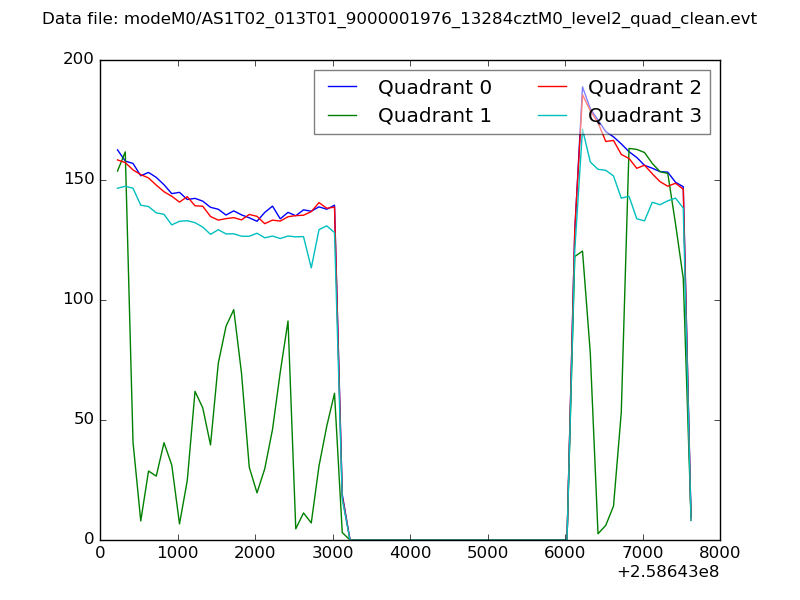 |
|
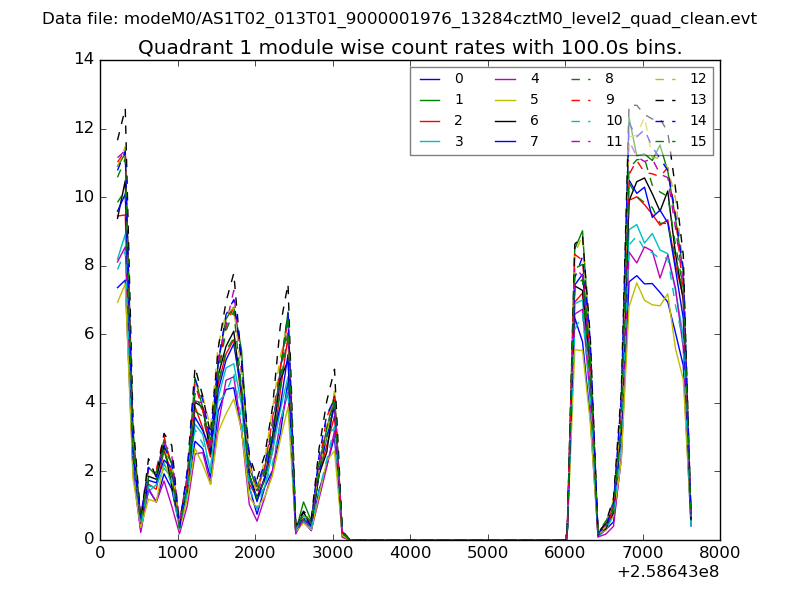
| Module-wise count rates for Quadrant A Data is divided into 100 sec bins |
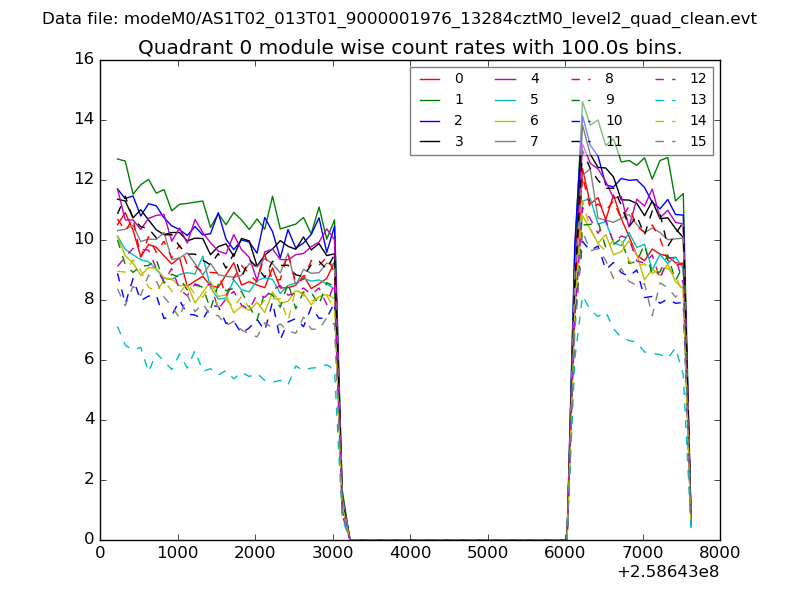 |
 |
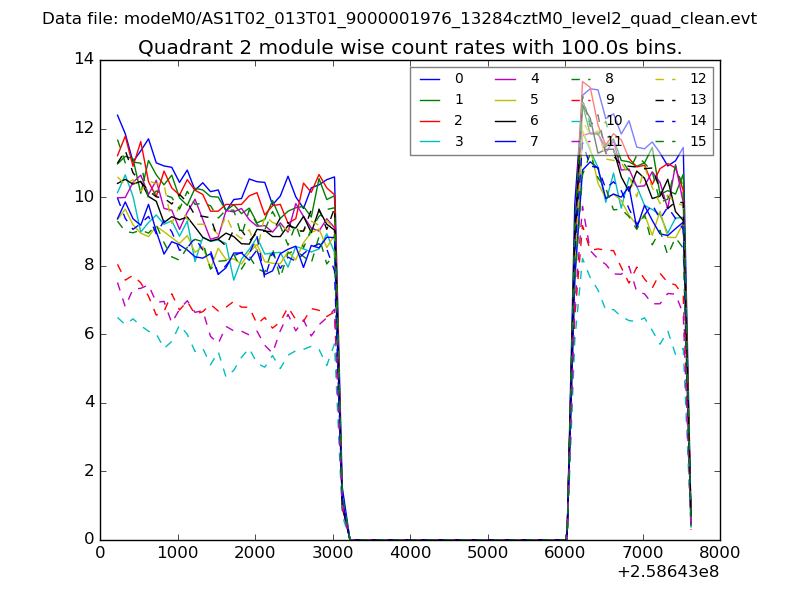
| Module-wise count rates for Quadrant B Data is divided into 100 sec bins |
 |
 |
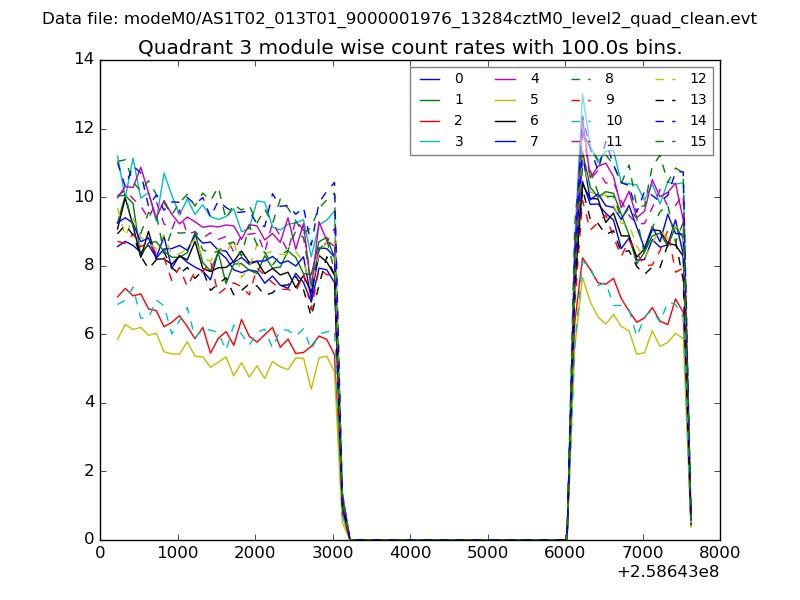
| Module-wise count rates for Quadrant C Data is divided into 100 sec bins |
 |
 |
| Module-wise count rates for Quadrant D Data is divided into 100 sec bins |
 |
 |
| Parameter | Plot |
|---|---|
| CZT HV Monitor | 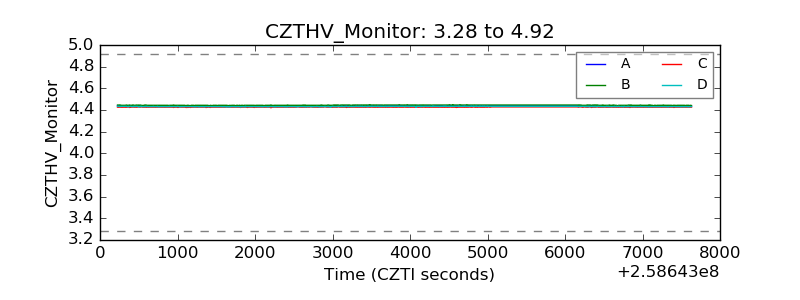 |
| D_VDD | 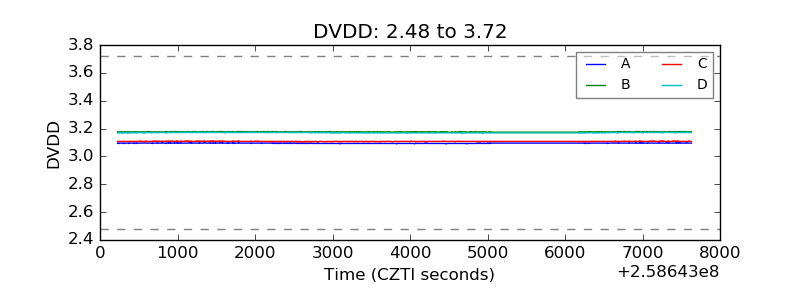 |
| Temperature 1 | 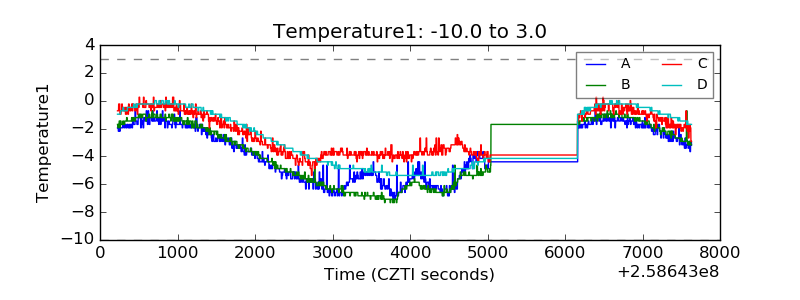 |
| Veto HV Monitor | 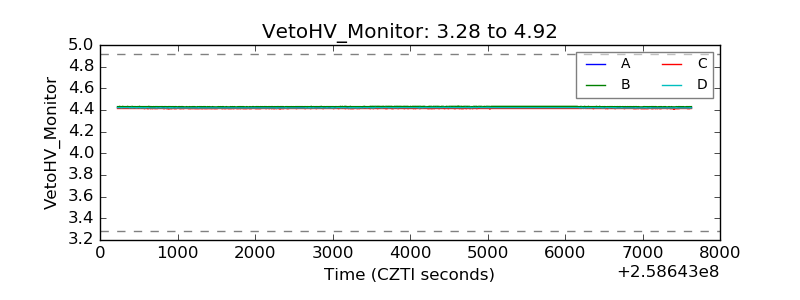 |
| Veto LLD | 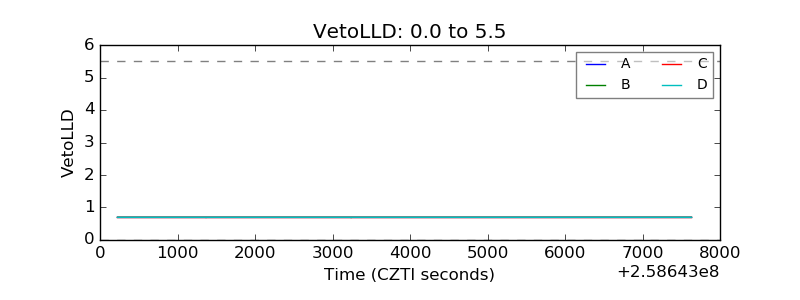 |
| Alpha Counter | 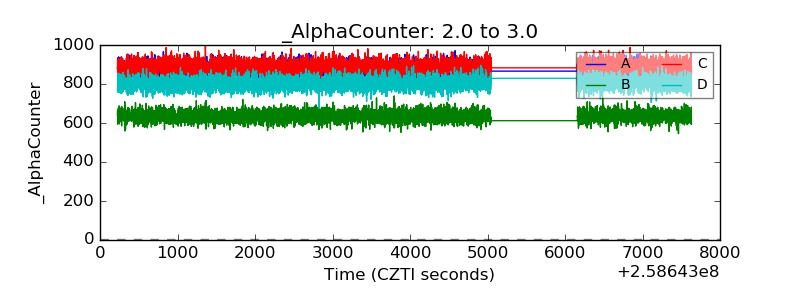 |
| _CPM_Rate | 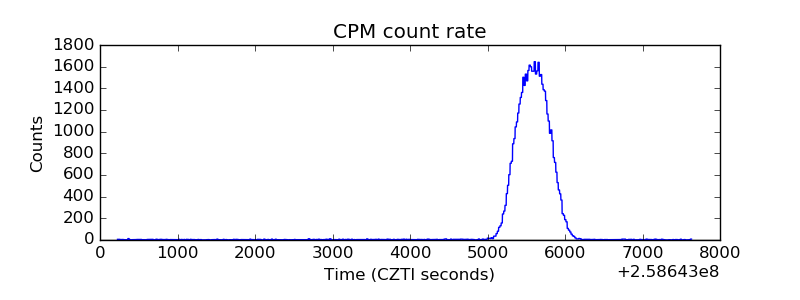 |
| CZT Counter | 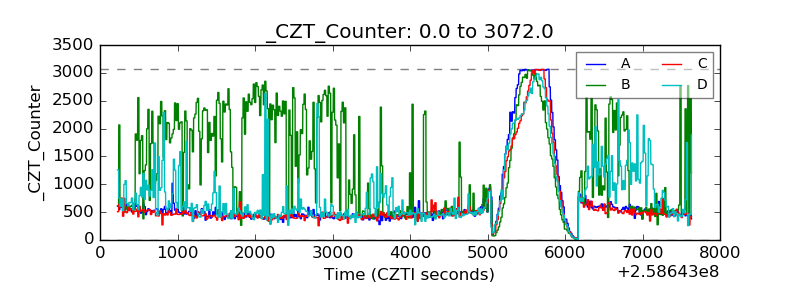 |
| +2.5 Volts monitor |  |
| +5 Volts monitor |  |
| _ROLL_ROT | 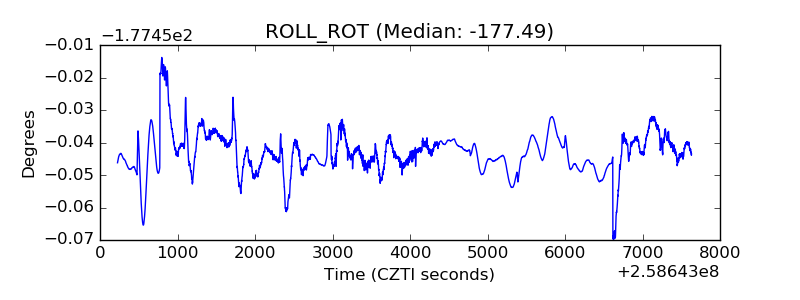 |
| _Roll_DEC | 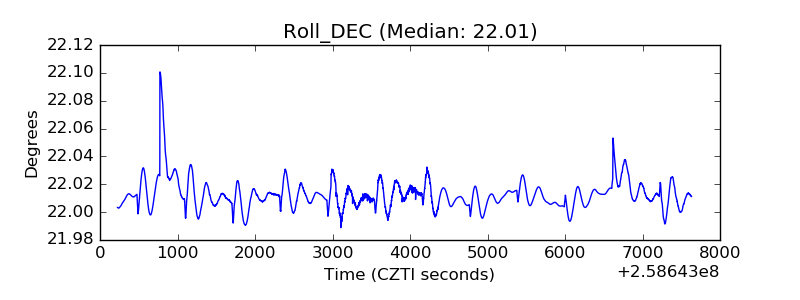 |
| _Roll_RA | 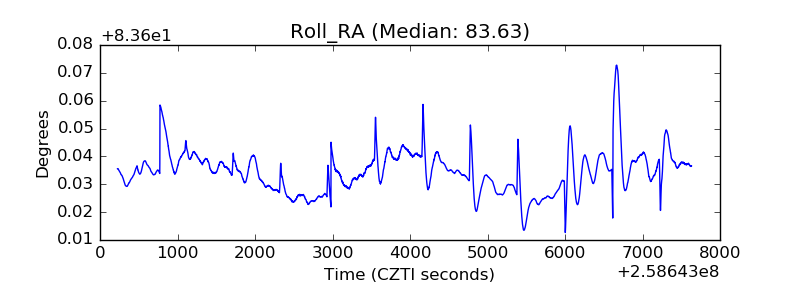 |
| Veto Counter | 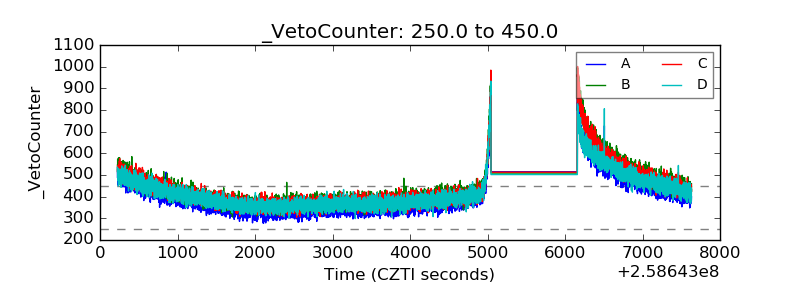 |