| Param | Original file | Final file |
|---|---|---|
| Filename | modeM0/AS1T02_013T01_9000001976_13287cztM0_level2.evt | modeM0/AS1T02_013T01_9000001976_13287cztM0_level2_quad_clean.evt |
| Size (bytes) | 682,833,600 | 84,746,880 |
| Size | 651.2 MB | 80.8 MB |
| Events in quadrant A | 3,316,889 | 644,158 |
| Events in quadrant B | 9,046,195 | 270,167 |
| Events in quadrant C | 3,236,289 | 641,200 |
| Events in quadrant D | 4,666,684 | 583,289 |
| Mode M9 | |||
|---|---|---|---|
| Quadrant | BADHDUFLAG | Total packets | Discarded packets |
| A | 0 | 15 | 0 |
| B | 0 | 15 | 0 |
| C | 0 | 15 | 0 |
| D | 0 | 16 | 0 |
| Mode SS | |||
|---|---|---|---|
| Quadrant | BADHDUFLAG | Total packets | Discarded packets |
| A | 0 | 124 | 0 |
| B | 0 | 124 | 0 |
| C | 0 | 124 | 0 |
| D | 0 | 124 | 0 |
| Mode M0 | |||
|---|---|---|---|
| Quadrant | BADHDUFLAG | Total packets | Discarded packets |
| A | 0 | 13734 | 3 |
| B | 0 | 30902 | 2 |
| C | 0 | 13341 | 2 |
| D | 0 | 17881 | 2 |
| Quadrant | Total seconds | Saturated seconds | Saturation percentage |
|---|---|---|---|
| A | 6104 | 51 | 0.835518% |
| B | 6104 | 3341 | 54.734600% |
| C | 6104 | 54 | 0.884666% |
| D | 6104 | 297 | 4.865662% |
Noise dominated data is calculated using 1-second bins in cleaned event files. If a bin has >2000 counts, and if more than 50% of those come from <1% of pixels, then it is considered to be noise-dominated and hence unusable.
| Quadrant | # 1 sec bins | Bins with >0 counts | Bins with >2000 counts | High rate bins dominated by noise | Noise dominated (total time) | Noise dominated (detector-on time) | Marked lightcurve |
|---|---|---|---|---|---|---|---|
| A | 7460 | 6106 | 0 | 0 | 0.00% | 0.00% | 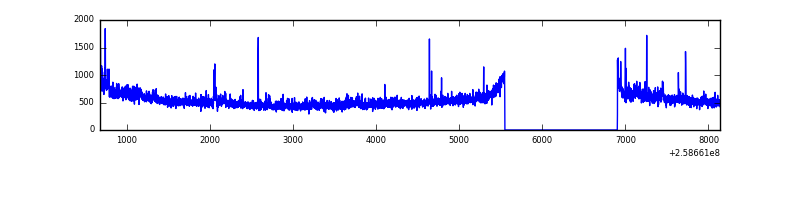 |
| B | 7460 | 6103 | 2132 | 2132 | 28.58% | 34.93% | 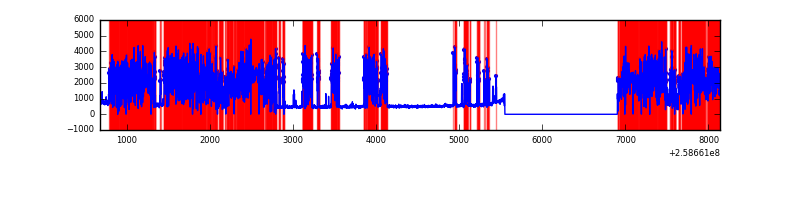 |
| C | 7460 | 6106 | 25 | 25 | 0.34% | 0.41% | 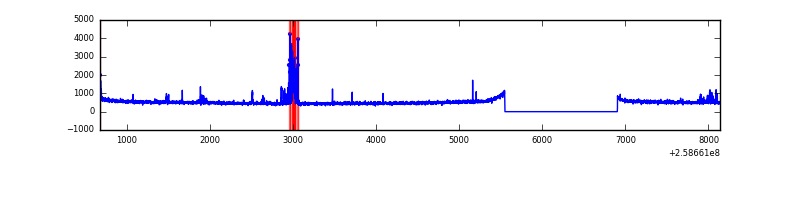 |
| D | 7460 | 6106 | 232 | 232 | 3.11% | 3.80% | 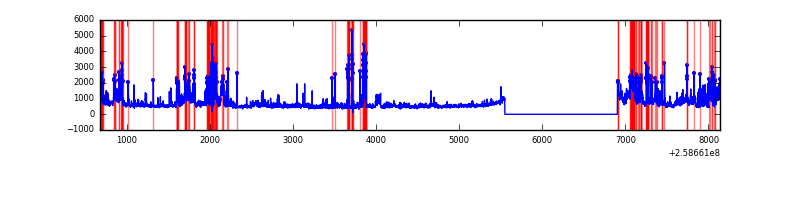 |
Top three noisy pixels from each quadrant. If the there are fewer than three noisy pixels in the level2.evt file, extra rows are filled as -1
| Pixel properties | Quadrant properties | ||||||
|---|---|---|---|---|---|---|---|
| Quadrant | DetID | PixID | Counts | Sigma | Mean | Median | Sigma |
| A | 8 | 15 | 191234 | 1176.54 | 801 | 789 | 161.9 |
| A | 1 | 162 | 19529 | 115.77 | 801 | 789 | 161.9 |
| A | 9 | 143 | 8679 | 48.74 | 801 | 789 | 161.9 |
| B | 4 | 239 | 7046665 | 77352.37 | 485 | 475 | 91.1 |
| B | 3 | 209 | 24519 | 263.95 | 485 | 475 | 91.1 |
| B | 0 | 244 | 17847 | 190.71 | 485 | 475 | 91.1 |
| C | 14 | 234 | 135919 | 744.45 | 782 | 790 | 181.5 |
| C | 15 | 208 | 48800 | 264.5 | 782 | 790 | 181.5 |
| C | 13 | 61 | 5544 | 26.19 | 782 | 790 | 181.5 |
| D | 13 | 249 | 514194 | 2814.47 | 759 | 738 | 182.4 |
| D | 13 | 104 | 467084 | 2556.24 | 759 | 738 | 182.4 |
| D | 14 | 34 | 436317 | 2387.59 | 759 | 738 | 182.4 |
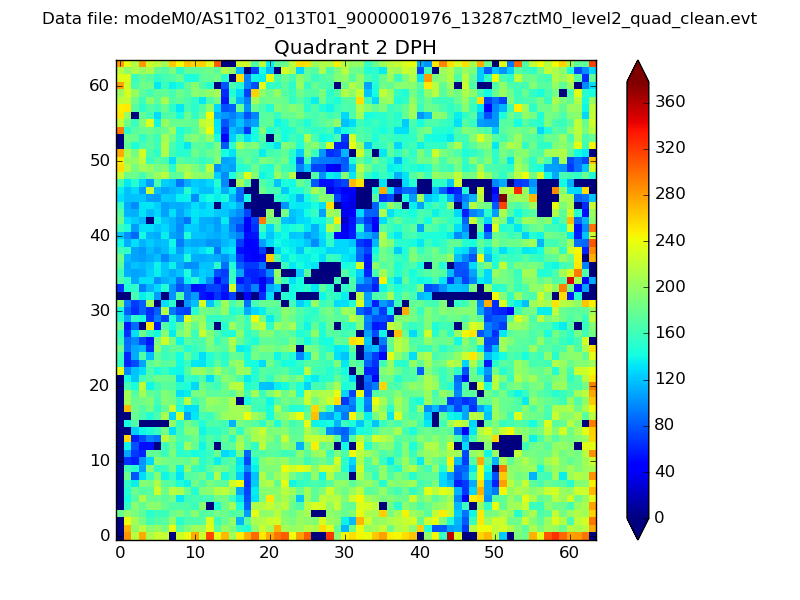
Histogram calculated using DETX and DETY for each event in the final _common_clean file
| Quadrant A |  |
 |
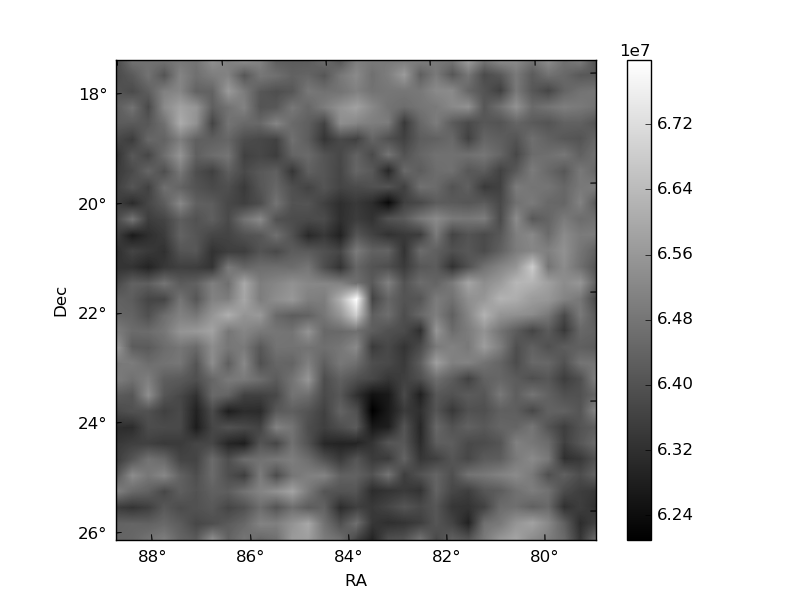
Quadrant B |
|---|---|---|---|
| Quadrant D |  |
 |
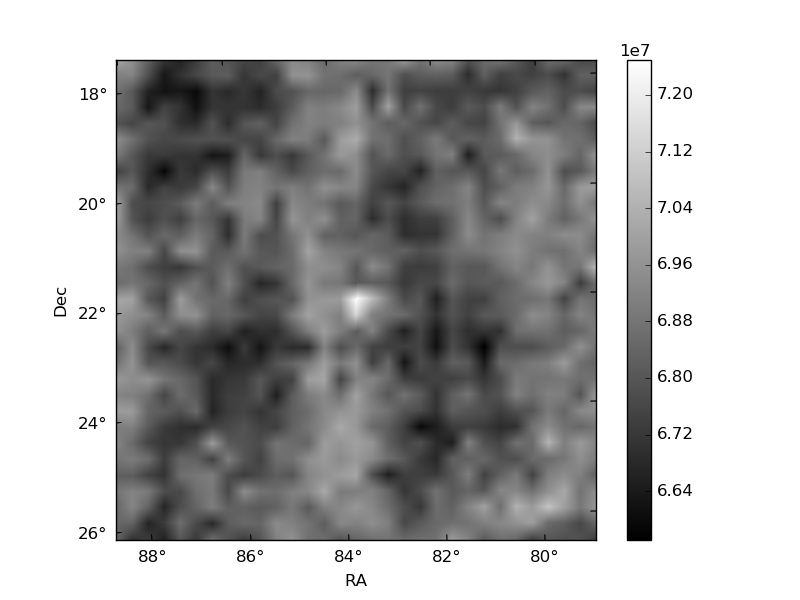
Quadrant C |
| Plot type | Count rate plots | Images |
|---|---|---|
| Comparison with Poisson distribution Blue bars denote a histogram of data divided into 1 sec bins. Red curve is a Poisson curve with rate = median count rate of data. |
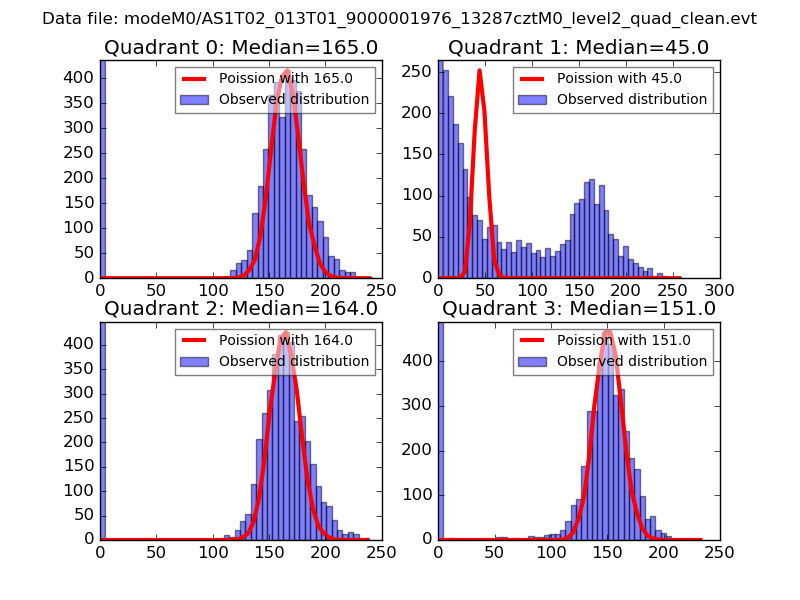 |
 |
| Quadrant-wise count rates Data is divided into 100 sec bins |
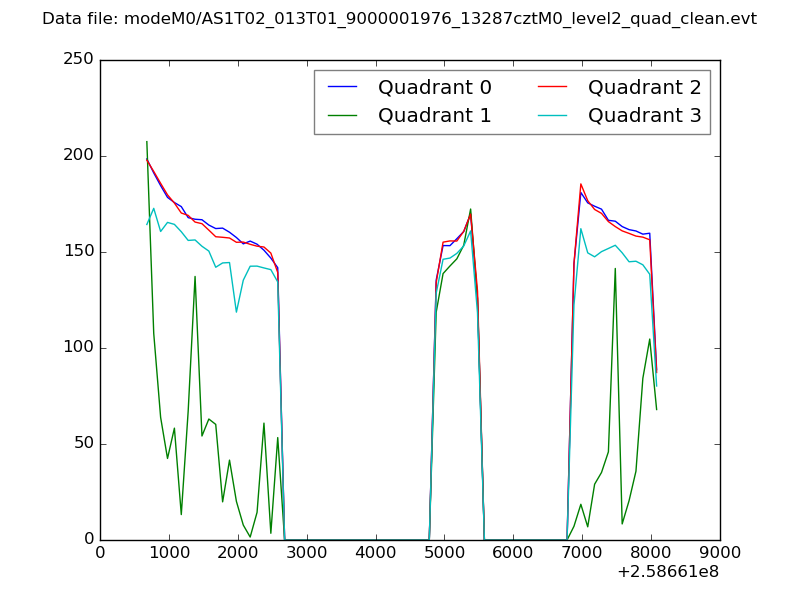 |
|
| Module-wise count rates for Quadrant A Data is divided into 100 sec bins |
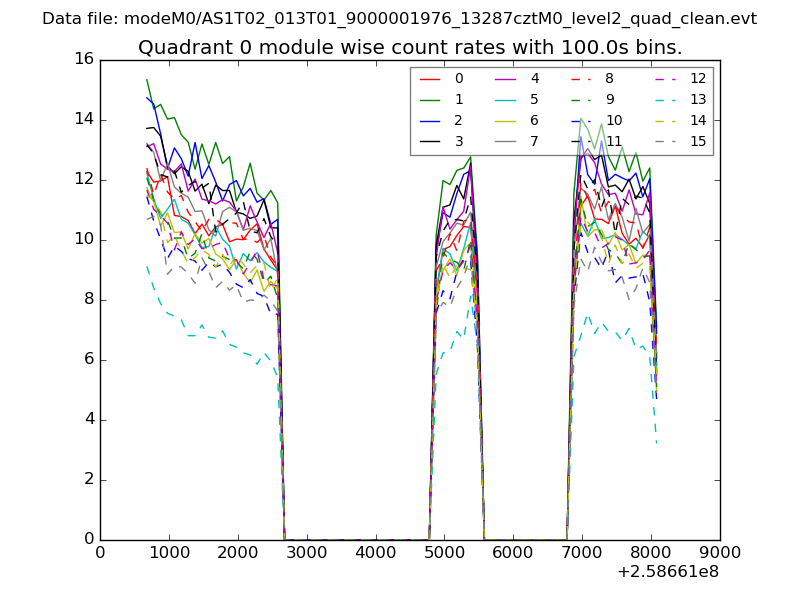 |
 |
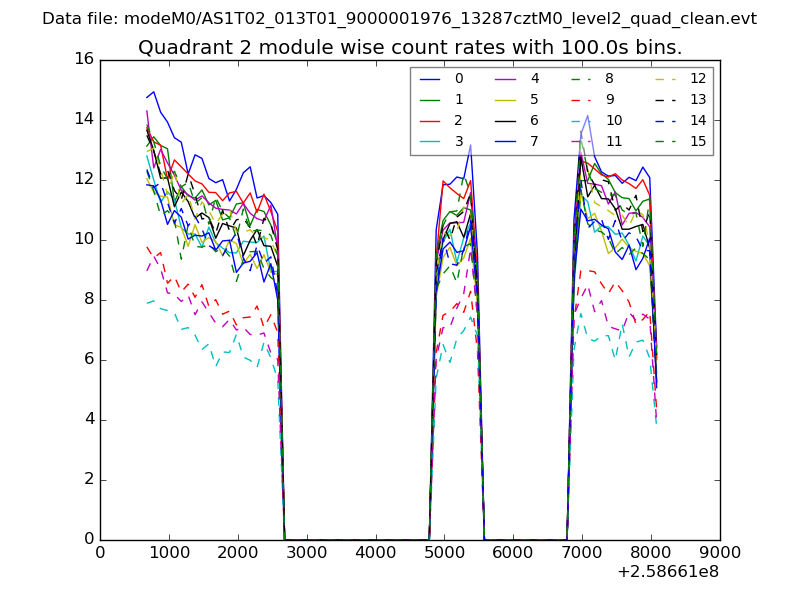
| Module-wise count rates for Quadrant B Data is divided into 100 sec bins |
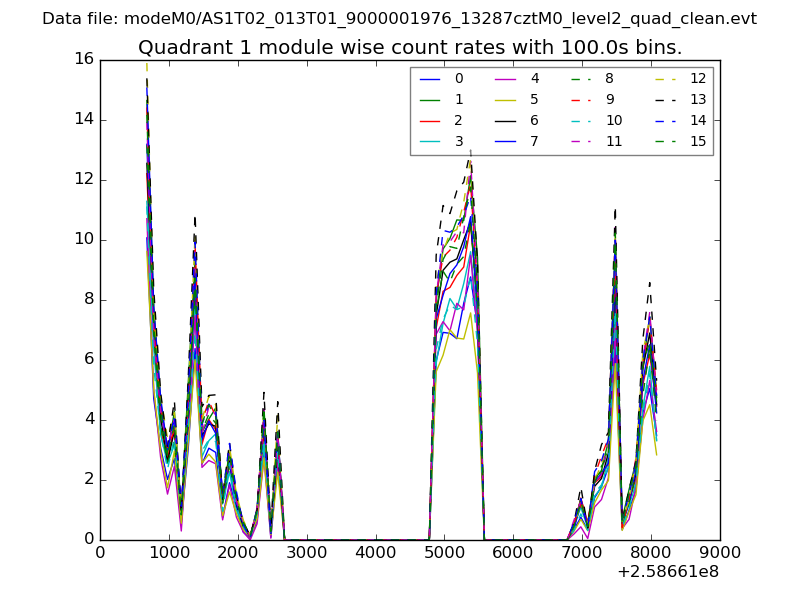 |
 |
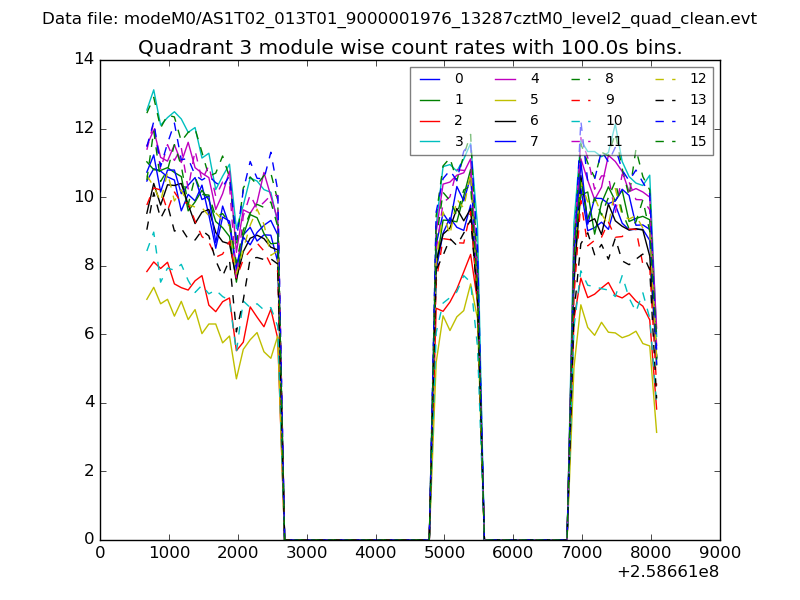
| Module-wise count rates for Quadrant C Data is divided into 100 sec bins |
 |
 |
| Module-wise count rates for Quadrant D Data is divided into 100 sec bins |
 |
 |
| Parameter | Plot |
|---|---|
| CZT HV Monitor | 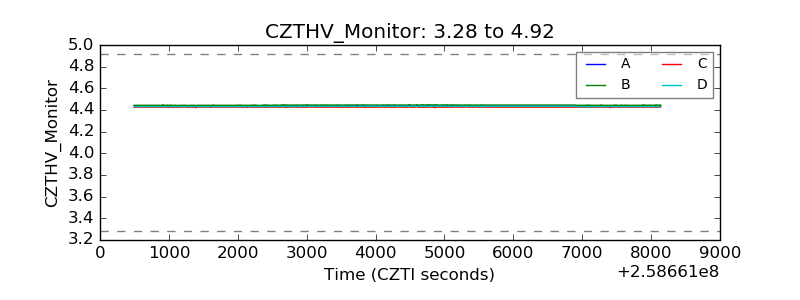 |
| D_VDD | 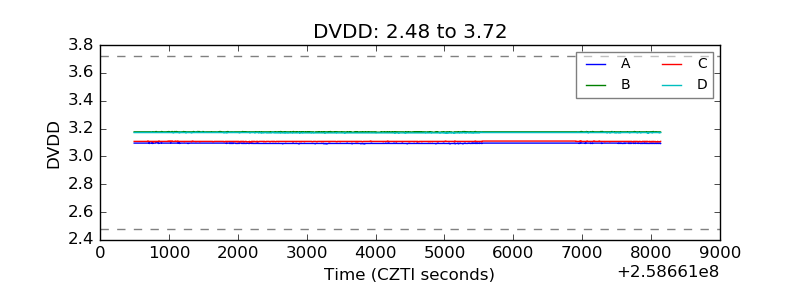 |
| Temperature 1 | 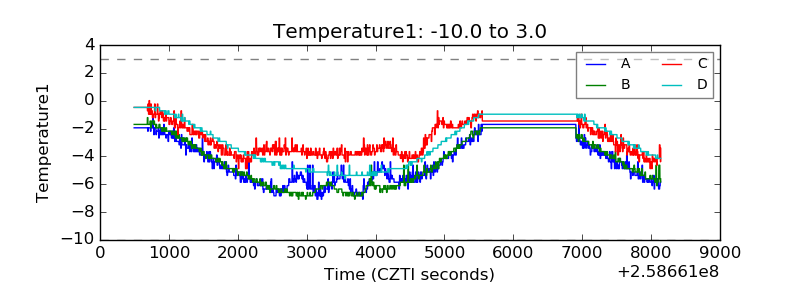 |
| Veto HV Monitor | 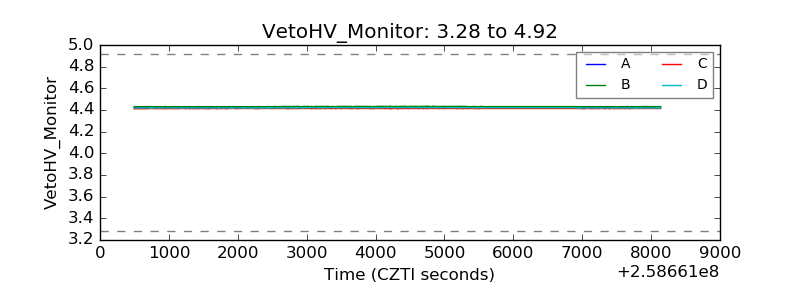 |
| Veto LLD | 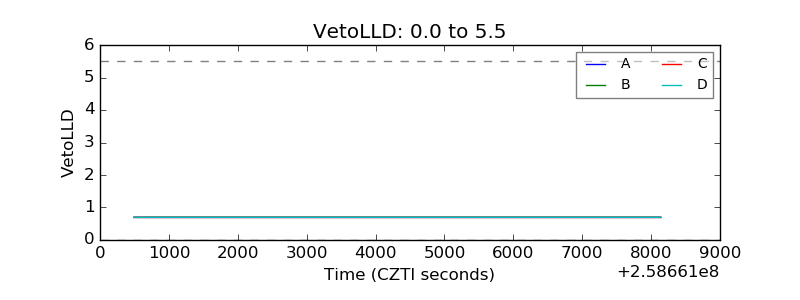 |
| Alpha Counter | 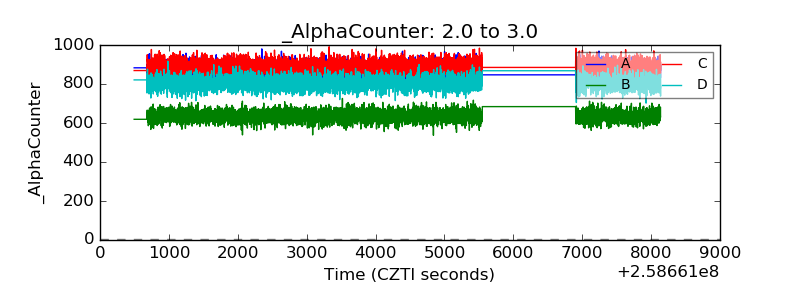 |
| _CPM_Rate | 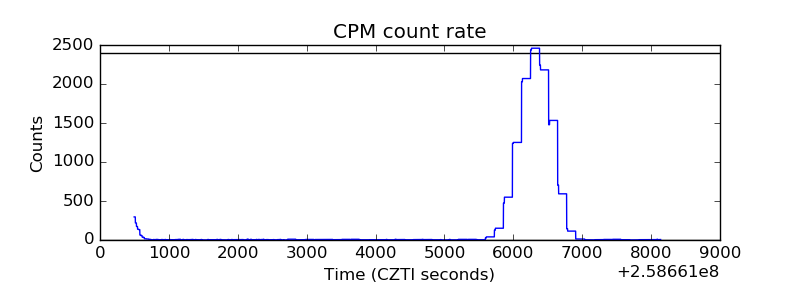 |
| CZT Counter | 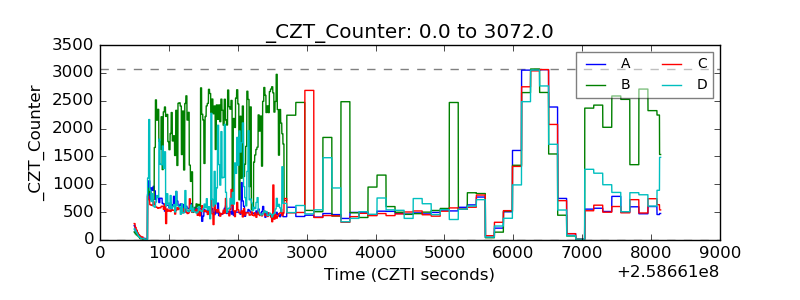 |
| +2.5 Volts monitor |  |
| +5 Volts monitor | 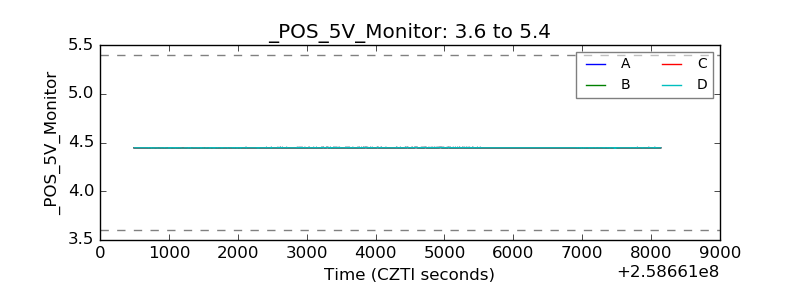 |
| _ROLL_ROT | 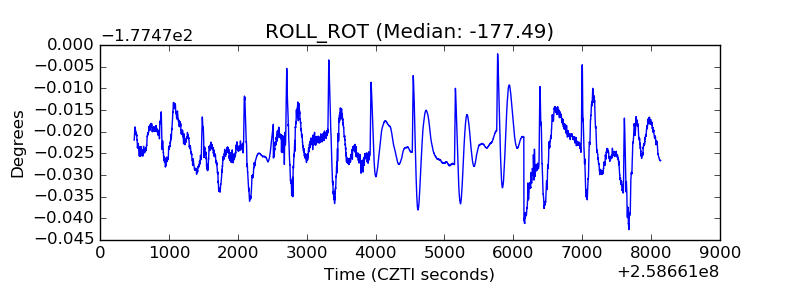 |
| _Roll_DEC | 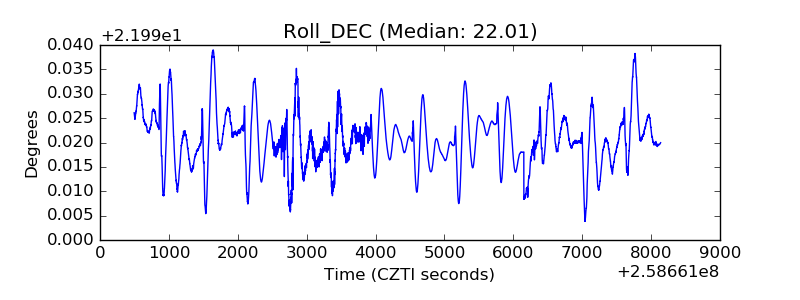 |
| _Roll_RA | 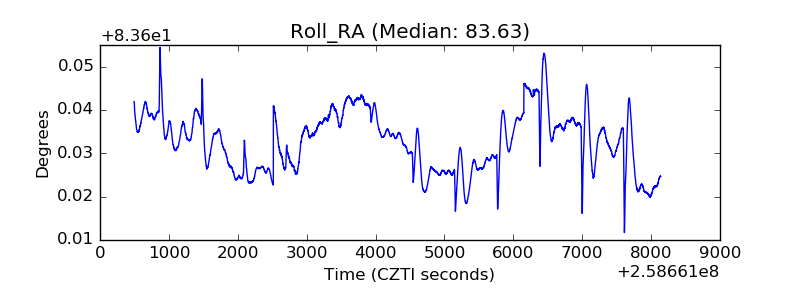 |
| Veto Counter | 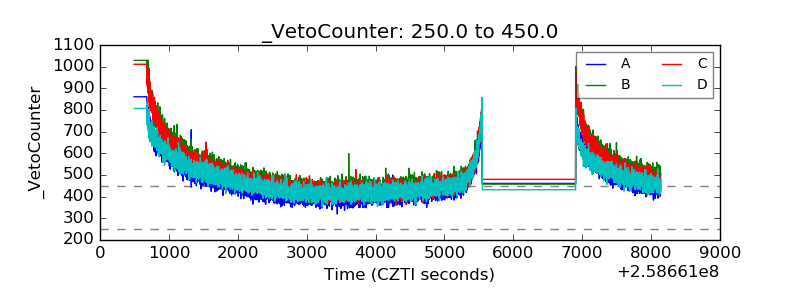 |