| Param | Original file | Final file |
|---|---|---|
| Filename | modeM0/AS1T02_013T01_9000001976_13288cztM0_level2.evt | modeM0/AS1T02_013T01_9000001976_13288cztM0_level2_quad_clean.evt |
| Size (bytes) | 629,326,080 | 84,576,960 |
| Size | 600.2 MB | 80.7 MB |
| Events in quadrant A | 3,229,282 | 614,368 |
| Events in quadrant B | 6,421,323 | 343,947 |
| Events in quadrant C | 3,245,670 | 614,985 |
| Events in quadrant D | 5,748,569 | 559,725 |
| Mode M9 | |||
|---|---|---|---|
| Quadrant | BADHDUFLAG | Total packets | Discarded packets |
| A | 0 | 19 | 0 |
| B | 0 | 19 | 0 |
| C | 0 | 19 | 0 |
| D | 0 | 20 | 0 |
| Mode SS | |||
|---|---|---|---|
| Quadrant | BADHDUFLAG | Total packets | Discarded packets |
| A | 0 | 124 | 0 |
| B | 0 | 124 | 0 |
| C | 0 | 124 | 0 |
| D | 0 | 124 | 0 |
| Mode M0 | |||
|---|---|---|---|
| Quadrant | BADHDUFLAG | Total packets | Discarded packets |
| A | 0 | 13434 | 3 |
| B | 0 | 22996 | 2 |
| C | 0 | 13379 | 2 |
| D | 0 | 21225 | 2 |
| Quadrant | Total seconds | Saturated seconds | Saturation percentage |
|---|---|---|---|
| A | 6118 | 22 | 0.359595% |
| B | 6118 | 2147 | 35.093168% |
| C | 6118 | 12 | 0.196143% |
| D | 6118 | 263 | 4.298790% |
Noise dominated data is calculated using 1-second bins in cleaned event files. If a bin has >2000 counts, and if more than 50% of those come from <1% of pixels, then it is considered to be noise-dominated and hence unusable.
| Quadrant | # 1 sec bins | Bins with >0 counts | Bins with >2000 counts | High rate bins dominated by noise | Noise dominated (total time) | Noise dominated (detector-on time) | Marked lightcurve |
|---|---|---|---|---|---|---|---|
| A | 7504 | 6120 | 2 | 2 | 0.03% | 0.03% | 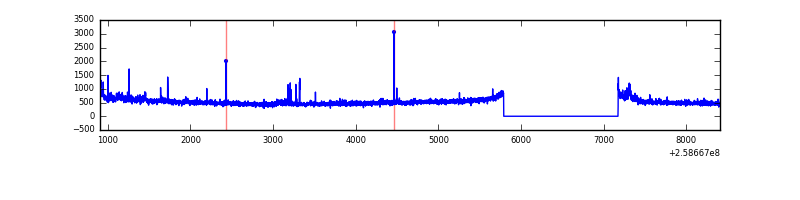 |
| B | 7504 | 6119 | 1136 | 1136 | 15.14% | 18.57% | 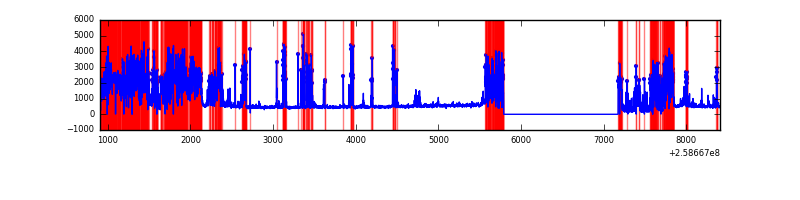 |
| C | 7504 | 6120 | 4 | 4 | 0.05% | 0.07% | 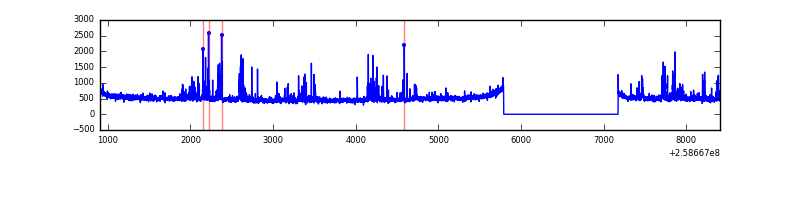 |
| D | 7504 | 6120 | 366 | 366 | 4.88% | 5.98% | 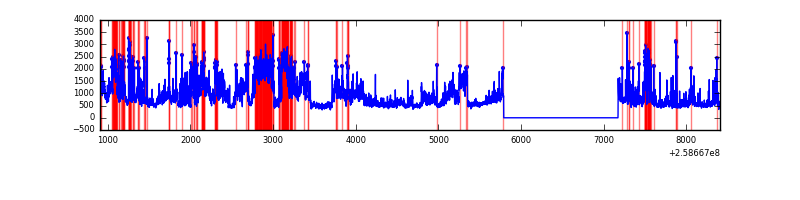 |
Top three noisy pixels from each quadrant. If the there are fewer than three noisy pixels in the level2.evt file, extra rows are filled as -1
| Pixel properties | Quadrant properties | ||||||
|---|---|---|---|---|---|---|---|
| Quadrant | DetID | PixID | Counts | Sigma | Mean | Median | Sigma |
| A | 8 | 15 | 163804 | 1032.36 | 780 | 767 | 157.9 |
| A | 1 | 162 | 25951 | 159.47 | 780 | 767 | 157.9 |
| A | 15 | 69 | 12906 | 76.86 | 780 | 767 | 157.9 |
| B | 4 | 239 | 4151597 | 39643.24 | 556 | 545 | 104.7 |
| B | 3 | 209 | 19496 | 180.99 | 556 | 545 | 104.7 |
| B | 4 | 142 | 17249 | 159.53 | 556 | 545 | 104.7 |
| C | 15 | 208 | 252335 | 1408.18 | 765 | 774 | 178.6 |
| C | 6 | 96 | 11115 | 57.89 | 765 | 774 | 178.6 |
| C | 13 | 61 | 5560 | 26.79 | 765 | 774 | 178.6 |
| D | 13 | 104 | 1862009 | 10471.54 | 741 | 723 | 177.7 |
| D | 14 | 34 | 450432 | 2530.05 | 741 | 723 | 177.7 |
| D | 13 | 249 | 290875 | 1632.39 | 741 | 723 | 177.7 |
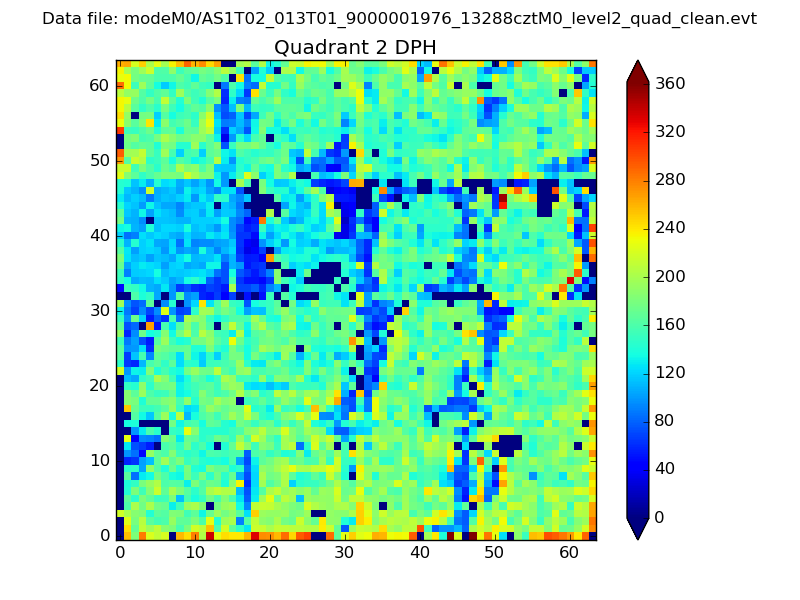
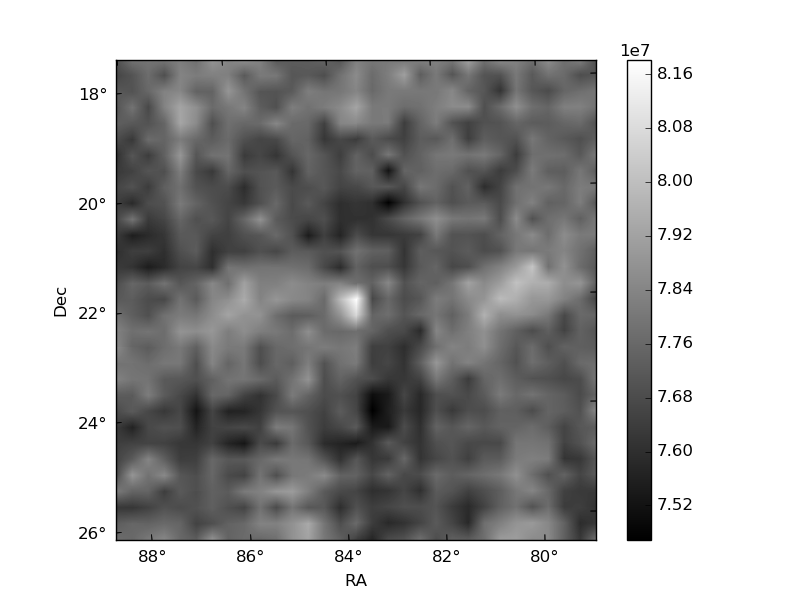
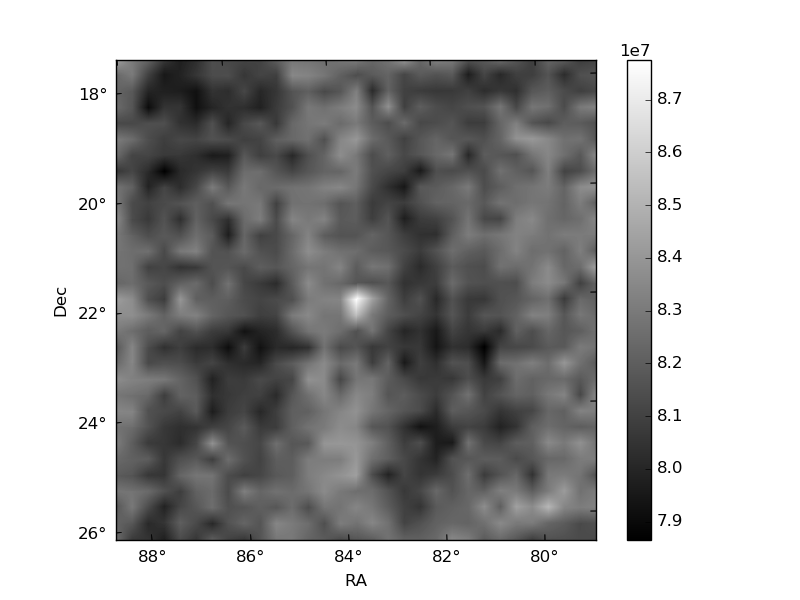
Histogram calculated using DETX and DETY for each event in the final _common_clean file
| Quadrant A |  |
 |
Quadrant B |
|---|---|---|---|
| Quadrant D | 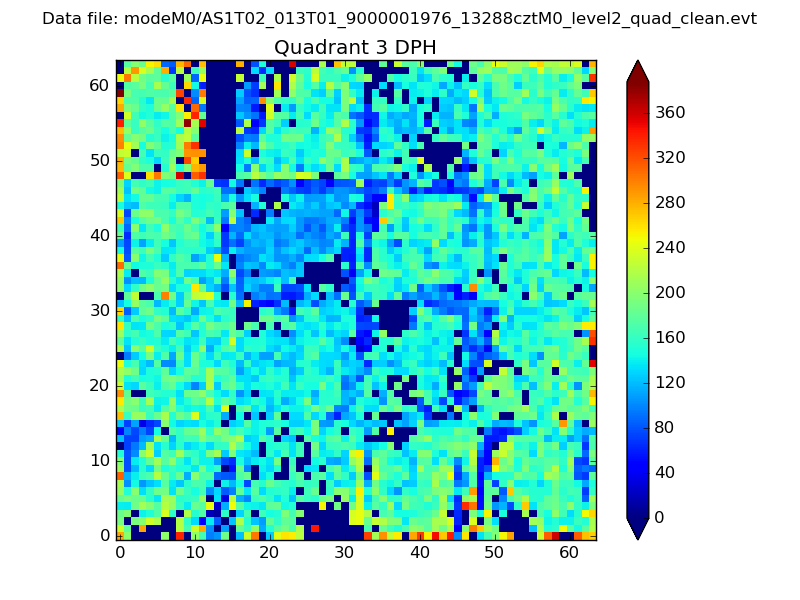 |
 |
Quadrant C |
| Plot type | Count rate plots | Images |
|---|---|---|
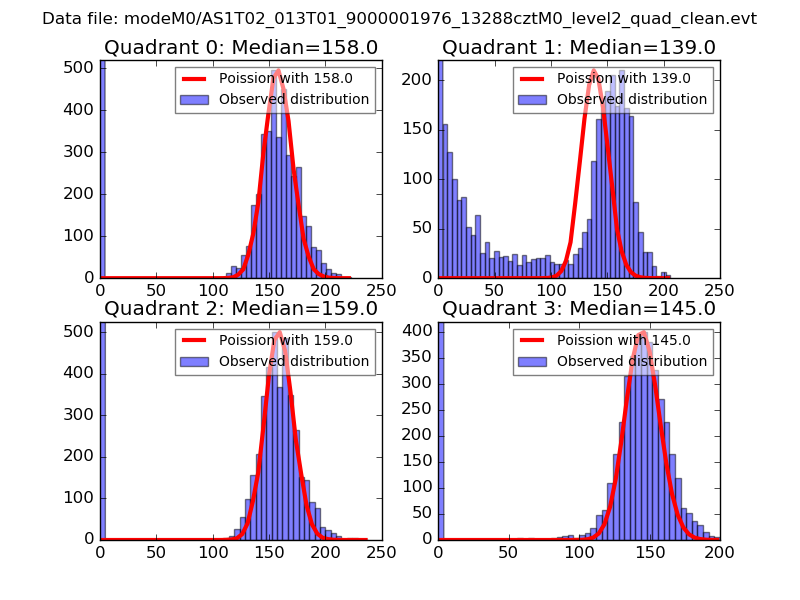
| Comparison with Poisson distribution Blue bars denote a histogram of data divided into 1 sec bins. Red curve is a Poisson curve with rate = median count rate of data. |
 |
 |
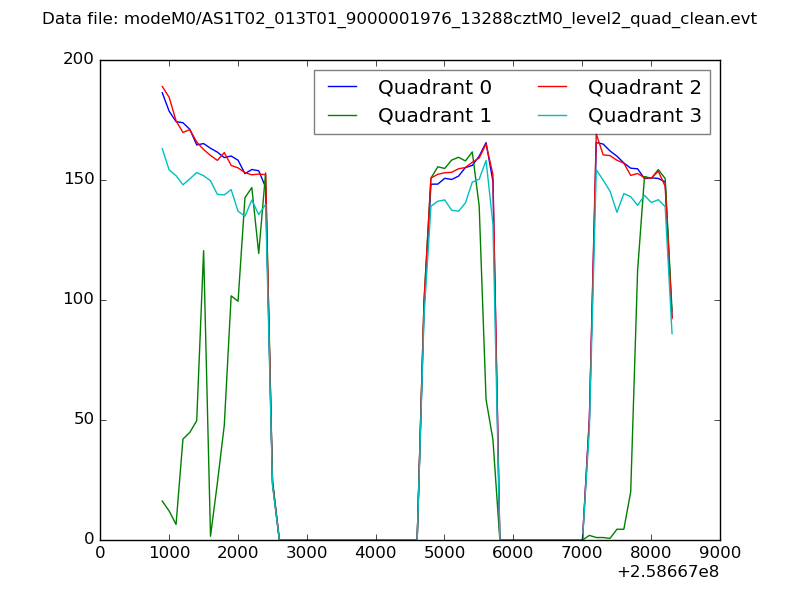
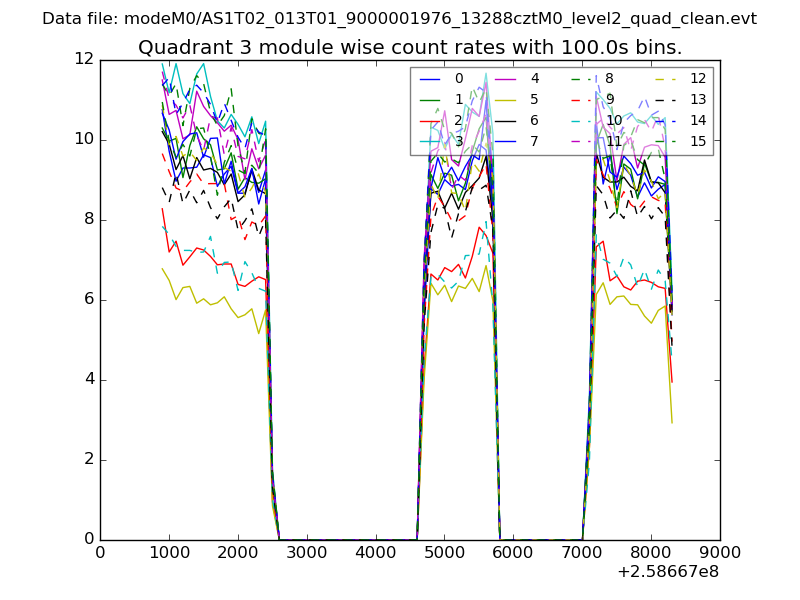
| Quadrant-wise count rates Data is divided into 100 sec bins |
 |
|
| Module-wise count rates for Quadrant A Data is divided into 100 sec bins |
 |
 |
| Module-wise count rates for Quadrant B Data is divided into 100 sec bins |
 |
 |
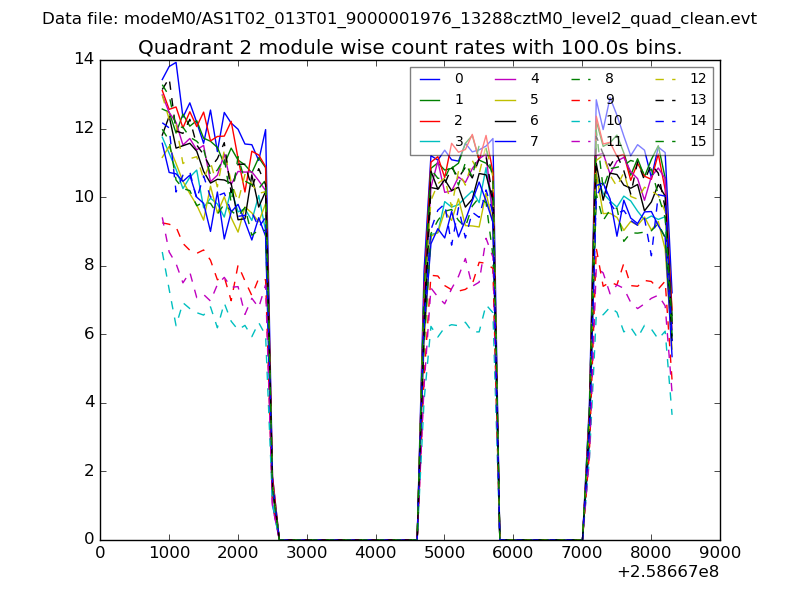
| Module-wise count rates for Quadrant C Data is divided into 100 sec bins |
 |
 |
| Module-wise count rates for Quadrant D Data is divided into 100 sec bins |
 |
 |
| Parameter | Plot |
|---|---|
| CZT HV Monitor | 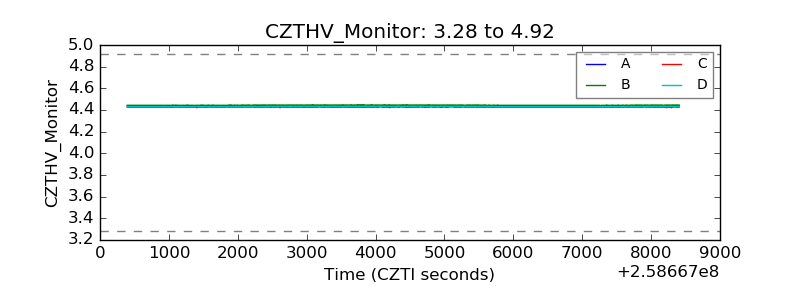 |
| D_VDD | 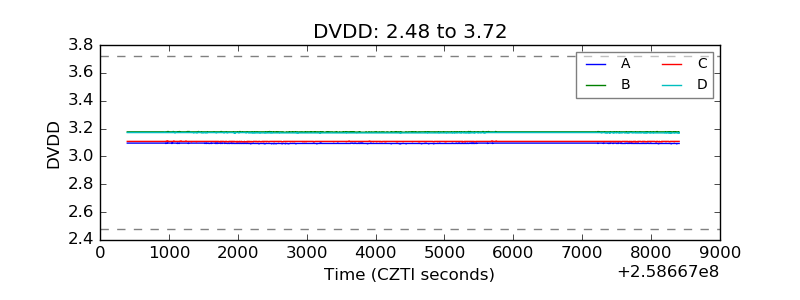 |
| Temperature 1 | 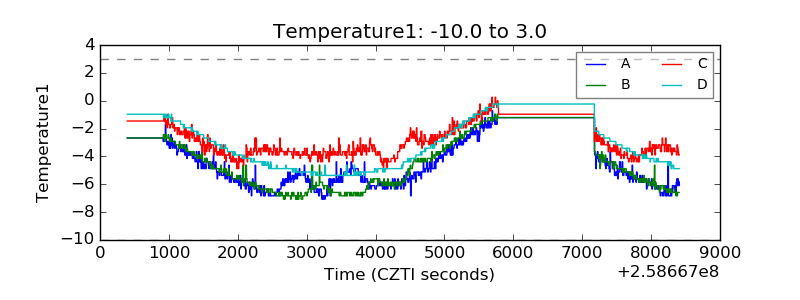 |
| Veto HV Monitor | 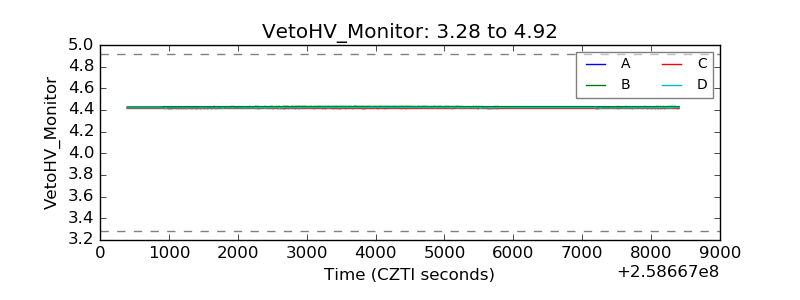 |
| Veto LLD | 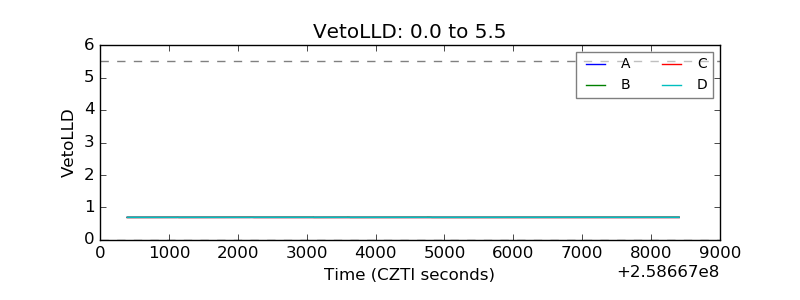 |
| Alpha Counter | 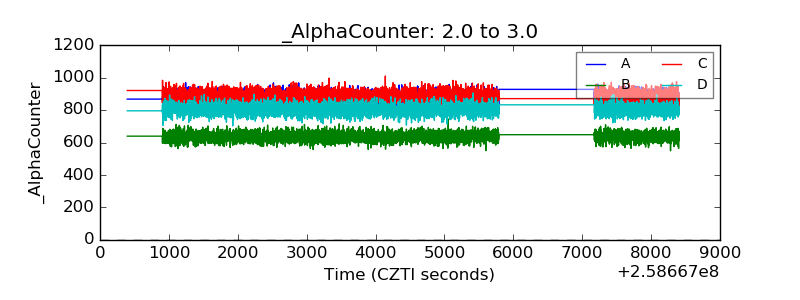 |
| _CPM_Rate | 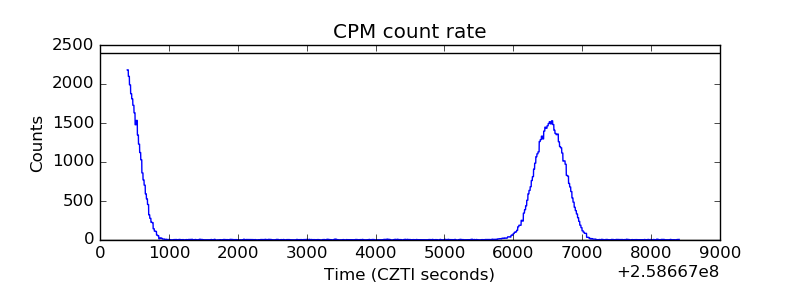 |
| CZT Counter | 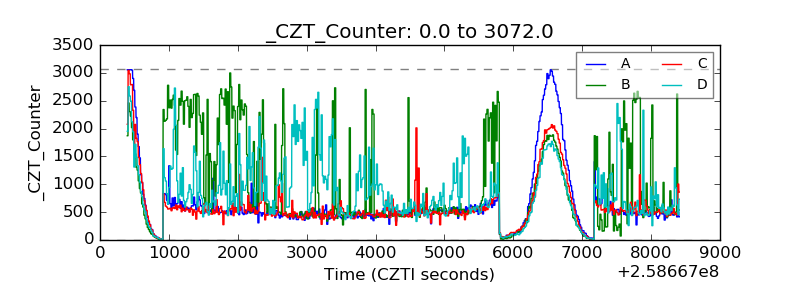 |
| +2.5 Volts monitor |  |
| +5 Volts monitor | 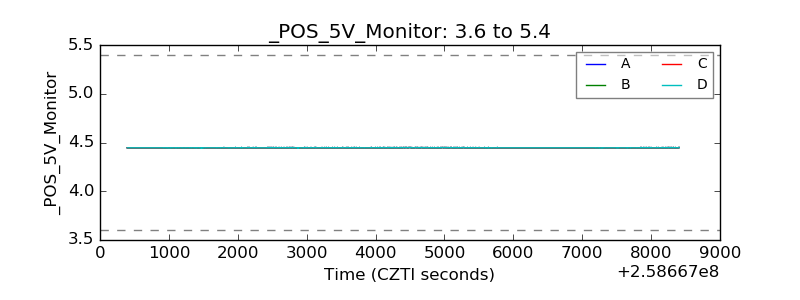 |
| _ROLL_ROT | 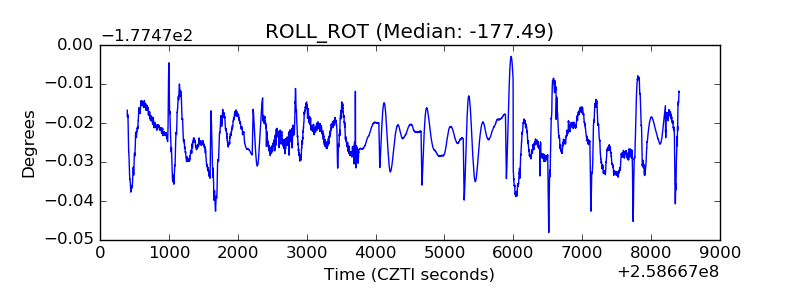 |
| _Roll_DEC | 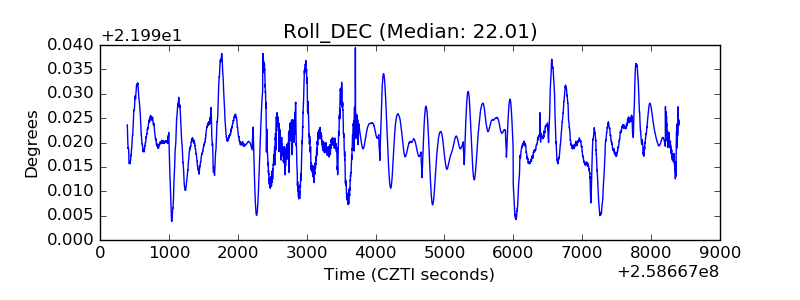 |
| _Roll_RA | 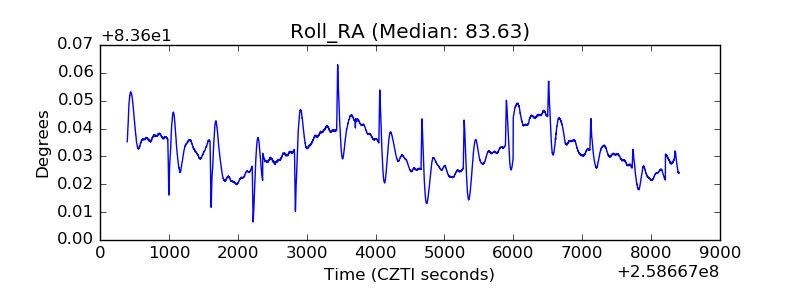 |
| Veto Counter | 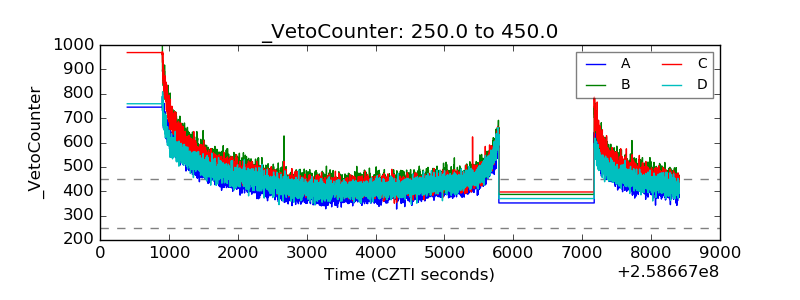 |