| Param | Original file | Final file |
|---|---|---|
| Filename | modeM0/AS1T02_013T01_9000001976_13289cztM0_level2.evt | modeM0/AS1T02_013T01_9000001976_13289cztM0_level2_quad_clean.evt |
| Size (bytes) | 666,743,040 | 79,649,280 |
| Size | 635.9 MB | 76.0 MB |
| Events in quadrant A | 3,176,179 | 567,553 |
| Events in quadrant B | 6,354,724 | 324,016 |
| Events in quadrant C | 3,325,696 | 567,172 |
| Events in quadrant D | 6,902,292 | 505,233 |
| Mode M9 | |||
|---|---|---|---|
| Quadrant | BADHDUFLAG | Total packets | Discarded packets |
| A | 0 | 20 | 0 |
| B | 0 | 20 | 0 |
| C | 0 | 20 | 0 |
| D | 0 | 21 | 0 |
| Mode SS | |||
|---|---|---|---|
| Quadrant | BADHDUFLAG | Total packets | Discarded packets |
| A | 0 | 130 | 0 |
| B | 0 | 130 | 0 |
| C | 0 | 130 | 0 |
| D | 0 | 130 | 0 |
| Mode M0 | |||
|---|---|---|---|
| Quadrant | BADHDUFLAG | Total packets | Discarded packets |
| A | 0 | 13543 | 3 |
| B | 0 | 22988 | 2 |
| C | 0 | 13928 | 2 |
| D | 0 | 24858 | 2 |
| Quadrant | Total seconds | Saturated seconds | Saturation percentage |
|---|---|---|---|
| A | 6404 | 31 | 0.484072% |
| B | 6404 | 2090 | 32.635853% |
| C | 6404 | 42 | 0.655840% |
| D | 6404 | 600 | 9.369144% |
Noise dominated data is calculated using 1-second bins in cleaned event files. If a bin has >2000 counts, and if more than 50% of those come from <1% of pixels, then it is considered to be noise-dominated and hence unusable.
| Quadrant | # 1 sec bins | Bins with >0 counts | Bins with >2000 counts | High rate bins dominated by noise | Noise dominated (total time) | Noise dominated (detector-on time) | Marked lightcurve |
|---|---|---|---|---|---|---|---|
| A | 7505 | 6406 | 1 | 1 | 0.01% | 0.02% | 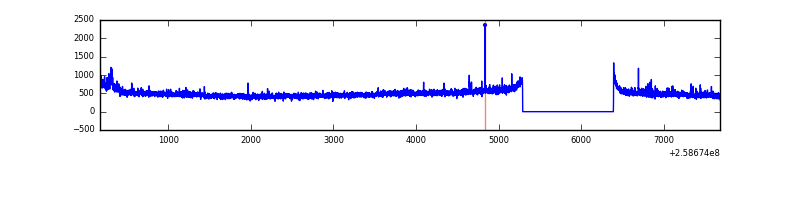 |
| B | 7505 | 6405 | 1096 | 1096 | 14.60% | 17.11% | 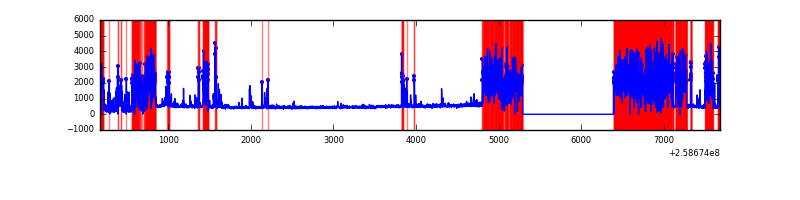 |
| C | 7505 | 6406 | 17 | 17 | 0.23% | 0.27% | 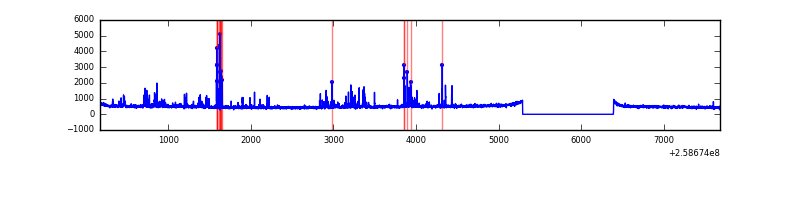 |
| D | 7505 | 6406 | 516 | 516 | 6.88% | 8.05% | 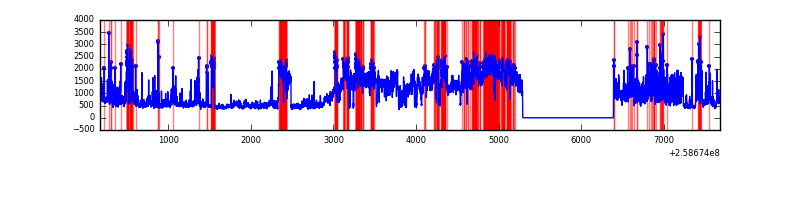 |
Top three noisy pixels from each quadrant. If the there are fewer than three noisy pixels in the level2.evt file, extra rows are filled as -1
| Pixel properties | Quadrant properties | ||||||
|---|---|---|---|---|---|---|---|
| Quadrant | DetID | PixID | Counts | Sigma | Mean | Median | Sigma |
| A | 8 | 15 | 60335 | 366.05 | 799 | 787 | 162.7 |
| A | 9 | 143 | 17374 | 101.96 | 799 | 787 | 162.7 |
| A | 1 | 162 | 14391 | 83.63 | 799 | 787 | 162.7 |
| B | 4 | 239 | 3944998 | 35370.81 | 581 | 570 | 111.5 |
| B | 10 | 245 | 64159 | 570.22 | 581 | 570 | 111.5 |
| B | 0 | 189 | 14049 | 120.87 | 581 | 570 | 111.5 |
| C | 15 | 208 | 276673 | 1524.48 | 781 | 789 | 181.0 |
| C | 13 | 61 | 5652 | 26.87 | 781 | 789 | 181.0 |
| C | 6 | 96 | 3427 | 14.58 | 781 | 789 | 181.0 |
| D | 1 | 52 | 2473699 | 13624.06 | 750 | 730 | 181.5 |
| D | 5 | 222 | 715278 | 3936.58 | 750 | 730 | 181.5 |
| D | 8 | 195 | 232957 | 1279.38 | 750 | 730 | 181.5 |
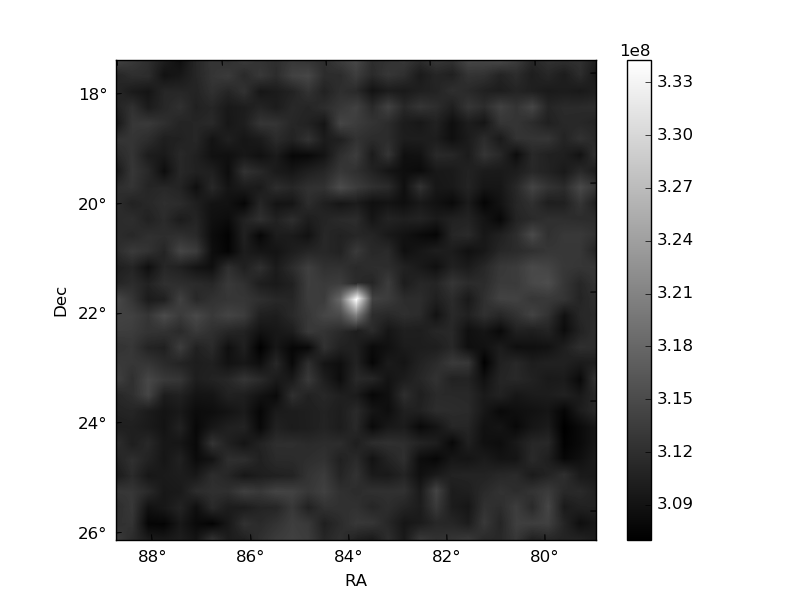
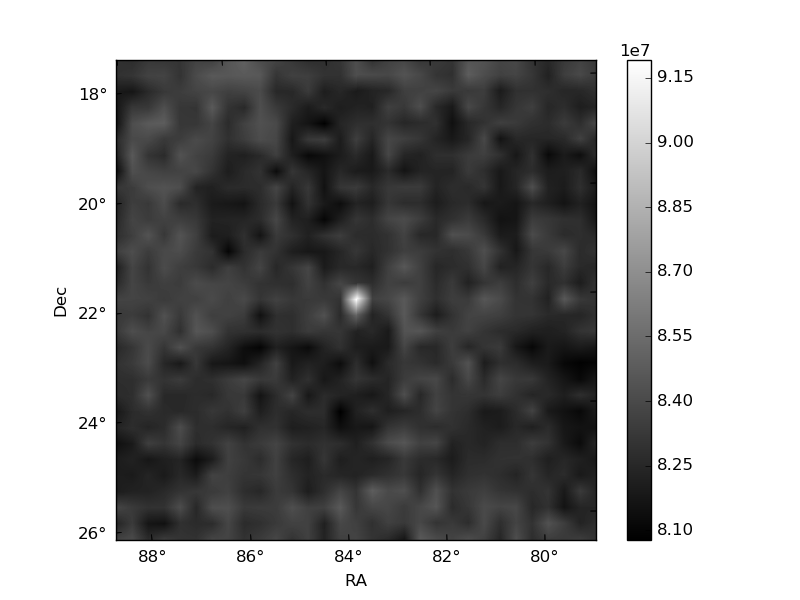
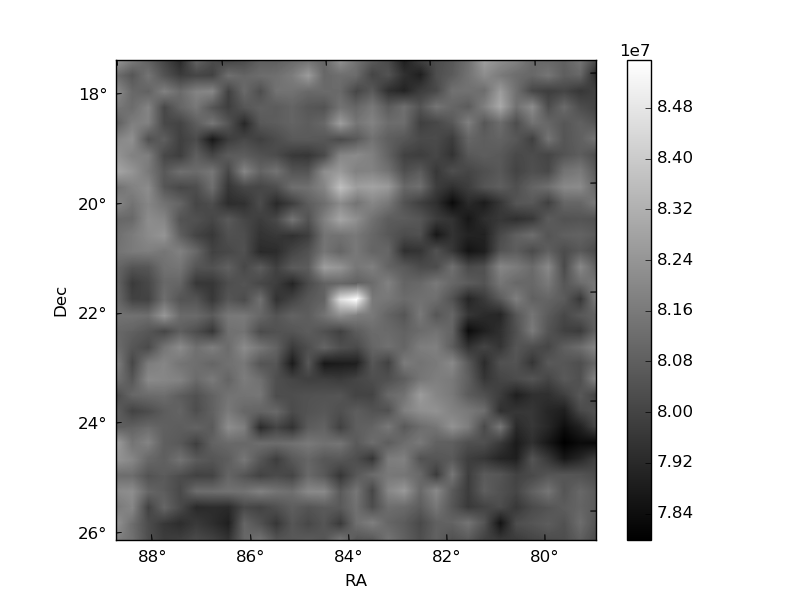
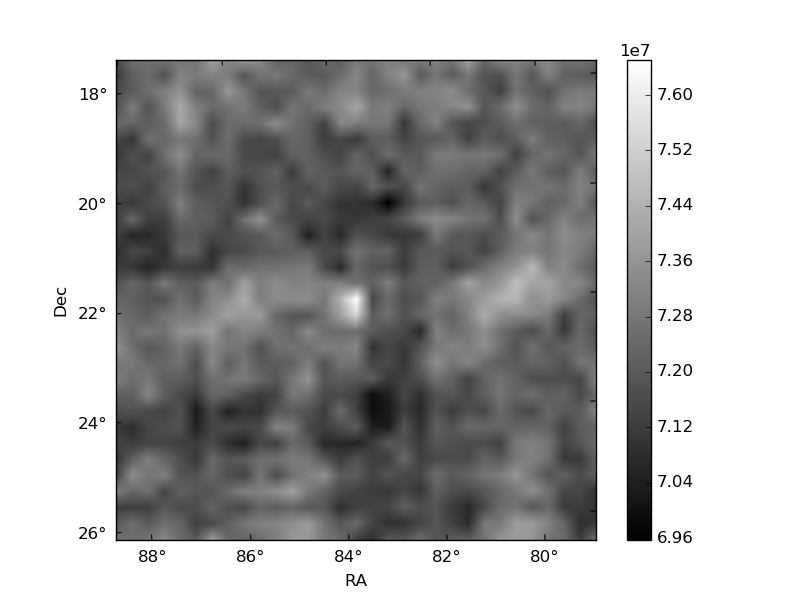
Histogram calculated using DETX and DETY for each event in the final _common_clean file
| Quadrant A | 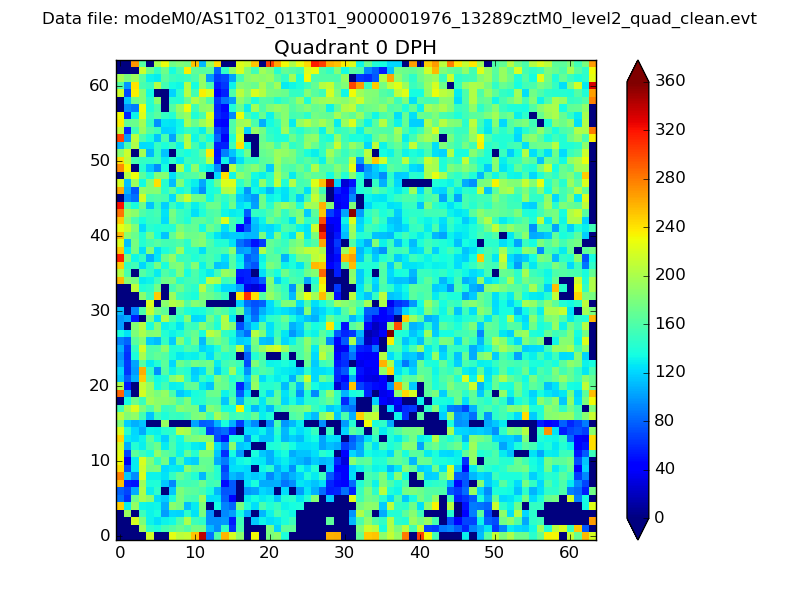 |
 |
Quadrant B |
|---|---|---|---|
| Quadrant D | 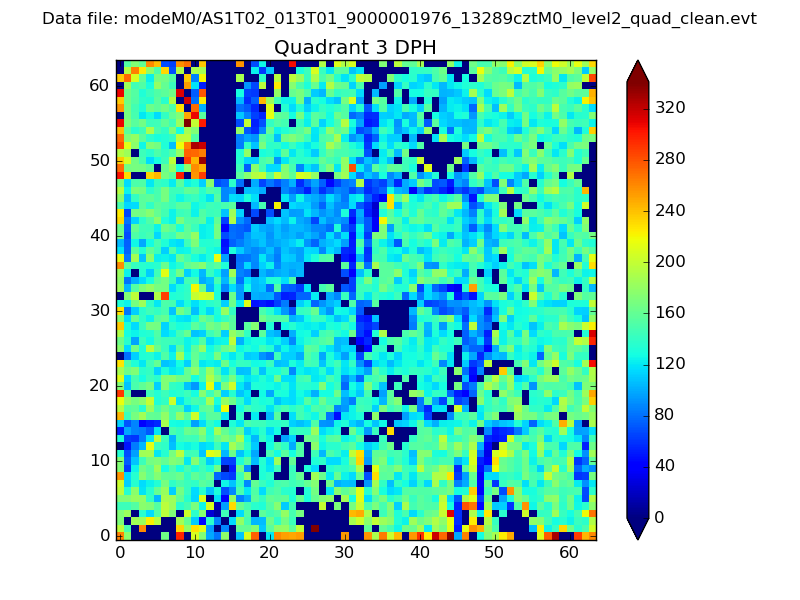 |
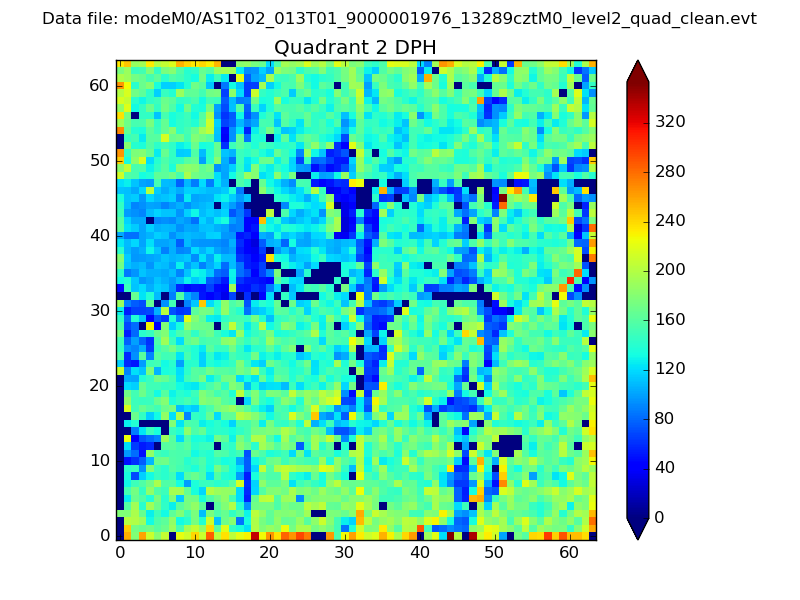 |
Quadrant C |
| Plot type | Count rate plots | Images |
|---|---|---|
| Comparison with Poisson distribution Blue bars denote a histogram of data divided into 1 sec bins. Red curve is a Poisson curve with rate = median count rate of data. |
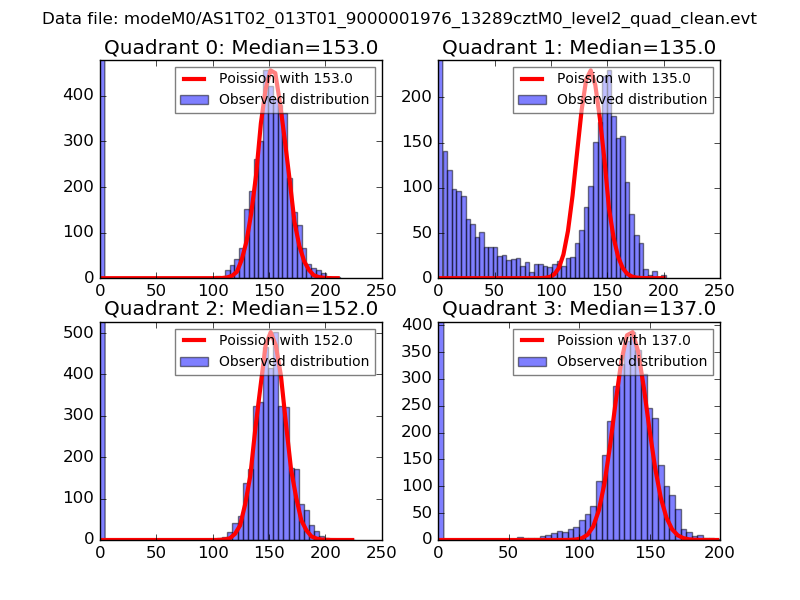 |
 |
| Quadrant-wise count rates Data is divided into 100 sec bins |
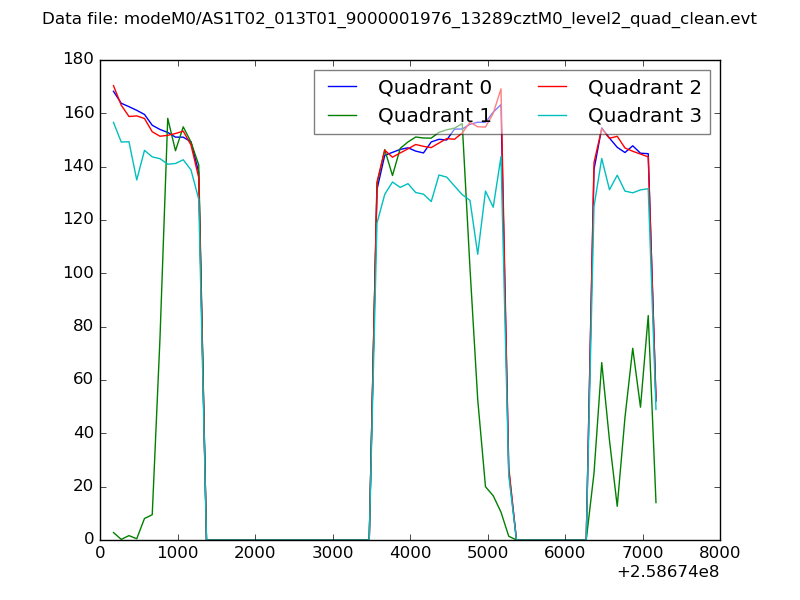 |
|
| Module-wise count rates for Quadrant A Data is divided into 100 sec bins |
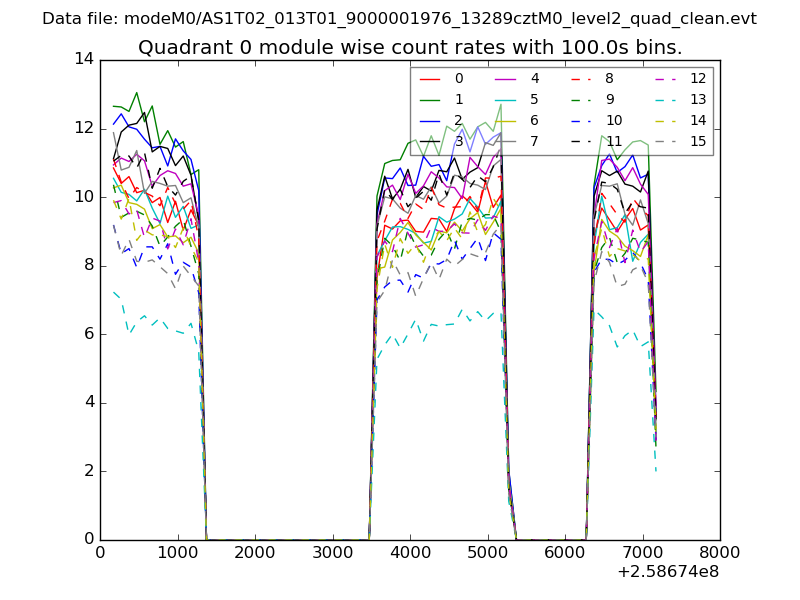 |
 |
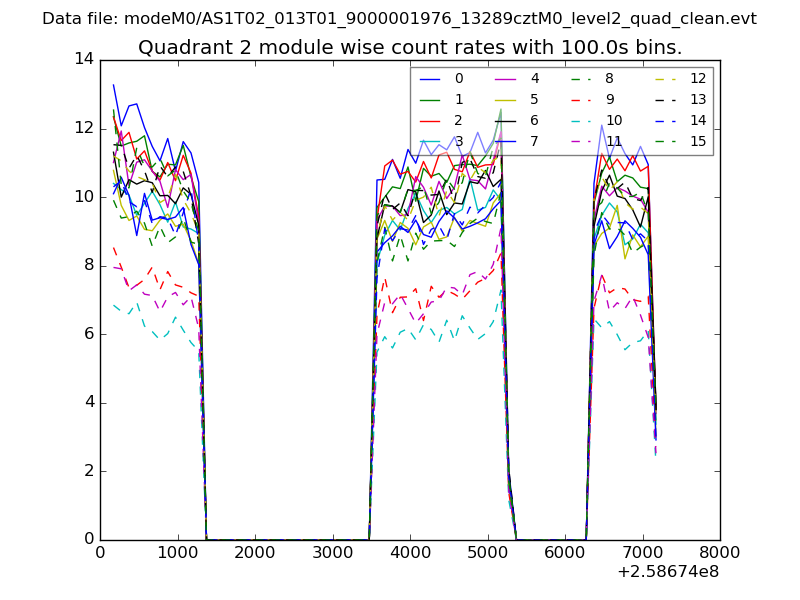
| Module-wise count rates for Quadrant B Data is divided into 100 sec bins |
 |
 |
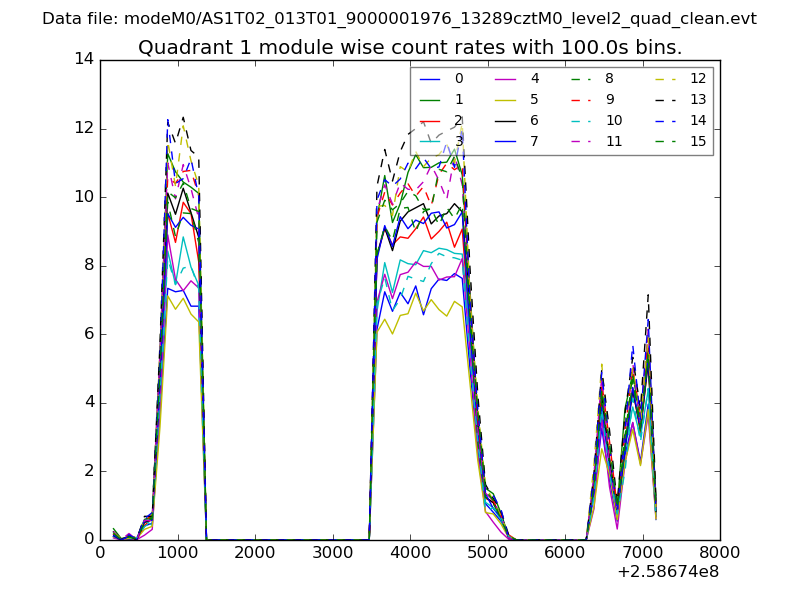
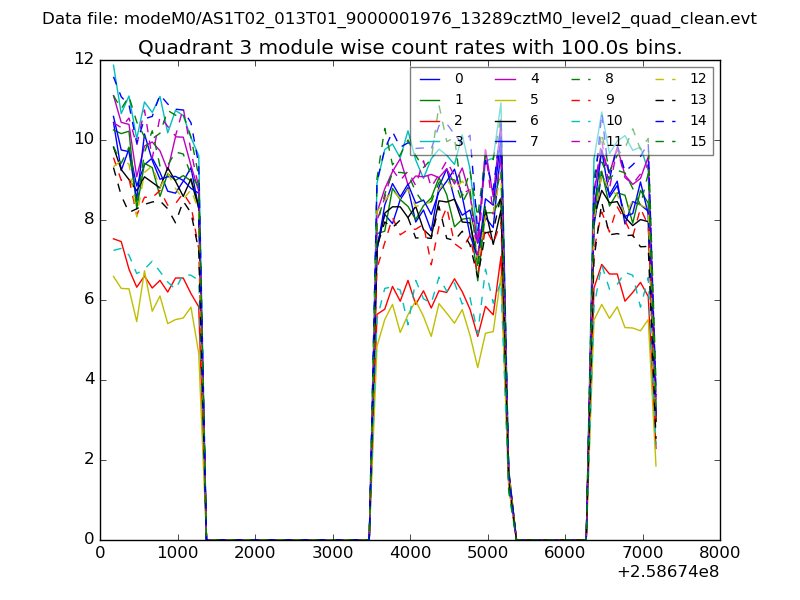
| Module-wise count rates for Quadrant C Data is divided into 100 sec bins |
 |
 |
| Module-wise count rates for Quadrant D Data is divided into 100 sec bins |
 |
 |
| Parameter | Plot |
|---|---|
| CZT HV Monitor |  |
| D_VDD | 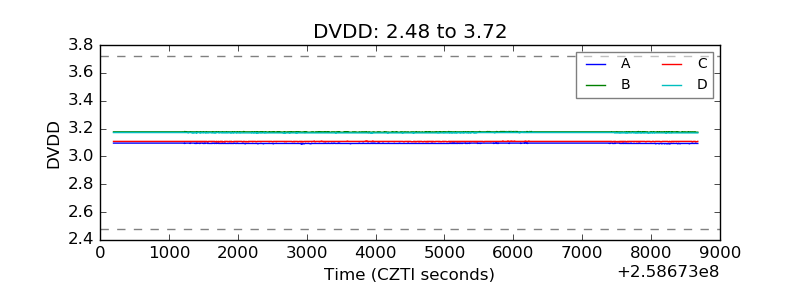 |
| Temperature 1 | 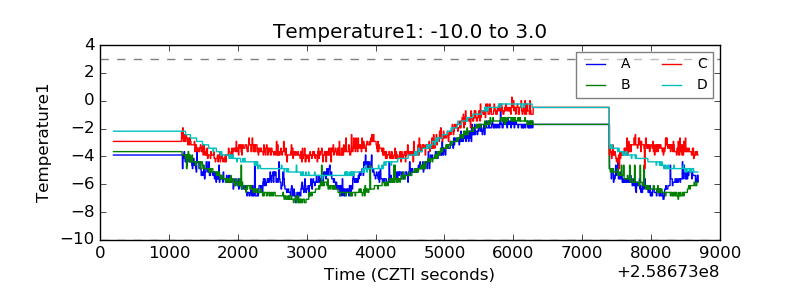 |
| Veto HV Monitor | 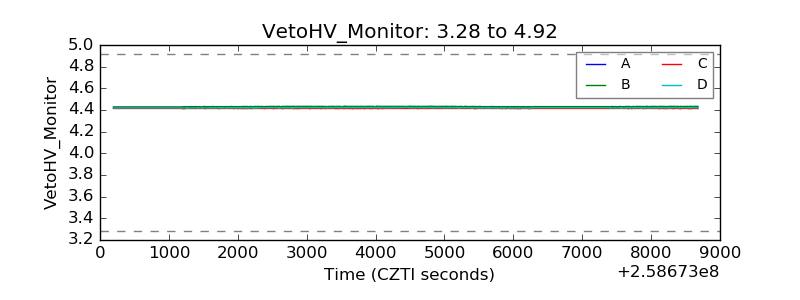 |
| Veto LLD | 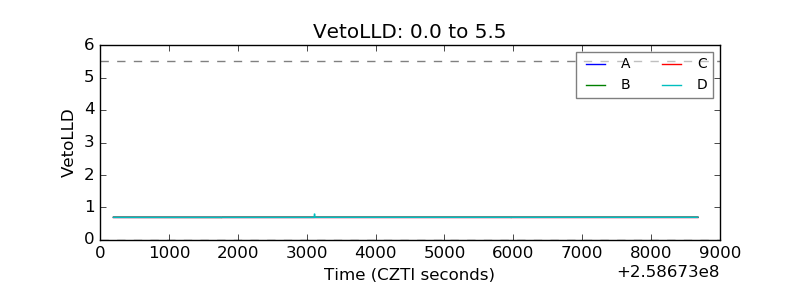 |
| Alpha Counter | 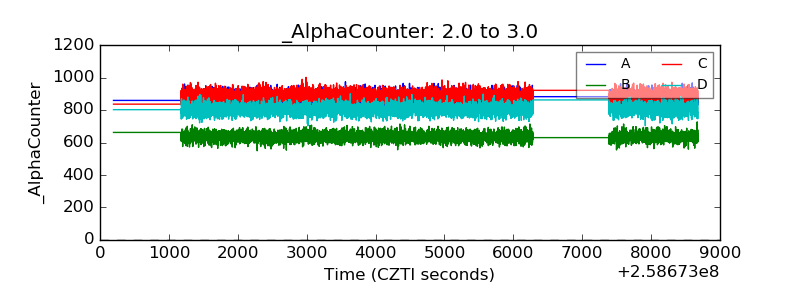 |
| _CPM_Rate | 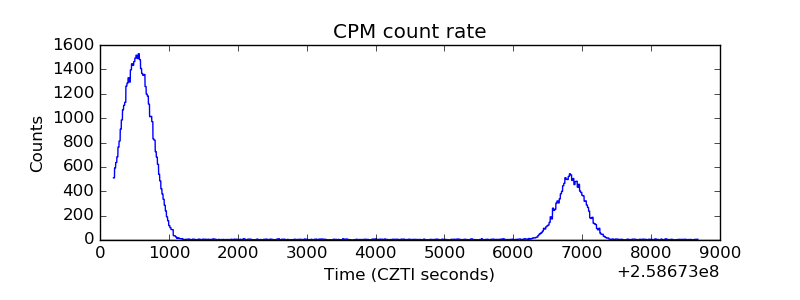 |
| CZT Counter | 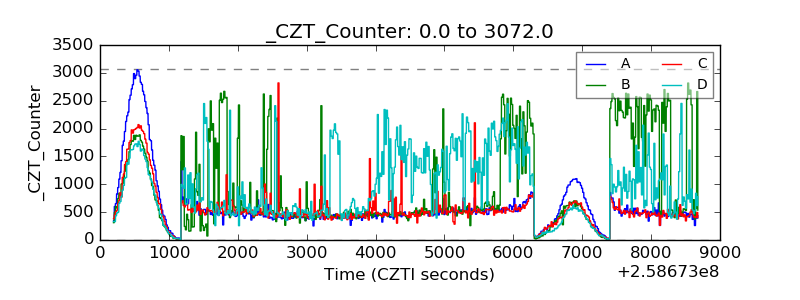 |
| +2.5 Volts monitor |  |
| +5 Volts monitor |  |
| _ROLL_ROT | 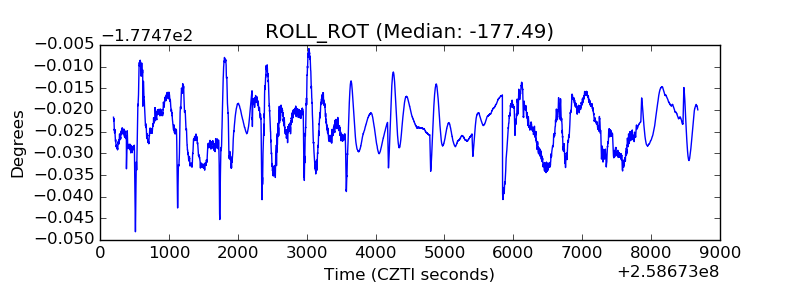 |
| _Roll_DEC | 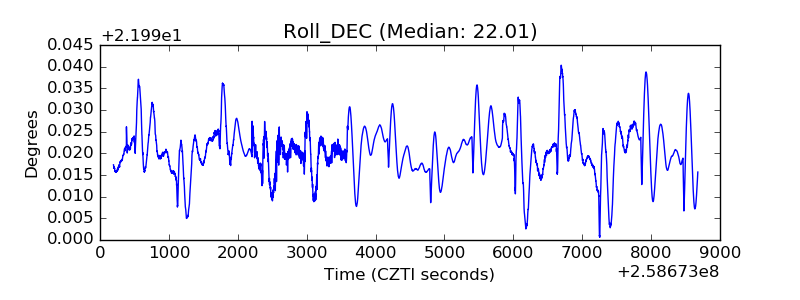 |
| _Roll_RA | 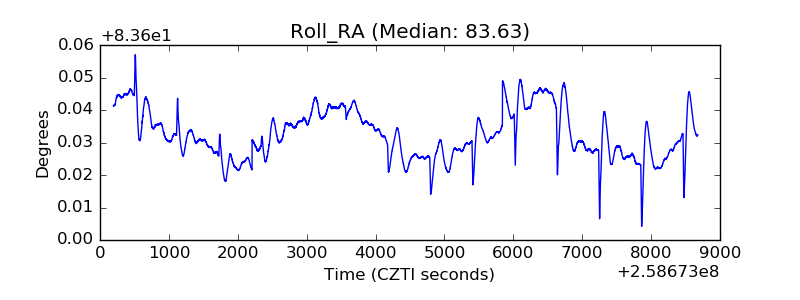 |
| Veto Counter | 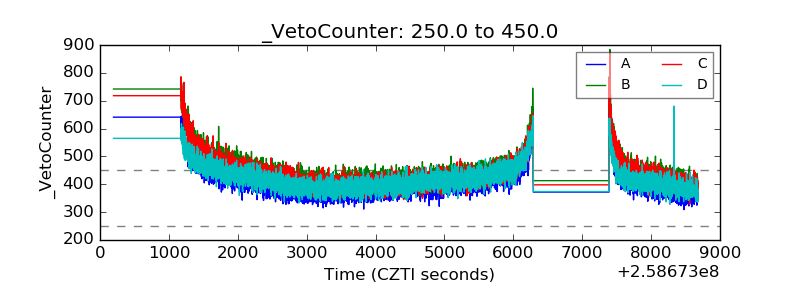 |