| Param | Original file | Final file |
|---|---|---|
| Filename | modeM0/AS1T02_013T01_9000001976_13290cztM0_level2.fits | modeM0/AS1T02_013T01_9000001976_13290cztM0_level2_quad_clean.evt |
| Size (bytes) | 482,060,160 | 113,460,480 |
| Size | 459.7 MB | 108.2 MB |
| Events in quadrant A | 3,671,460 | 839,345 |
| Events in quadrant B | 6,367,875 | 539,992 |
| Events in quadrant C | 3,228,041 | 829,797 |
| Events in quadrant D | 4,046,589 | 752,185 |
| Mode M9 | |||
|---|---|---|---|
| Quadrant | BADHDUFLAG | Total packets | Discarded packets |
| A | 0 | 8 | 0 |
| B | 0 | 8 | 0 |
| C | 0 | 8 | 0 |
| D | 0 | 8 | 0 |
| Mode SS | |||
|---|---|---|---|
| Quadrant | BADHDUFLAG | Total packets | Discarded packets |
| A | 0 | 138 | 0 |
| B | 0 | 138 | 0 |
| C | 0 | 138 | 0 |
| D | 0 | 138 | 0 |
| Mode M0 | |||
|---|---|---|---|
| Quadrant | BADHDUFLAG | Total packets | Discarded packets |
| A | 0 | 15323 | 0 |
| B | 0 | 23394 | 0 |
| C | 0 | 14077 | 0 |
| D | 0 | 16753 | 0 |
| Quadrant | Total seconds | Saturated seconds | Saturation percentage |
|---|---|---|---|
| A | 6808 | 34 | 0.499412% |
| B | 6808 | 2421 | 35.561105% |
| C | 6808 | 11 | 0.161575% |
| D | 6808 | 71 | 1.042891% |
Noise dominated data is calculated using 1-second bins in cleaned event files. If a bin has >2000 counts, and if more than 50% of those come from <1% of pixels, then it is considered to be noise-dominated and hence unusable.
| Quadrant | # 1 sec bins | Bins with >0 counts | Bins with >2000 counts | High rate bins dominated by noise | Noise dominated (total time) | Noise dominated (detector-on time) | Marked lightcurve |
|---|---|---|---|---|---|---|---|
| A | 7578 | 6809 | 0 | 0 | 0.00% | 0.00% | 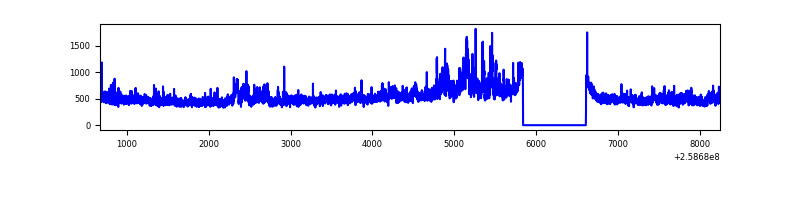 |
| B | 7578 | 6808 | 981 | 981 | 12.95% | 14.41% | 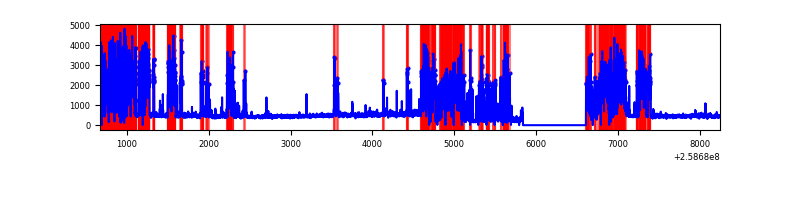 |
| C | 7578 | 6809 | 3 | 3 | 0.04% | 0.04% | 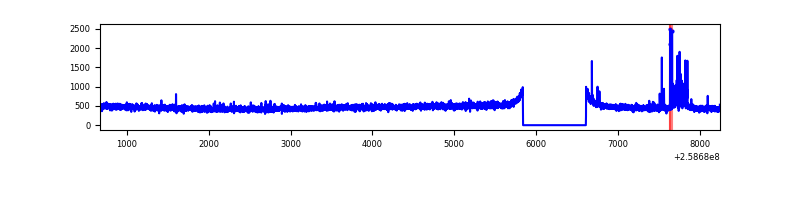 |
| D | 7578 | 6809 | 59 | 59 | 0.78% | 0.87% | 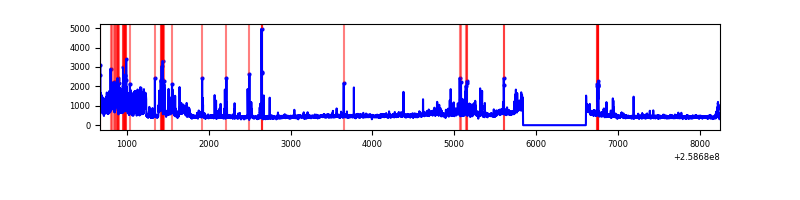 |
Top three noisy pixels from each quadrant. If the there are fewer than three noisy pixels in the level2.evt file, extra rows are filled as -1
| Pixel properties | Quadrant properties | ||||||
|---|---|---|---|---|---|---|---|
| Quadrant | DetID | PixID | Counts | Sigma | Mean | Median | Sigma |
| A | 8 | 15 | 457471 | 2697.51 | 821 | 805 | 169.3 |
| A | 9 | 143 | 23901 | 136.43 | 821 | 805 | 169.3 |
| A | 1 | 162 | 17827 | 100.55 | 821 | 805 | 169.3 |
| B | 4 | 239 | 4067595 | 38131.6 | 560 | 548 | 106.7 |
| B | 10 | 246 | 27819 | 255.69 | 560 | 548 | 106.7 |
| B | 0 | 214 | 22297 | 203.91 | 560 | 548 | 106.7 |
| C | 15 | 208 | 89294 | 471.81 | 805 | 813 | 187.5 |
| C | 13 | 61 | 5923 | 27.25 | 805 | 813 | 187.5 |
| C | 8 | 222 | 3110 | 12.25 | 805 | 813 | 187.5 |
| D | 5 | 222 | 544727 | 2826.79 | 790 | 767 | 192.4 |
| D | 13 | 249 | 169399 | 876.33 | 790 | 767 | 192.4 |
| D | 8 | 195 | 121848 | 629.22 | 790 | 767 | 192.4 |
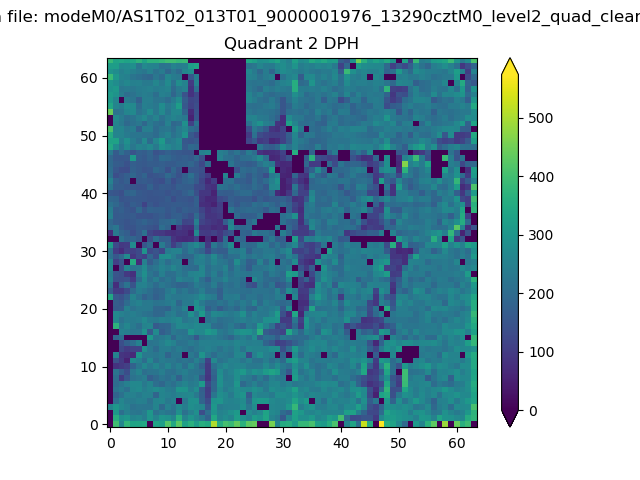
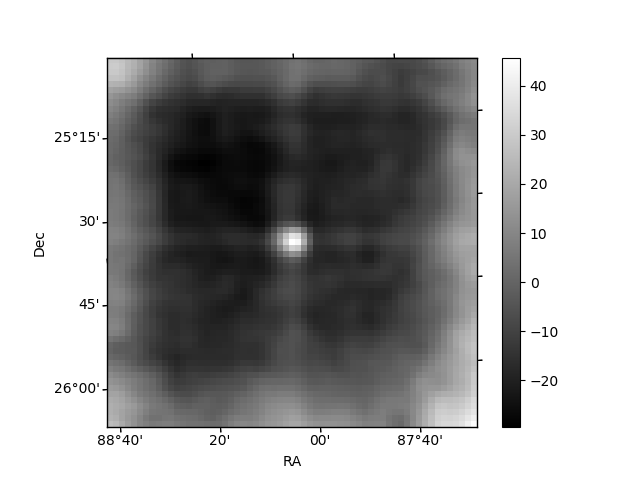
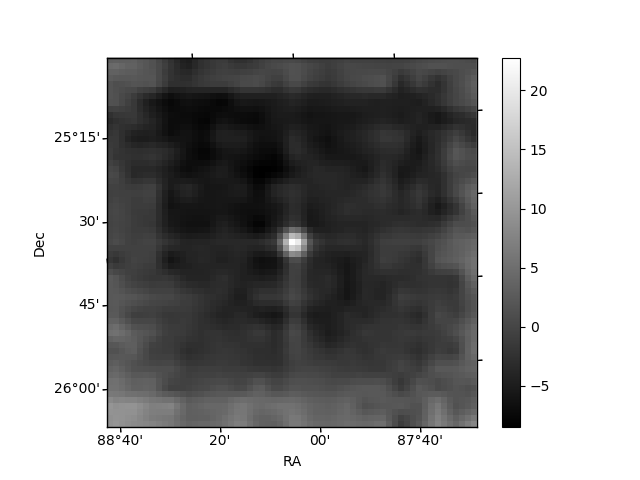
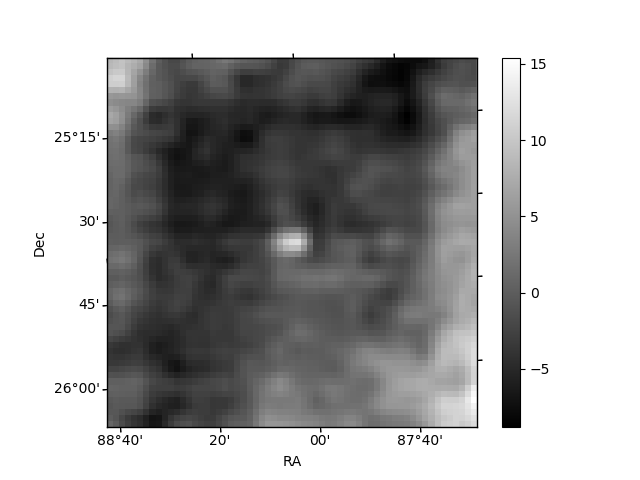
Histogram calculated using DETX and DETY for each event in the final _common_clean file
| Quadrant A | 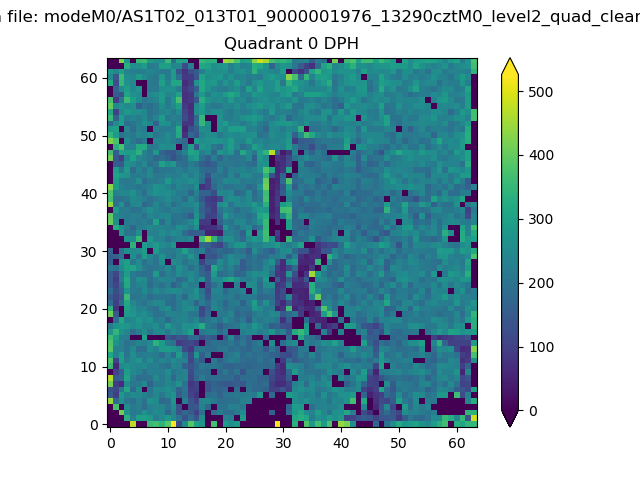 |
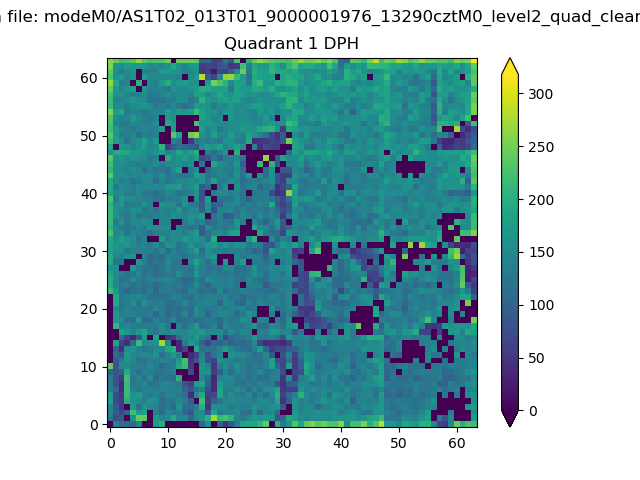 |
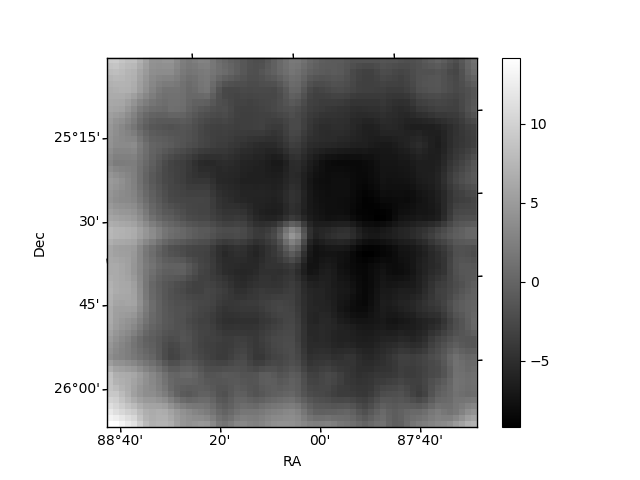
Quadrant B |
|---|---|---|---|
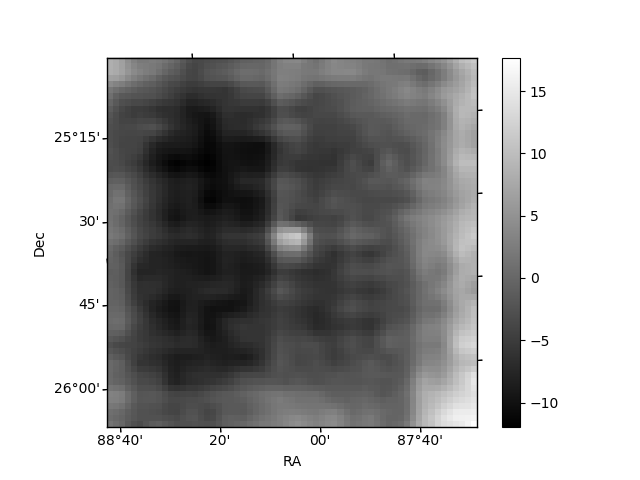
| Quadrant D | 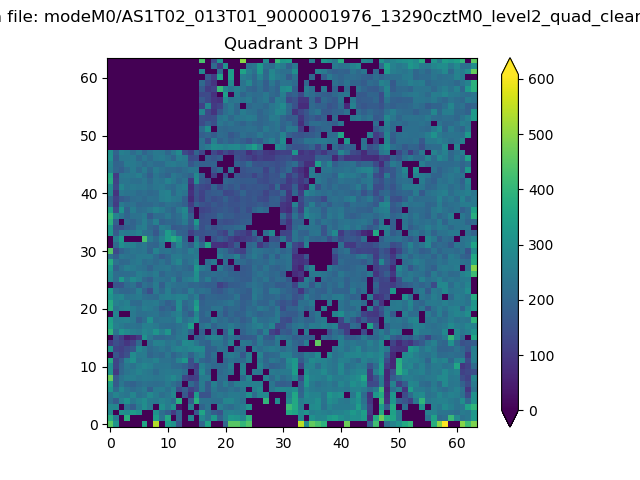 |
 |
Quadrant C |
| Plot type | Count rate plots | Images |
|---|---|---|
| Comparison with Poisson distribution Blue bars denote a histogram of data divided into 1 sec bins. Red curve is a Poisson curve with rate = median count rate of data. |
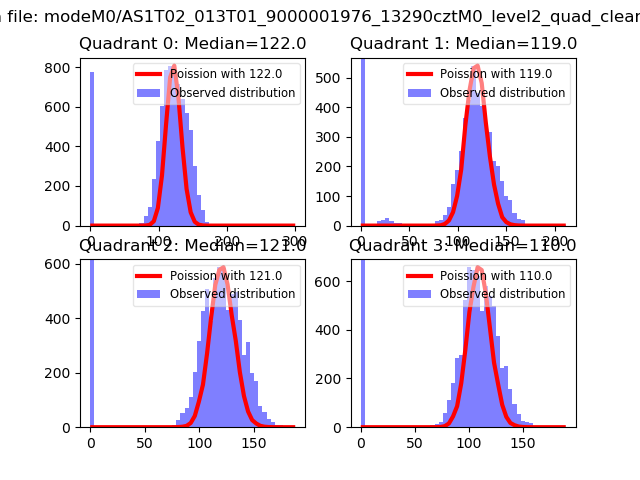 |
 |
| Quadrant-wise count rates Data is divided into 100 sec bins |
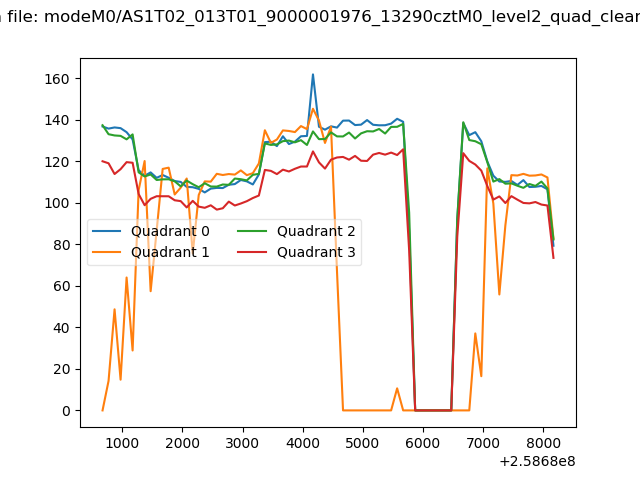 |
|
| Module-wise count rates for Quadrant A Data is divided into 100 sec bins |
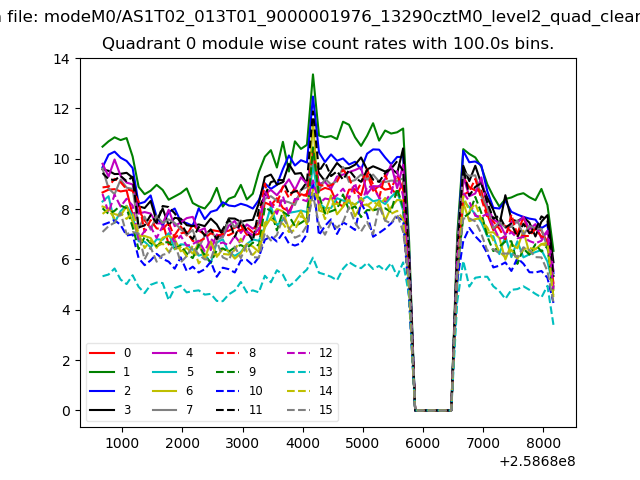 |
 |
| Module-wise count rates for Quadrant B Data is divided into 100 sec bins |
 |
 |
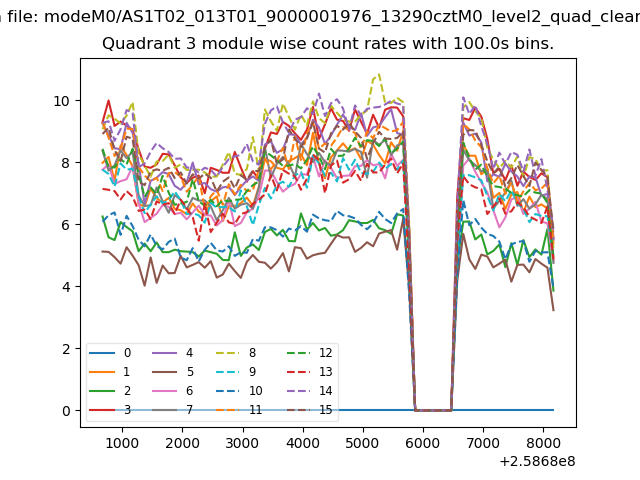
| Module-wise count rates for Quadrant C Data is divided into 100 sec bins |
 |
 |
| Module-wise count rates for Quadrant D Data is divided into 100 sec bins |
 |
 |
| Parameter | Plot |
|---|---|
| CZT HV Monitor |  |
| D_VDD | 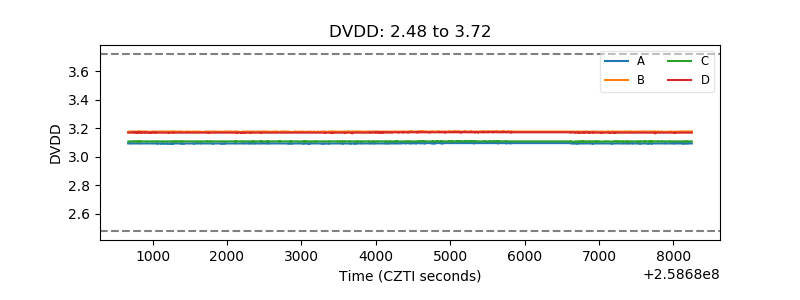 |
| Temperature 1 | 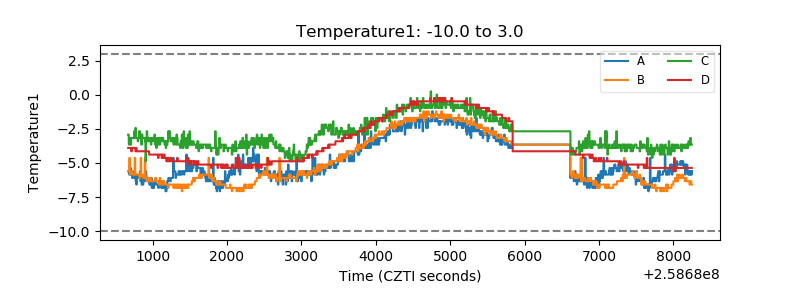 |
| Veto HV Monitor | 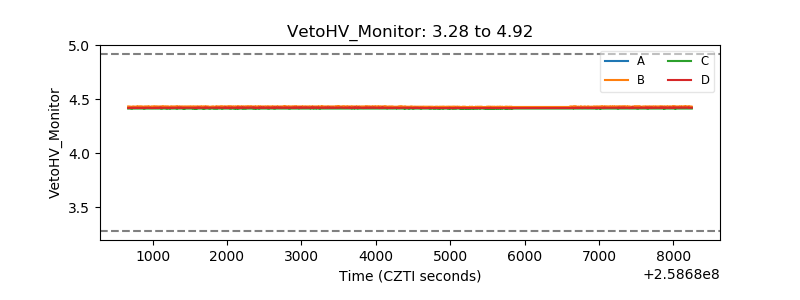 |
| Veto LLD | 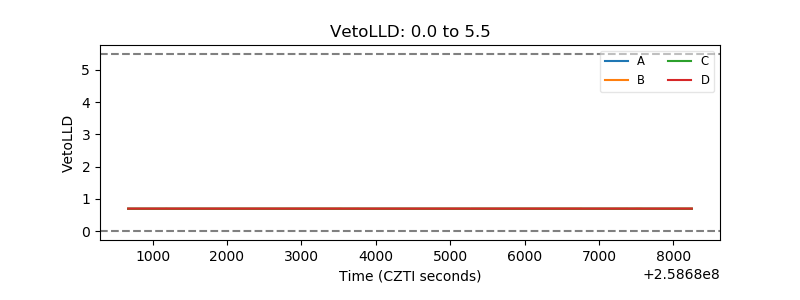 |
| Alpha Counter | 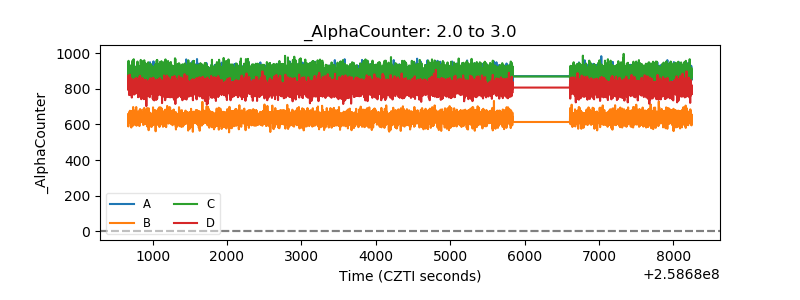 |
| _CPM_Rate | 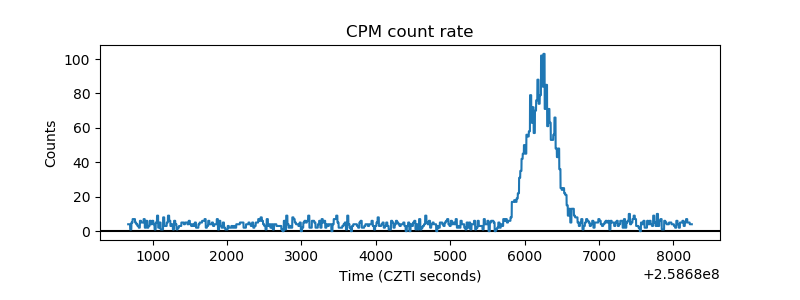 |
| CZT Counter | 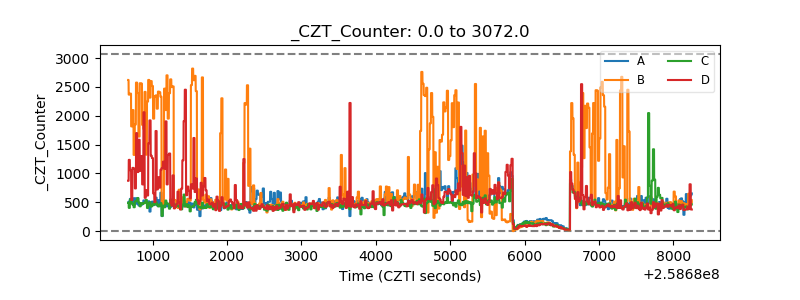 |
| +2.5 Volts monitor |  |
| +5 Volts monitor |  |
| _ROLL_ROT | 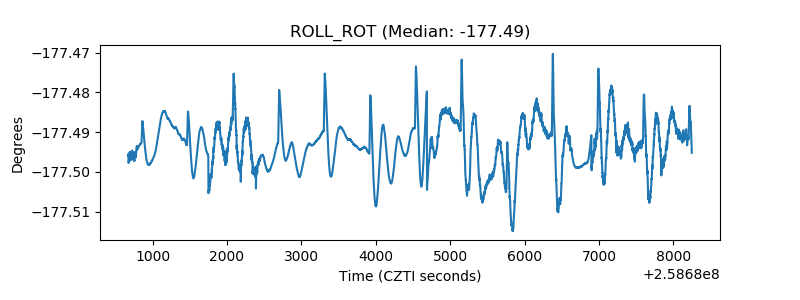 |
| _Roll_DEC | 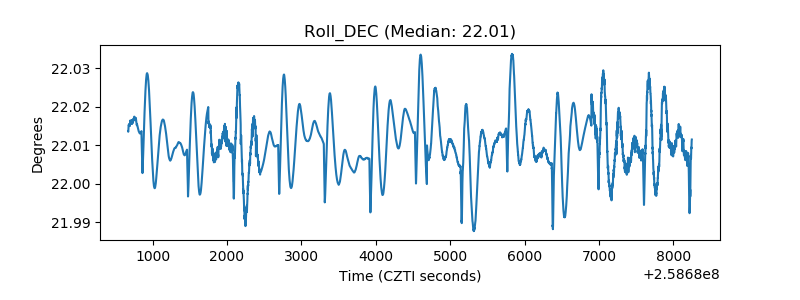 |
| _Roll_RA | 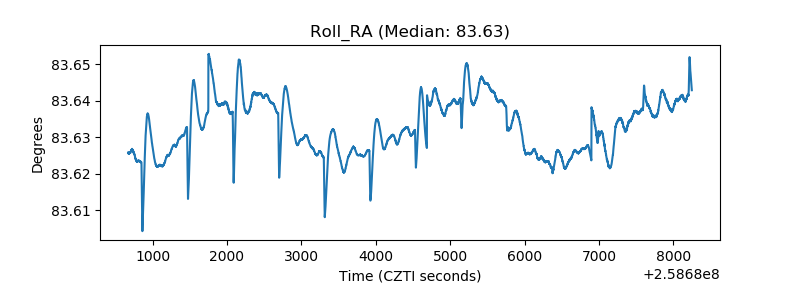 |
| Veto Counter |  |