| Param | Original file | Final file |
|---|---|---|
| Filename | modeM0/AS1T02_013T01_9000001976_13291cztM0_level2.evt | modeM0/AS1T02_013T01_9000001976_13291cztM0_level2_quad_clean.evt |
| Size (bytes) | 614,039,040 | 75,078,720 |
| Size | 585.6 MB | 71.6 MB |
| Events in quadrant A | 3,726,456 | 528,596 |
| Events in quadrant B | 6,005,934 | 207,846 |
| Events in quadrant C | 3,693,138 | 530,534 |
| Events in quadrant D | 4,661,649 | 484,012 |
| Mode M9 | |||
|---|---|---|---|
| Quadrant | BADHDUFLAG | Total packets | Discarded packets |
| A | 0 | 2 | 0 |
| B | 0 | 2 | 0 |
| C | 0 | 2 | 0 |
| D | 0 | 2 | 0 |
| Mode SS | |||
|---|---|---|---|
| Quadrant | BADHDUFLAG | Total packets | Discarded packets |
| A | 0 | 152 | 0 |
| B | 0 | 152 | 0 |
| C | 0 | 152 | 0 |
| D | 0 | 152 | 0 |
| Mode M0 | |||
|---|---|---|---|
| Quadrant | BADHDUFLAG | Total packets | Discarded packets |
| A | 0 | 15723 | 2 |
| B | 0 | 22753 | 1 |
| C | 0 | 15947 | 1 |
| D | 0 | 18995 | 1 |
| Quadrant | Total seconds | Saturated seconds | Saturation percentage |
|---|---|---|---|
| A | 7486 | 120 | 1.602992% |
| B | 7486 | 2501 | 33.409030% |
| C | 7486 | 96 | 1.282394% |
| D | 7486 | 395 | 5.276516% |
Noise dominated data is calculated using 1-second bins in cleaned event files. If a bin has >2000 counts, and if more than 50% of those come from <1% of pixels, then it is considered to be noise-dominated and hence unusable.
| Quadrant | # 1 sec bins | Bins with >0 counts | Bins with >2000 counts | High rate bins dominated by noise | Noise dominated (total time) | Noise dominated (detector-on time) | Marked lightcurve |
|---|---|---|---|---|---|---|---|
| A | 7752 | 7488 | 2 | 2 | 0.03% | 0.03% | 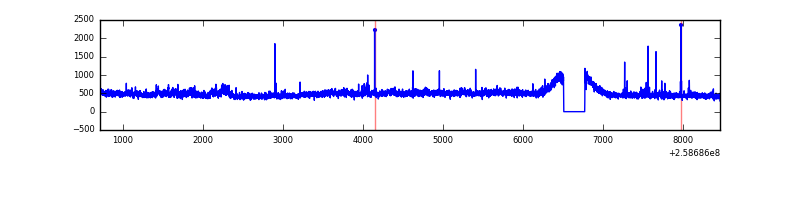 |
| B | 7752 | 7487 | 667 | 667 | 8.60% | 8.91% | 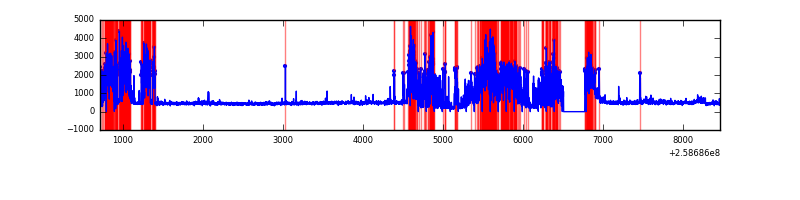 |
| C | 7752 | 7488 | 21 | 21 | 0.27% | 0.28% | 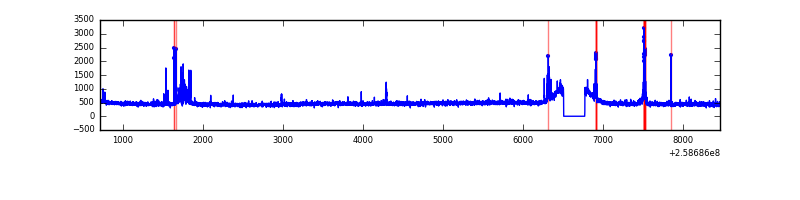 |
| D | 7752 | 7488 | 262 | 262 | 3.38% | 3.50% | 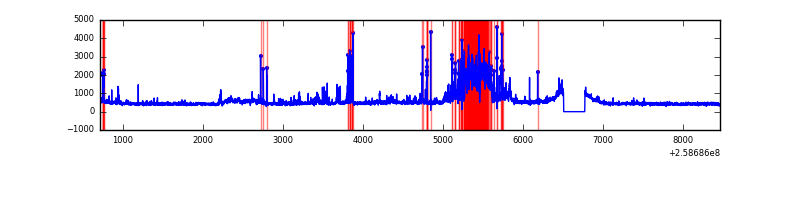 |
Top three noisy pixels from each quadrant. If the there are fewer than three noisy pixels in the level2.evt file, extra rows are filled as -1
| Pixel properties | Quadrant properties | ||||||
|---|---|---|---|---|---|---|---|
| Quadrant | DetID | PixID | Counts | Sigma | Mean | Median | Sigma |
| A | 8 | 15 | 159757 | 844.15 | 915 | 894 | 188.2 |
| A | 9 | 143 | 24295 | 124.35 | 915 | 894 | 188.2 |
| A | 15 | 69 | 10606 | 51.61 | 915 | 894 | 188.2 |
| B | 4 | 239 | 3445197 | 28907.48 | 618 | 603 | 119.2 |
| B | 10 | 245 | 44406 | 367.6 | 618 | 603 | 119.2 |
| B | 4 | 142 | 18181 | 147.52 | 618 | 603 | 119.2 |
| C | 15 | 208 | 143744 | 682.9 | 897 | 903 | 209.2 |
| C | 14 | 234 | 54403 | 255.77 | 897 | 903 | 209.2 |
| C | 13 | 61 | 6590 | 27.19 | 897 | 903 | 209.2 |
| D | 1 | 52 | 656650 | 3100.35 | 870 | 846 | 211.5 |
| D | 8 | 195 | 242792 | 1143.81 | 870 | 846 | 211.5 |
| D | 13 | 249 | 239056 | 1126.15 | 870 | 846 | 211.5 |
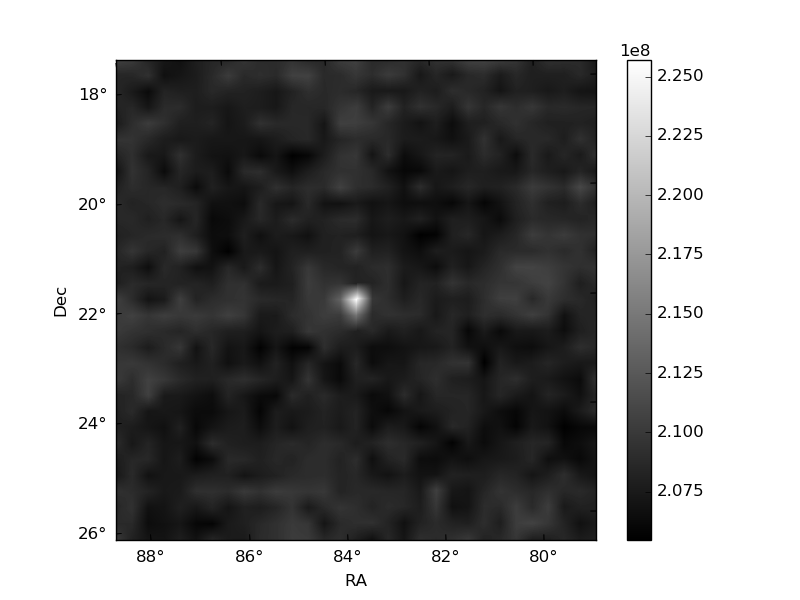
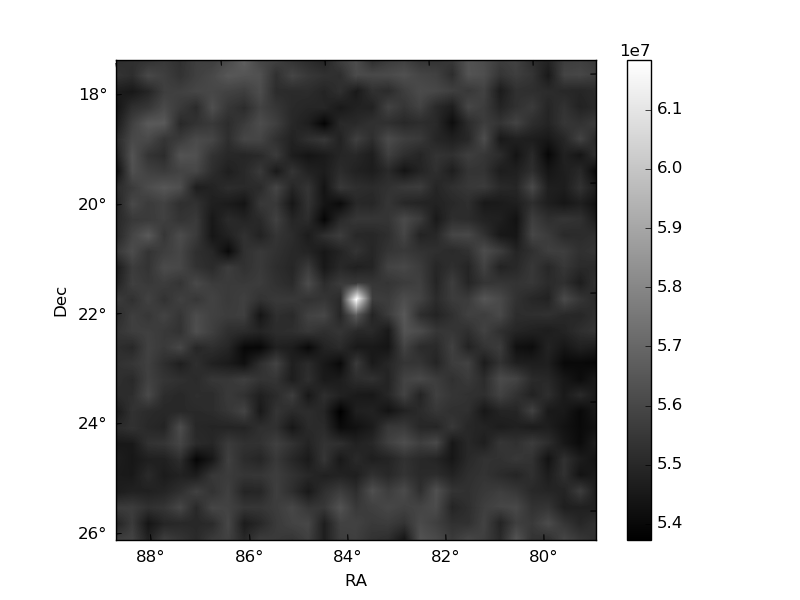
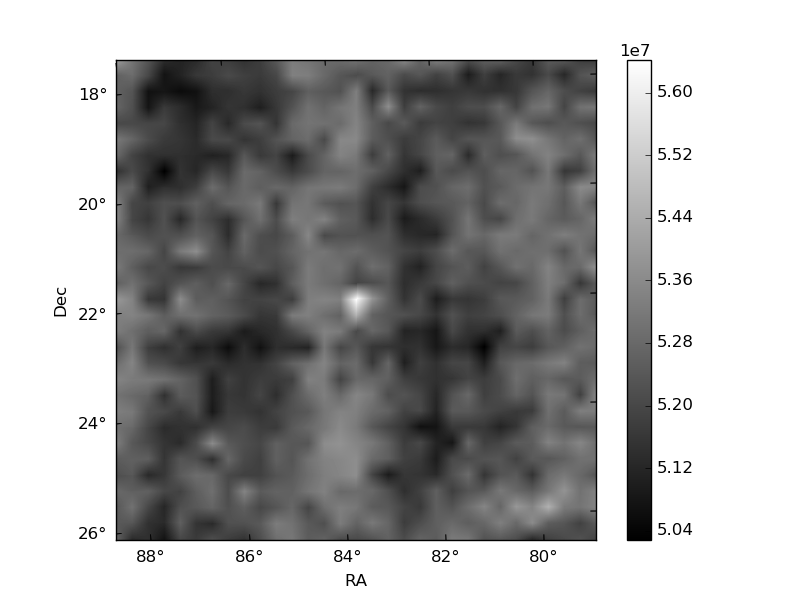
Histogram calculated using DETX and DETY for each event in the final _common_clean file
| Quadrant A | 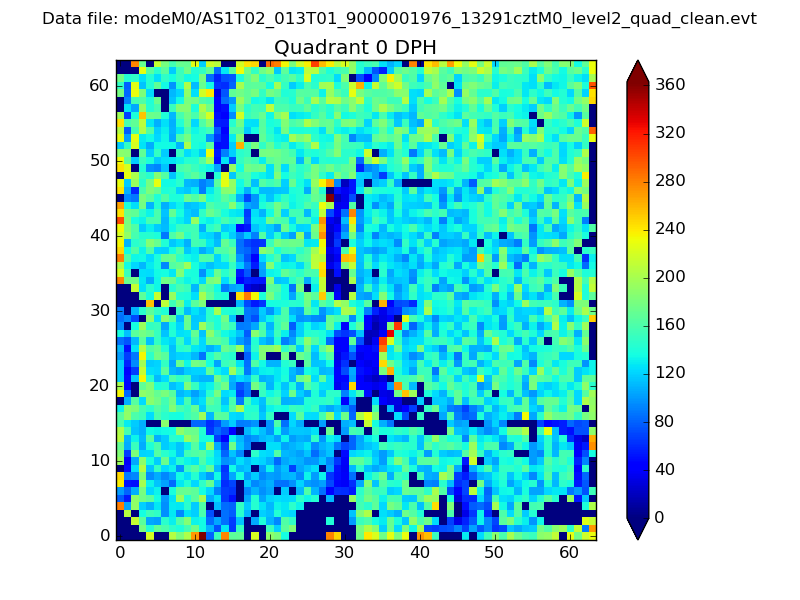 |
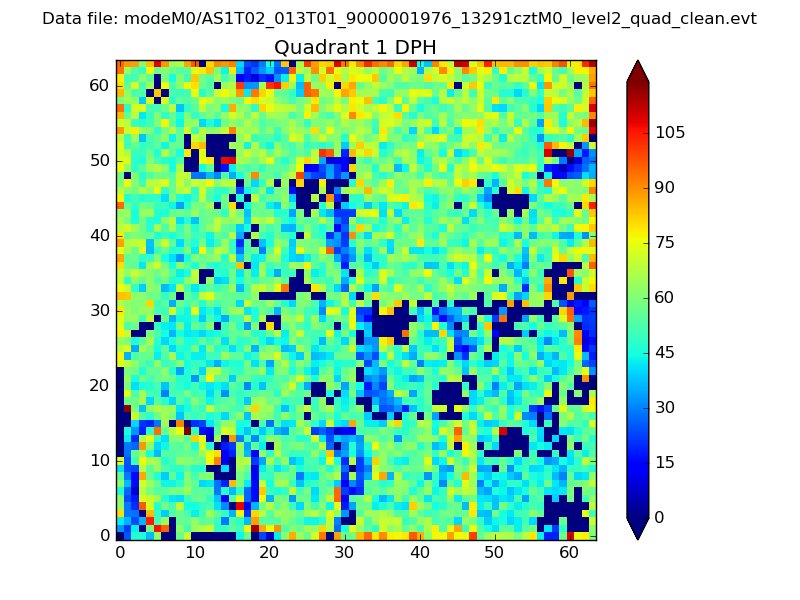 |
Quadrant B |
|---|---|---|---|
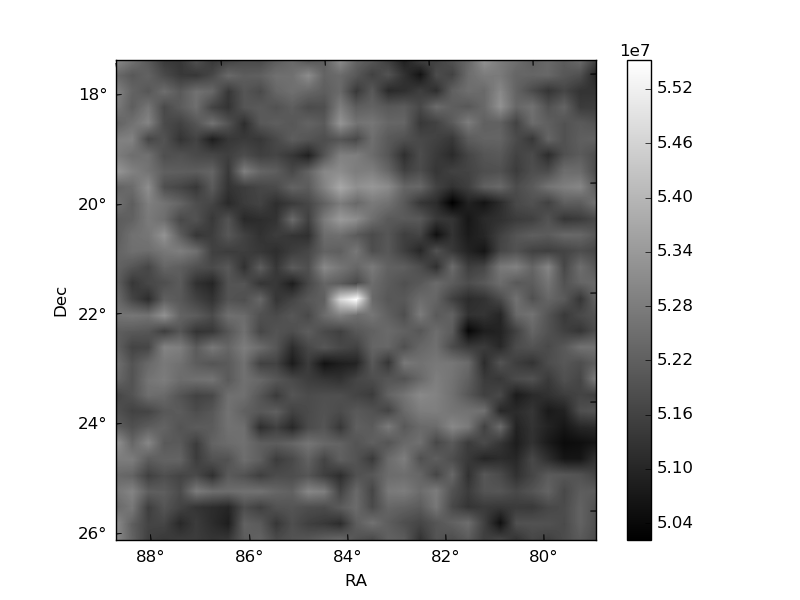
| Quadrant D | 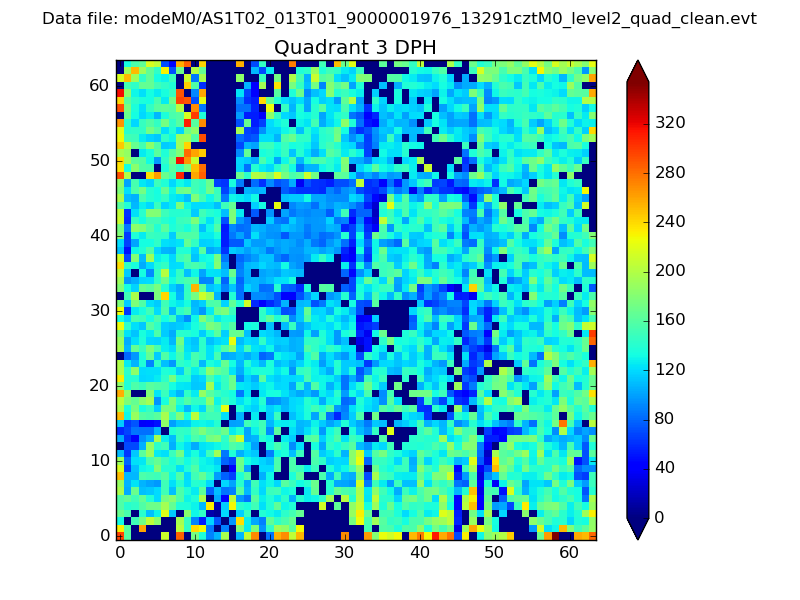 |
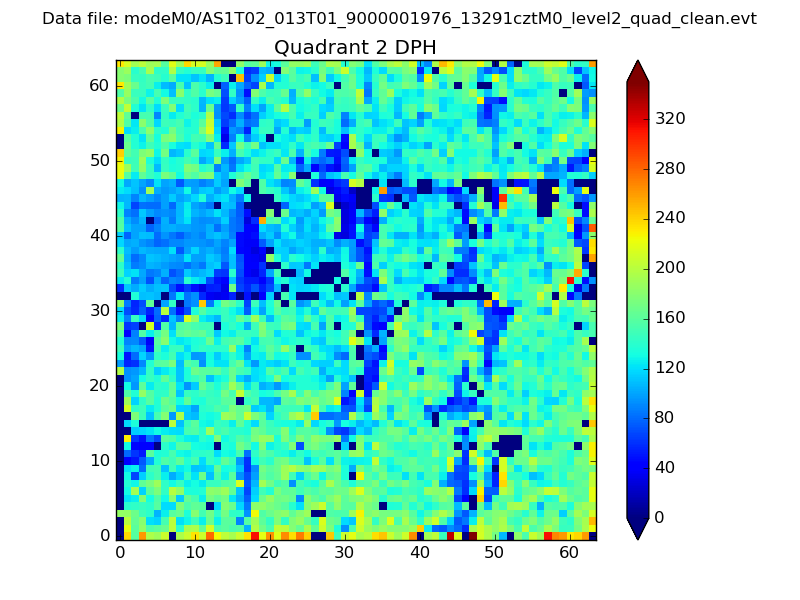 |
Quadrant C |
| Plot type | Count rate plots | Images |
|---|---|---|
| Comparison with Poisson distribution Blue bars denote a histogram of data divided into 1 sec bins. Red curve is a Poisson curve with rate = median count rate of data. |
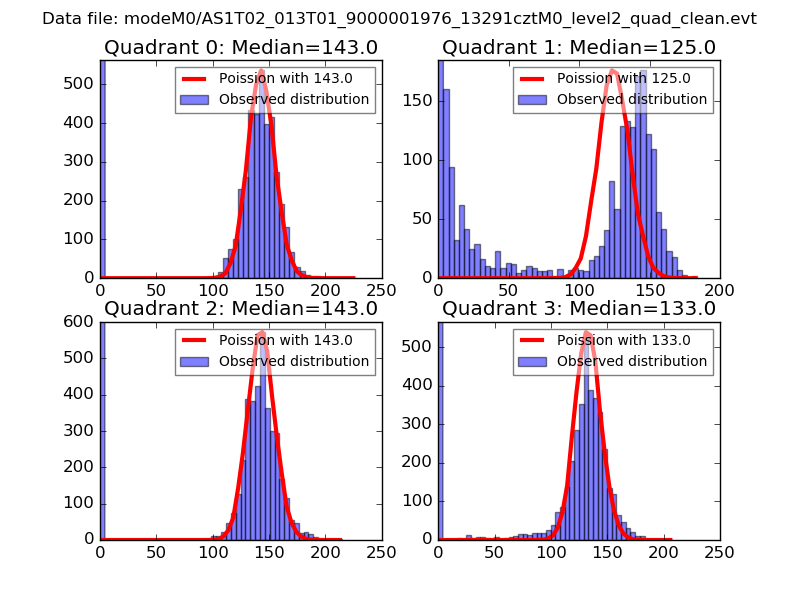 |
 |
| Quadrant-wise count rates Data is divided into 100 sec bins |
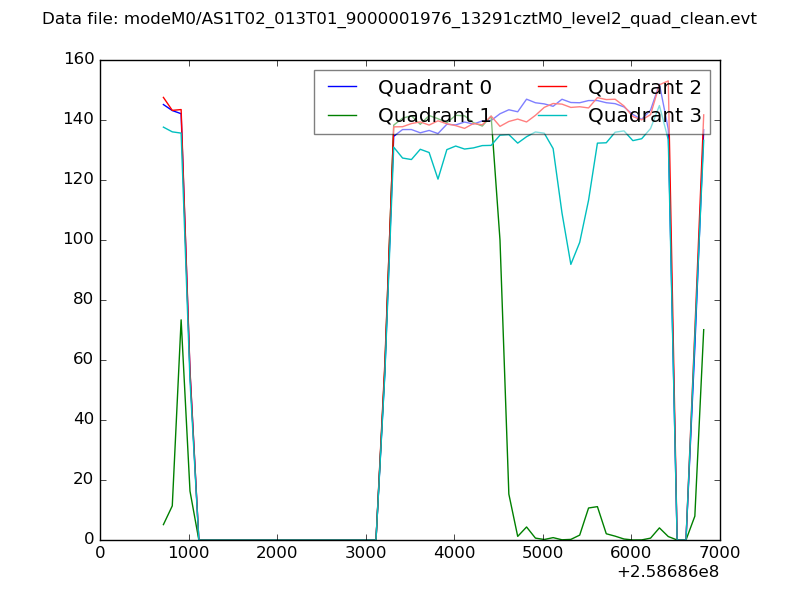 |
|
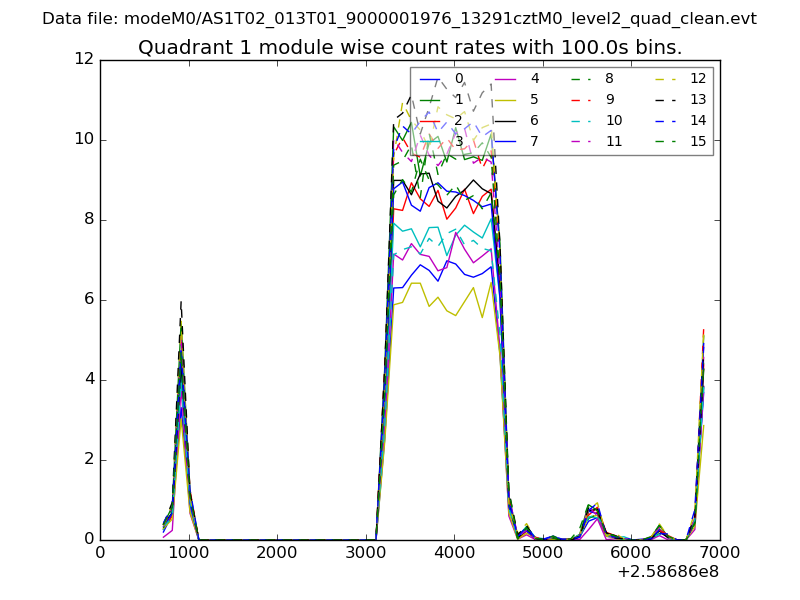
| Module-wise count rates for Quadrant A Data is divided into 100 sec bins |
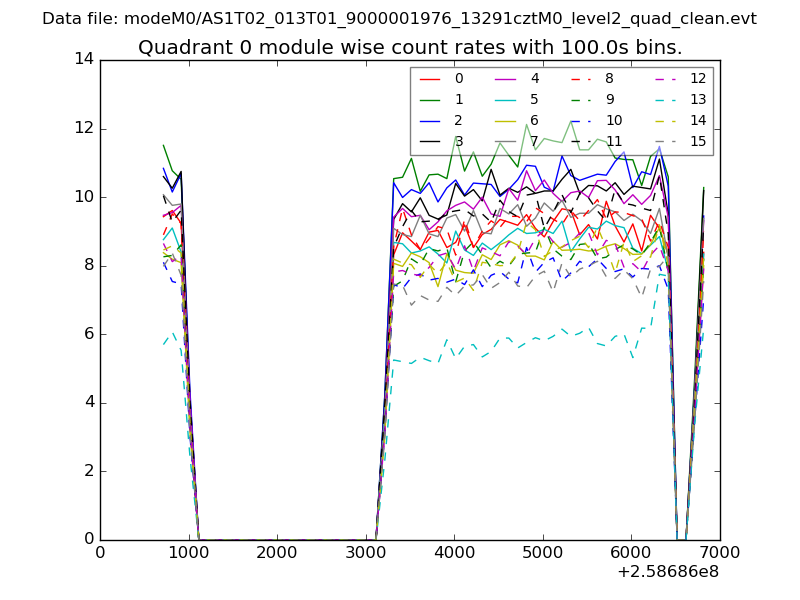 |
 |
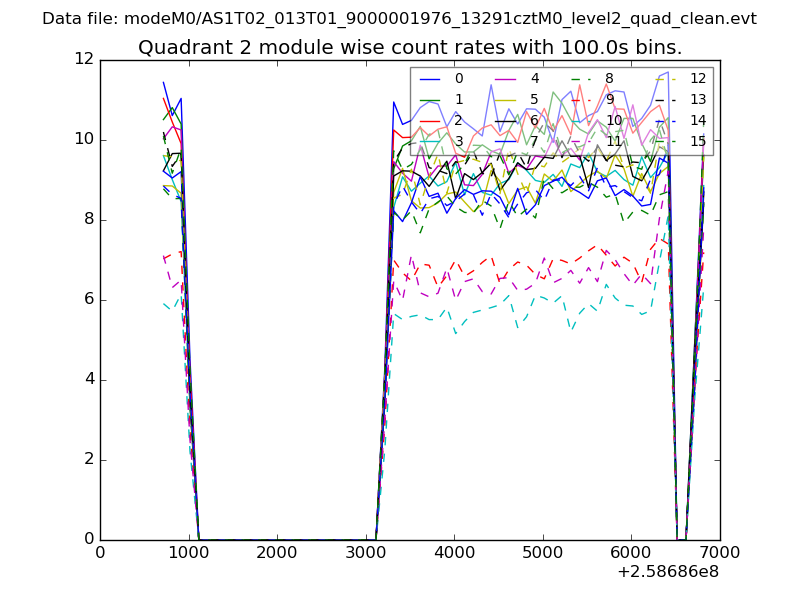
| Module-wise count rates for Quadrant B Data is divided into 100 sec bins |
 |
 |
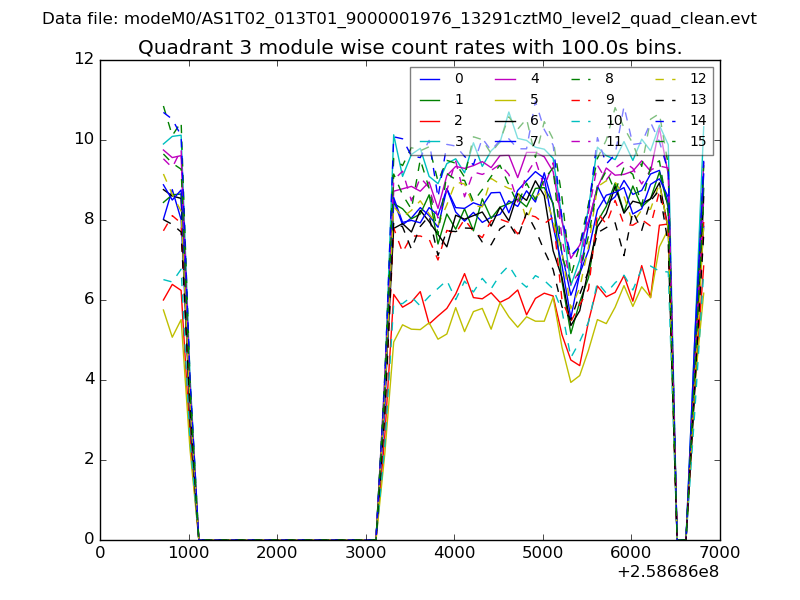
| Module-wise count rates for Quadrant C Data is divided into 100 sec bins |
 |
 |
| Module-wise count rates for Quadrant D Data is divided into 100 sec bins |
 |
 |
| Parameter | Plot |
|---|---|
| CZT HV Monitor | 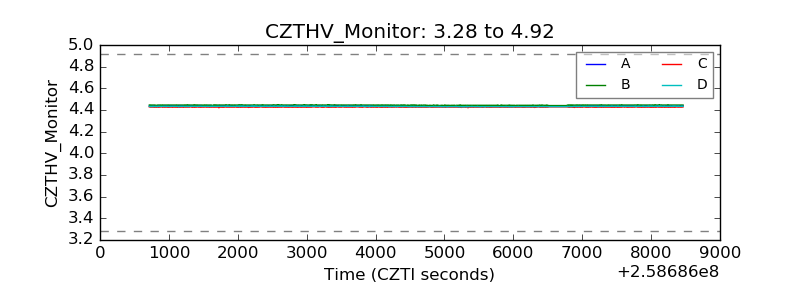 |
| D_VDD |  |
| Temperature 1 | 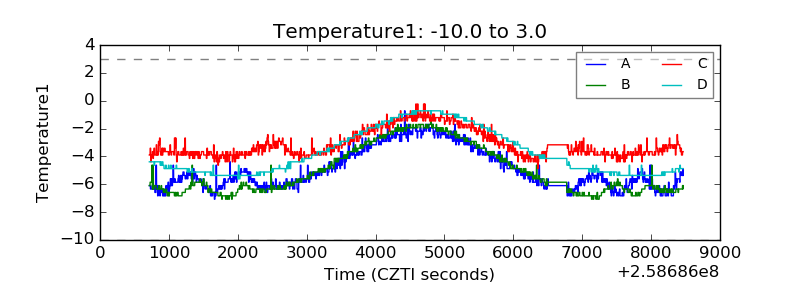 |
| Veto HV Monitor | 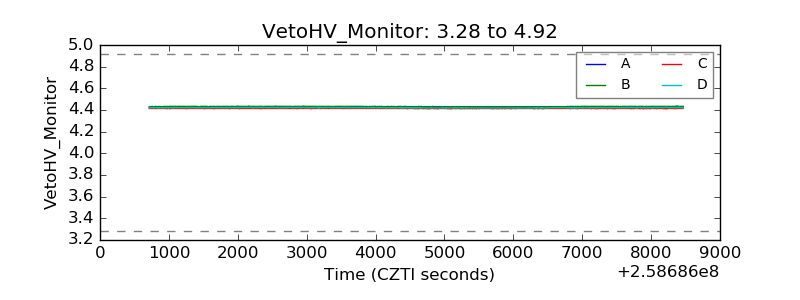 |
| Veto LLD | 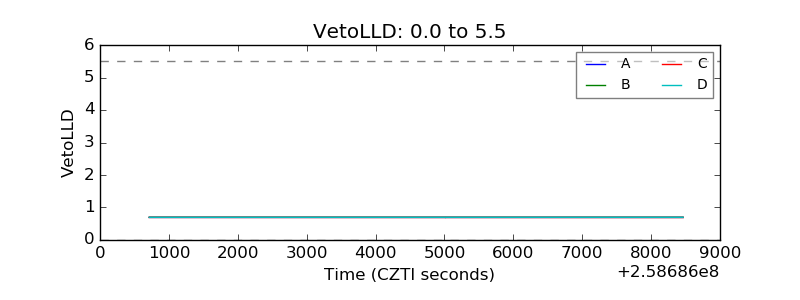 |
| Alpha Counter | 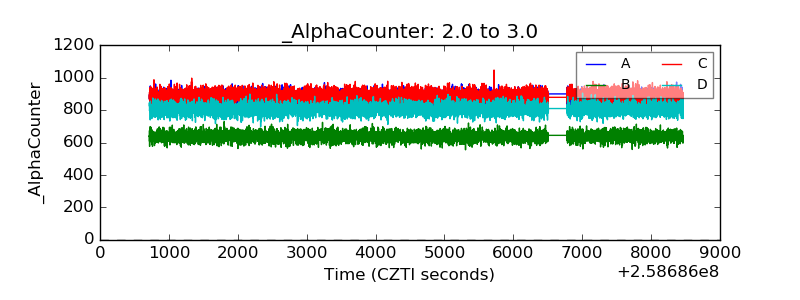 |
| _CPM_Rate | 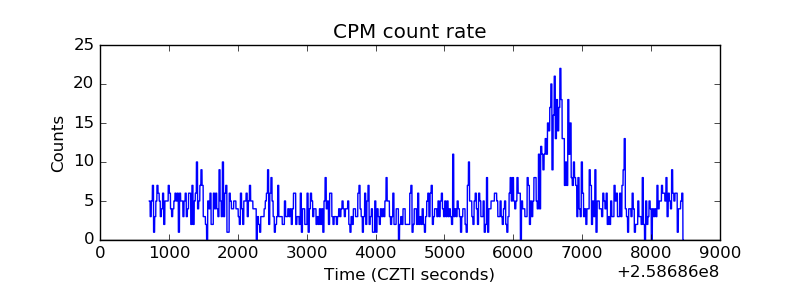 |
| CZT Counter | 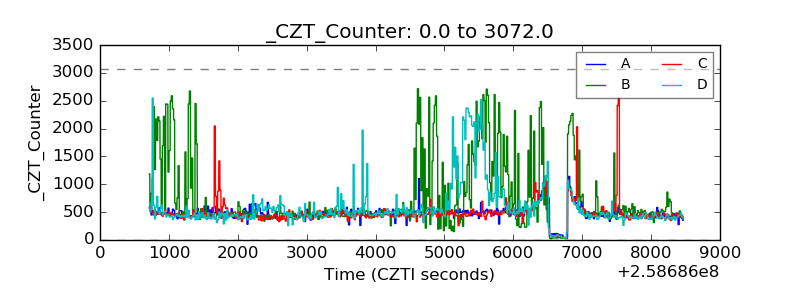 |
| +2.5 Volts monitor |  |
| +5 Volts monitor |  |
| _ROLL_ROT | 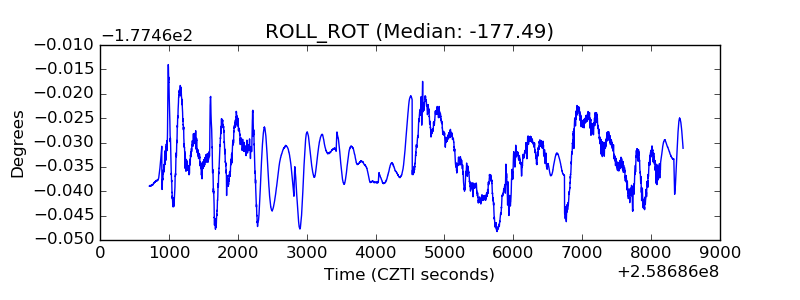 |
| _Roll_DEC | 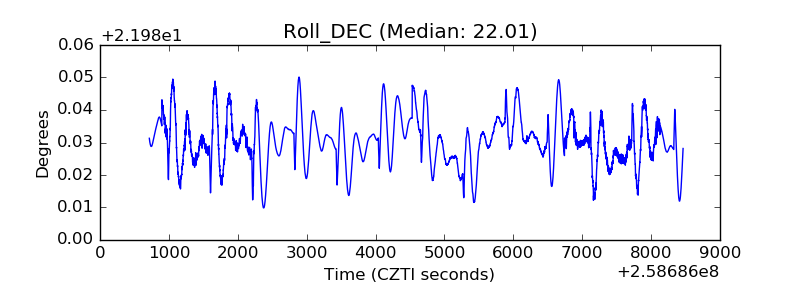 |
| _Roll_RA | 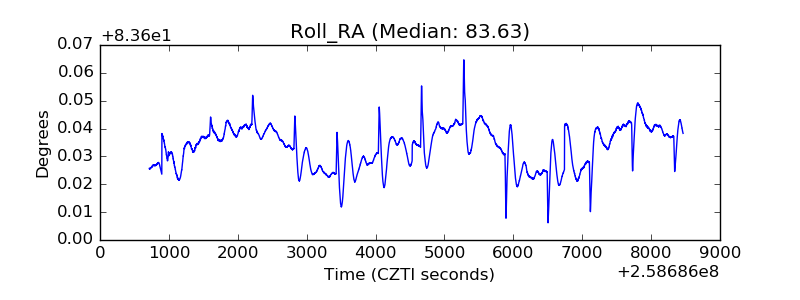 |
| Veto Counter | 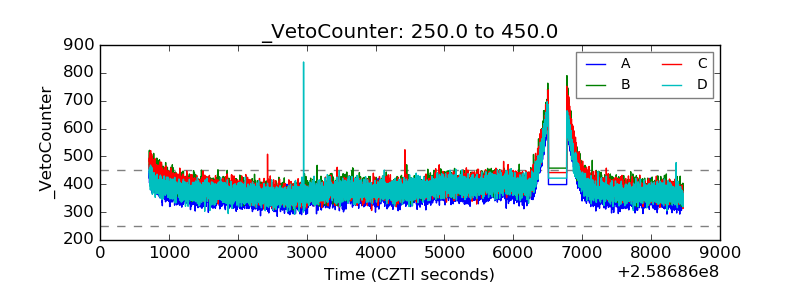 |