| Param | Original file | Final file |
|---|---|---|
| Filename | modeM0/AS1T02_013T01_9000001976_13292cztM0_level2.evt | modeM0/AS1T02_013T01_9000001976_13292cztM0_level2_quad_clean.evt |
| Size (bytes) | 693,921,600 | 80,496,000 |
| Size | 661.8 MB | 76.8 MB |
| Events in quadrant A | 4,170,939 | 568,085 |
| Events in quadrant B | 7,761,503 | 195,832 |
| Events in quadrant C | 4,119,383 | 571,457 |
| Events in quadrant D | 4,414,739 | 539,639 |
| Mode M9 | |||
|---|---|---|---|
| Quadrant | BADHDUFLAG | Total packets | Discarded packets |
| A | 0 | 2 | 0 |
| B | 0 | 2 | 0 |
| C | 0 | 2 | 0 |
| D | 0 | 2 | 0 |
| Mode SS | |||
|---|---|---|---|
| Quadrant | BADHDUFLAG | Total packets | Discarded packets |
| A | 0 | 164 | 0 |
| B | 0 | 164 | 0 |
| C | 0 | 164 | 0 |
| D | 0 | 164 | 0 |
| Mode M0 | |||
|---|---|---|---|
| Quadrant | BADHDUFLAG | Total packets | Discarded packets |
| A | 0 | 17612 | 3 |
| B | 0 | 28398 | 2 |
| C | 0 | 17667 | 2 |
| D | 0 | 18566 | 2 |
| Quadrant | Total seconds | Saturated seconds | Saturation percentage |
|---|---|---|---|
| A | 8070 | 368 | 4.560099% |
| B | 8070 | 3351 | 41.524164% |
| C | 8070 | 286 | 3.543990% |
| D | 8070 | 295 | 3.655514% |
Noise dominated data is calculated using 1-second bins in cleaned event files. If a bin has >2000 counts, and if more than 50% of those come from <1% of pixels, then it is considered to be noise-dominated and hence unusable.
| Quadrant | # 1 sec bins | Bins with >0 counts | Bins with >2000 counts | High rate bins dominated by noise | Noise dominated (total time) | Noise dominated (detector-on time) | Marked lightcurve |
|---|---|---|---|---|---|---|---|
| A | 8361 | 8073 | 1 | 1 | 0.01% | 0.01% | 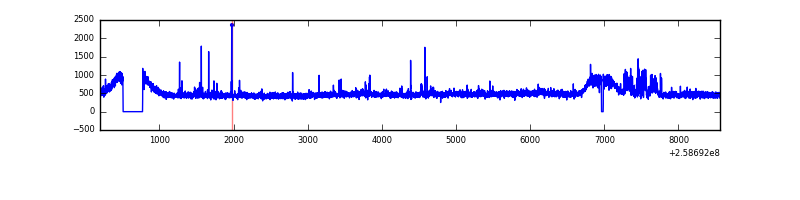 |
| B | 8361 | 8072 | 1060 | 1060 | 12.68% | 13.13% | 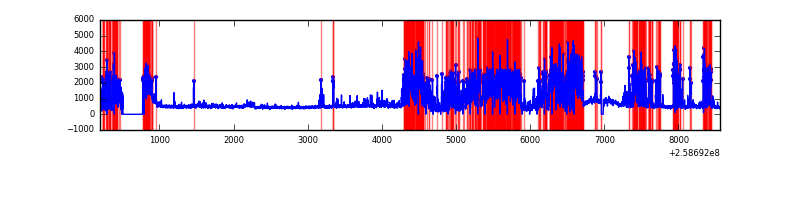 |
| C | 8361 | 8073 | 31 | 31 | 0.37% | 0.38% | 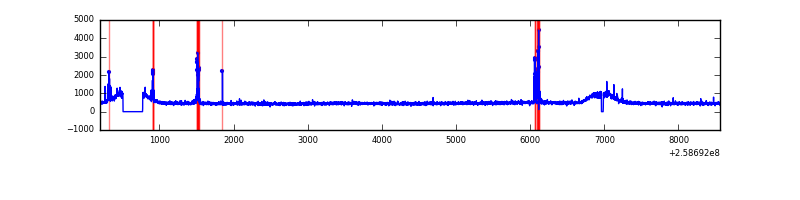 |
| D | 8361 | 8073 | 46 | 46 | 0.55% | 0.57% | 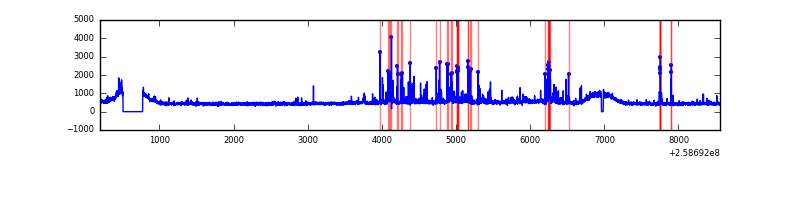 |
Top three noisy pixels from each quadrant. If the there are fewer than three noisy pixels in the level2.evt file, extra rows are filled as -1
| Pixel properties | Quadrant properties | ||||||
|---|---|---|---|---|---|---|---|
| Quadrant | DetID | PixID | Counts | Sigma | Mean | Median | Sigma |
| A | 15 | 69 | 116661 | 545.18 | 1026 | 1002 | 212.1 |
| A | 9 | 143 | 36891 | 169.17 | 1026 | 1002 | 212.1 |
| A | 8 | 15 | 28038 | 127.44 | 1026 | 1002 | 212.1 |
| B | 4 | 239 | 4989164 | 37515.99 | 677 | 658 | 133.0 |
| B | 10 | 245 | 40205 | 297.41 | 677 | 658 | 133.0 |
| B | 4 | 80 | 28293 | 207.83 | 677 | 658 | 133.0 |
| C | 15 | 208 | 133837 | 560.39 | 1007 | 1013 | 237.0 |
| C | 14 | 234 | 54046 | 223.75 | 1007 | 1013 | 237.0 |
| C | 13 | 61 | 7466 | 27.23 | 1007 | 1013 | 237.0 |
| D | 8 | 195 | 229896 | 939.36 | 996 | 966 | 243.7 |
| D | 1 | 52 | 204601 | 835.57 | 996 | 966 | 243.7 |
| D | 13 | 249 | 101013 | 410.52 | 996 | 966 | 243.7 |
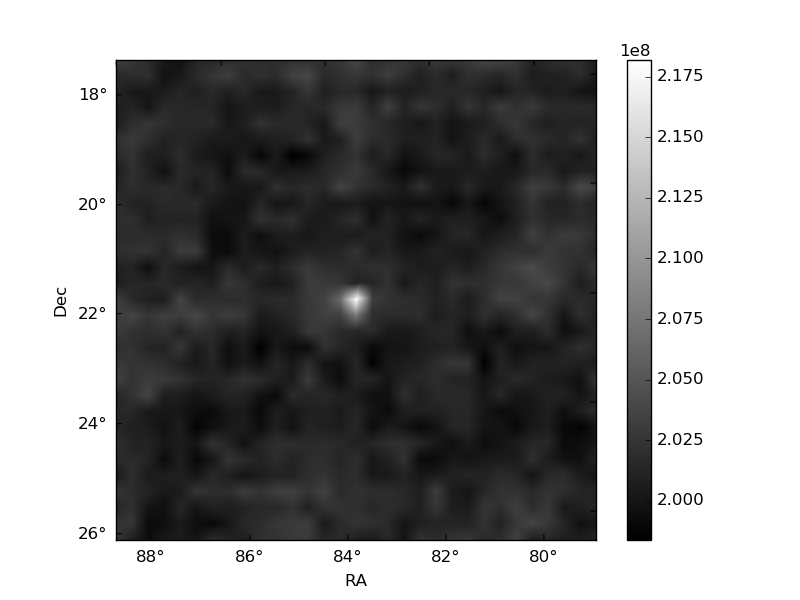
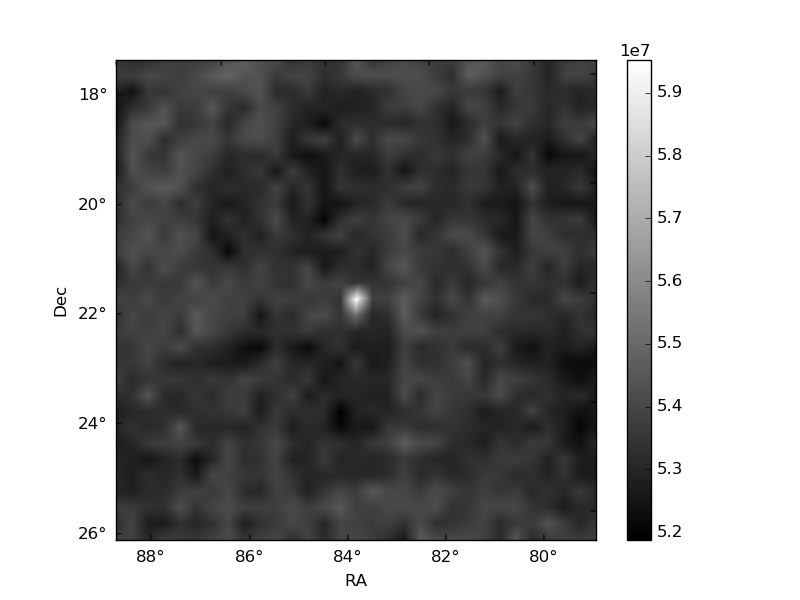
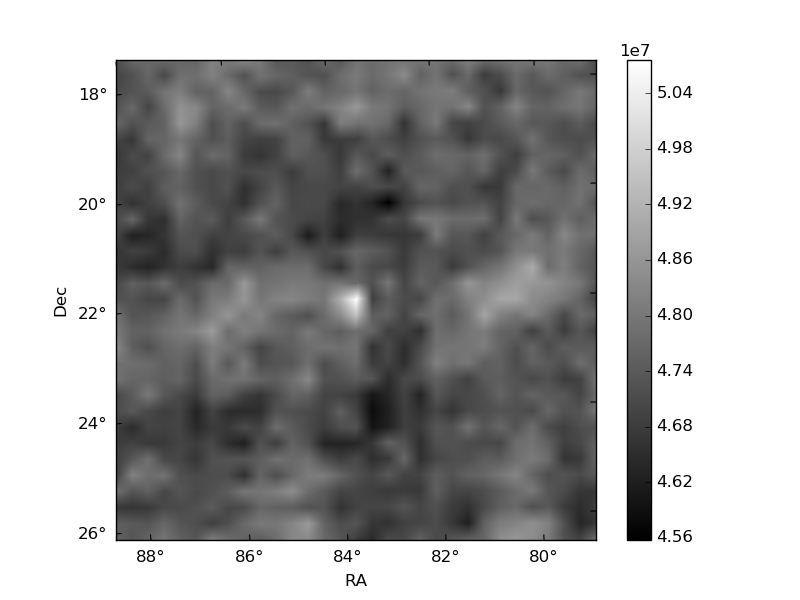
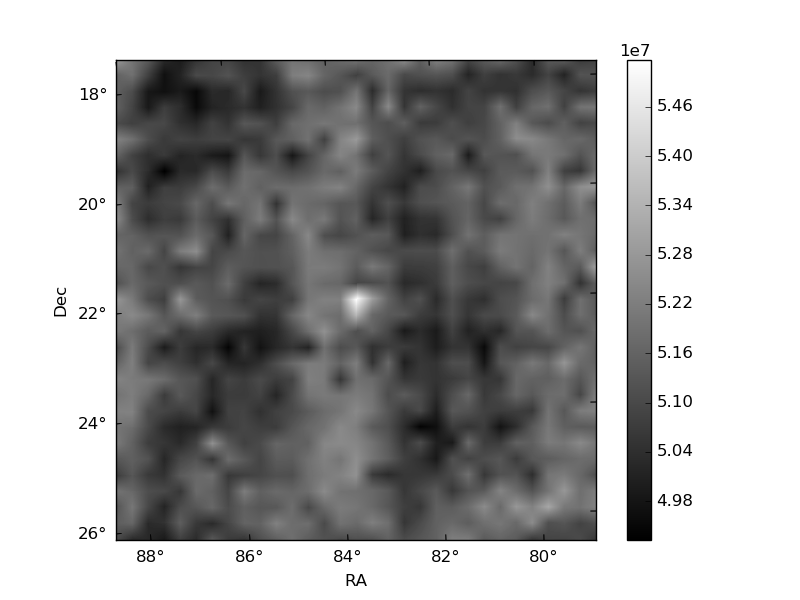
Histogram calculated using DETX and DETY for each event in the final _common_clean file
| Quadrant A | 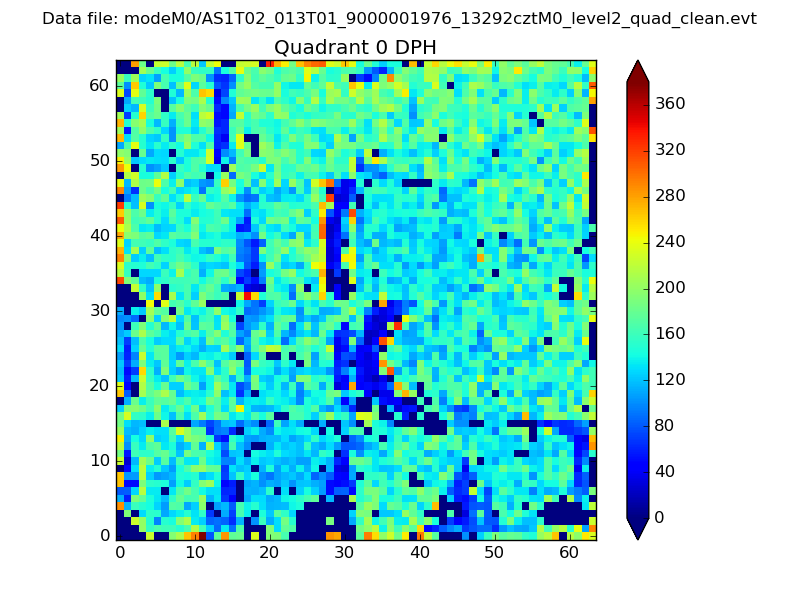 |
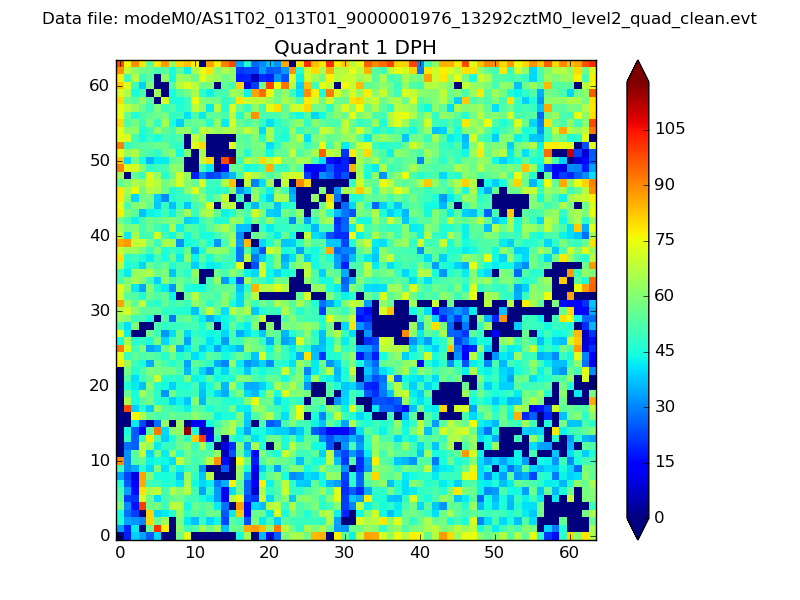 |
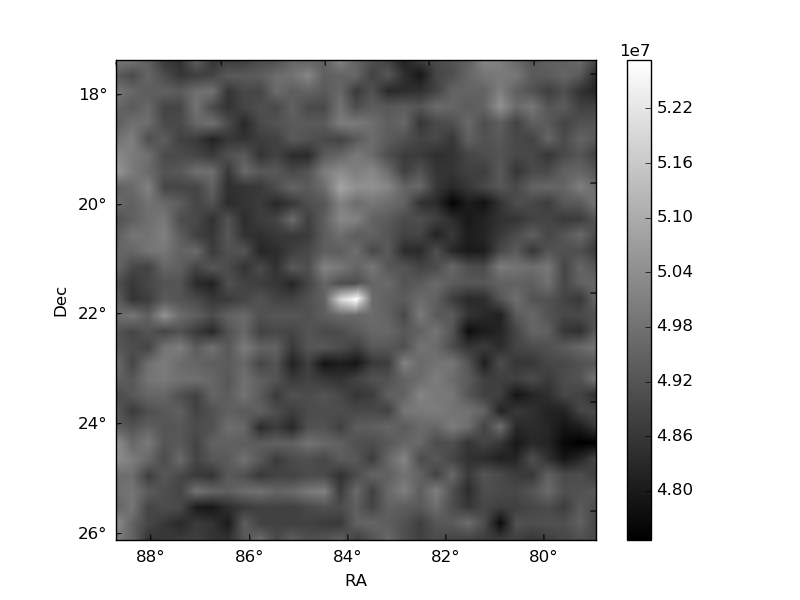
Quadrant B |
|---|---|---|---|
| Quadrant D | 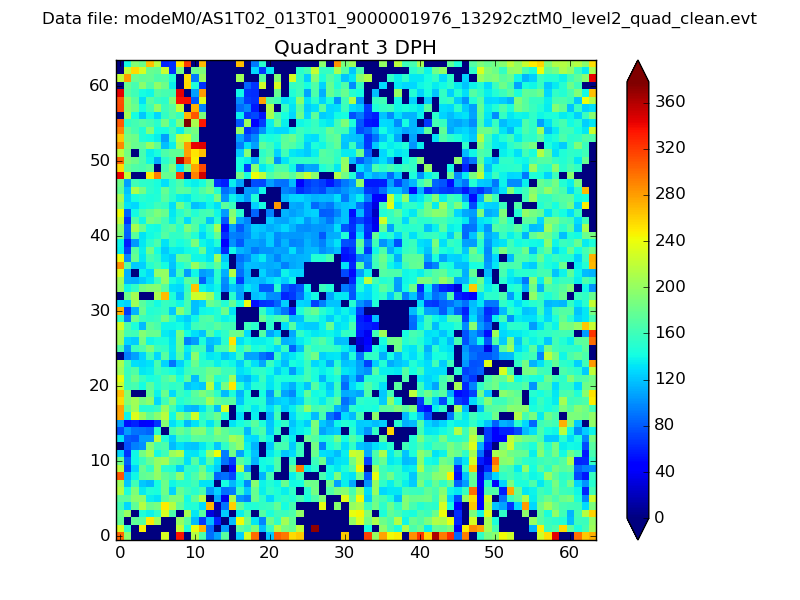 |
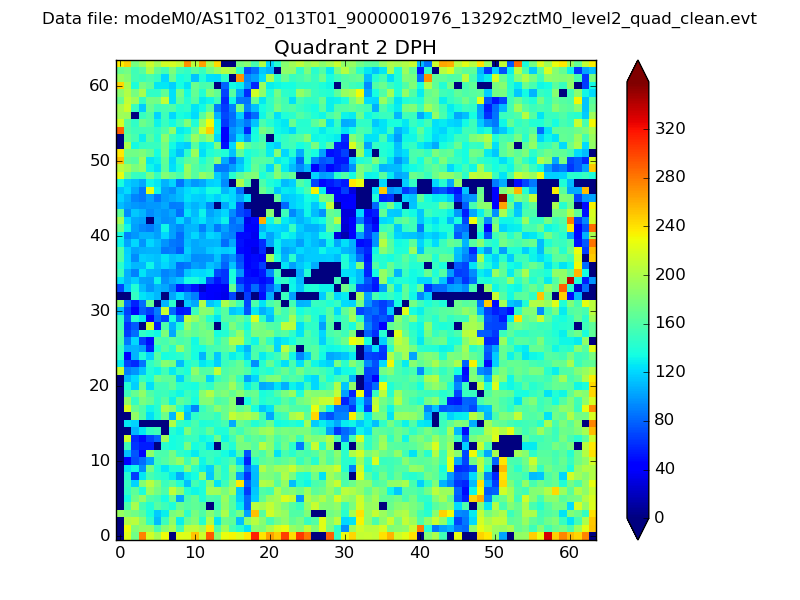 |
Quadrant C |
| Plot type | Count rate plots | Images |
|---|---|---|
| Comparison with Poisson distribution Blue bars denote a histogram of data divided into 1 sec bins. Red curve is a Poisson curve with rate = median count rate of data. |
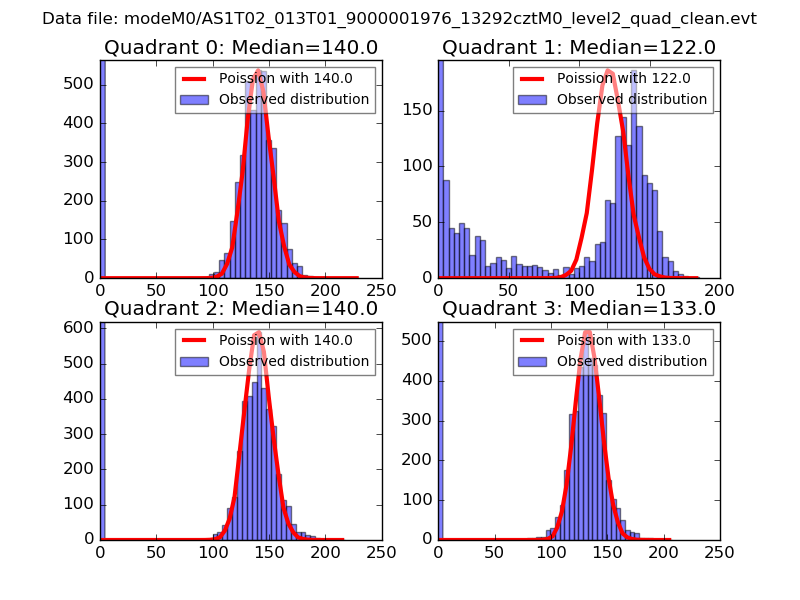 |
 |
| Quadrant-wise count rates Data is divided into 100 sec bins |
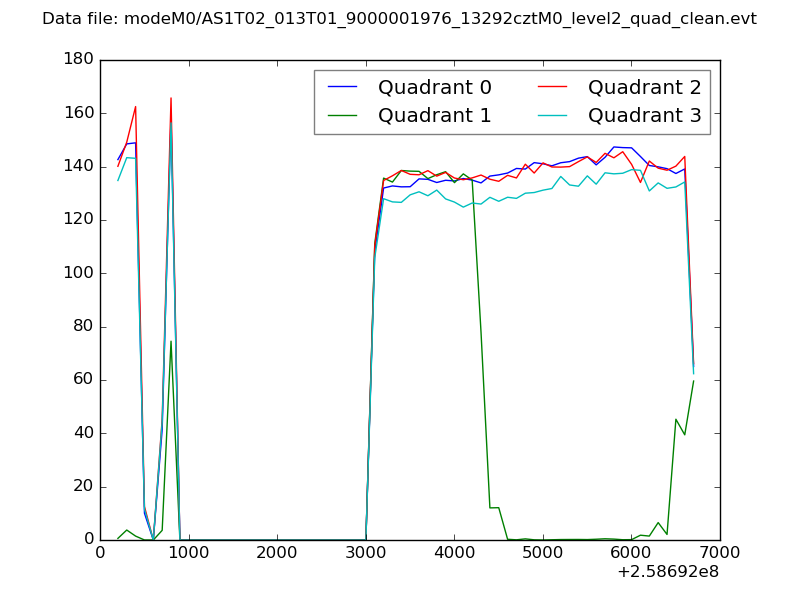 |
|
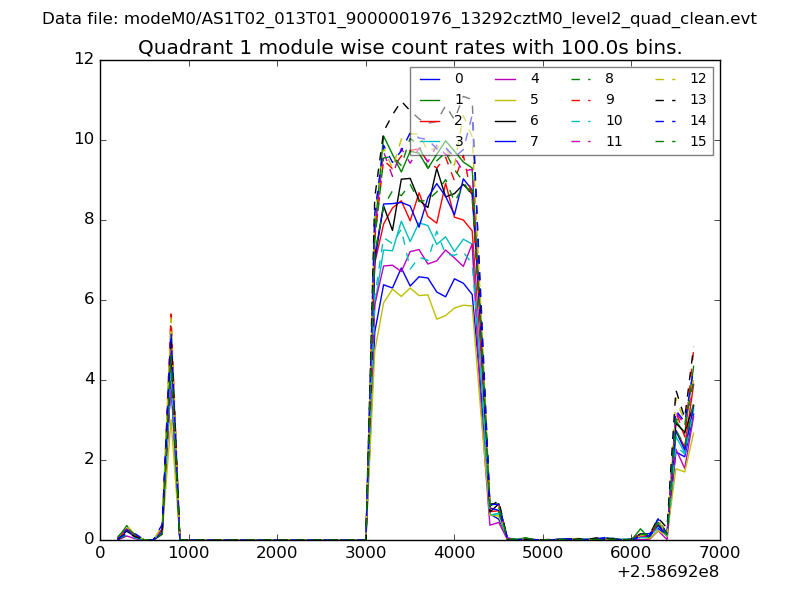
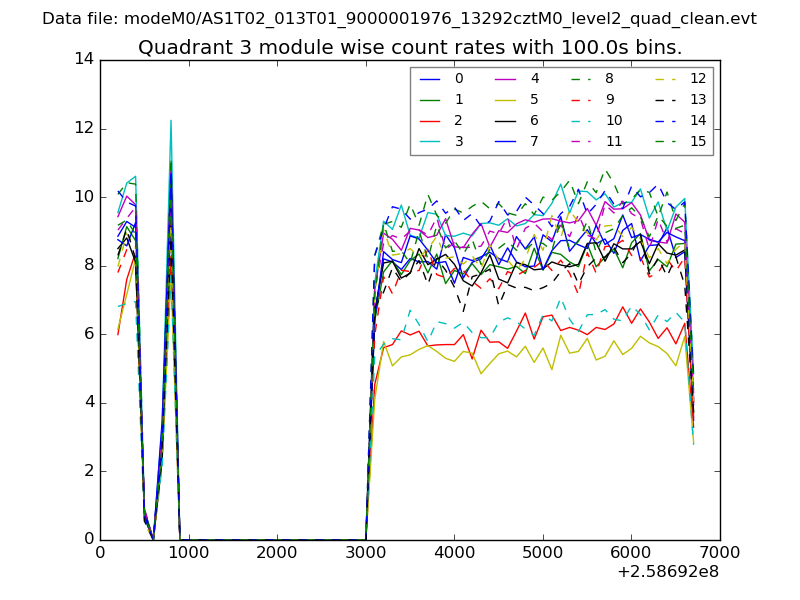
| Module-wise count rates for Quadrant A Data is divided into 100 sec bins |
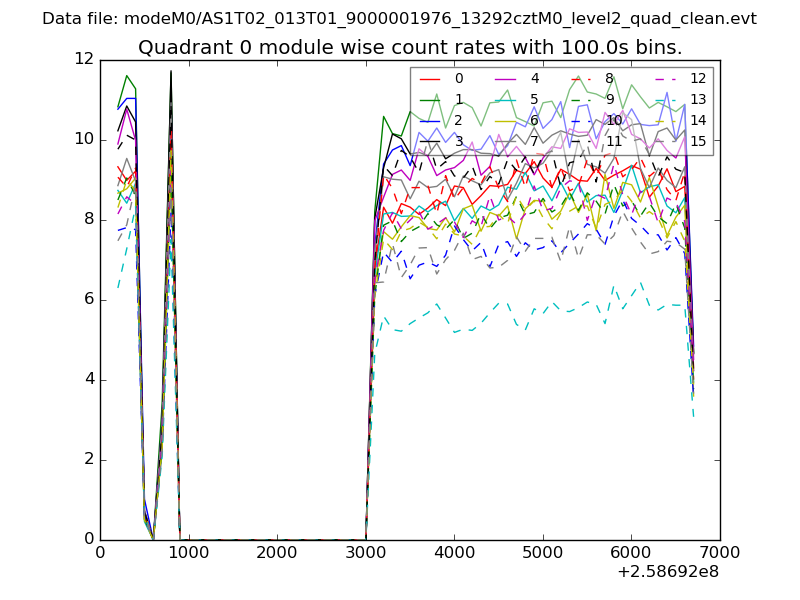 |
 |
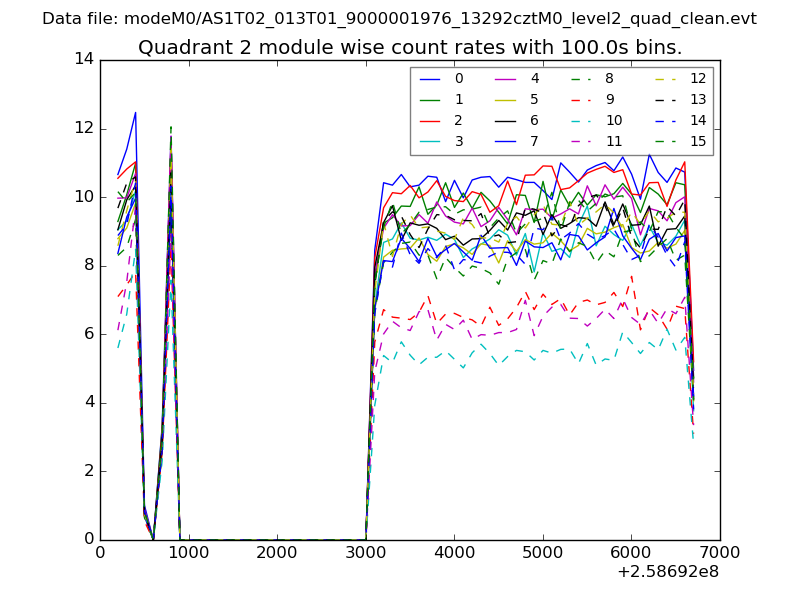
| Module-wise count rates for Quadrant B Data is divided into 100 sec bins |
 |
 |
| Module-wise count rates for Quadrant C Data is divided into 100 sec bins |
 |
 |
| Module-wise count rates for Quadrant D Data is divided into 100 sec bins |
 |
 |
| Parameter | Plot |
|---|---|
| CZT HV Monitor | 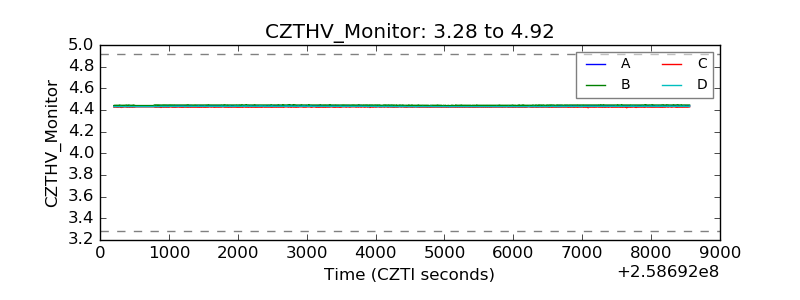 |
| D_VDD | 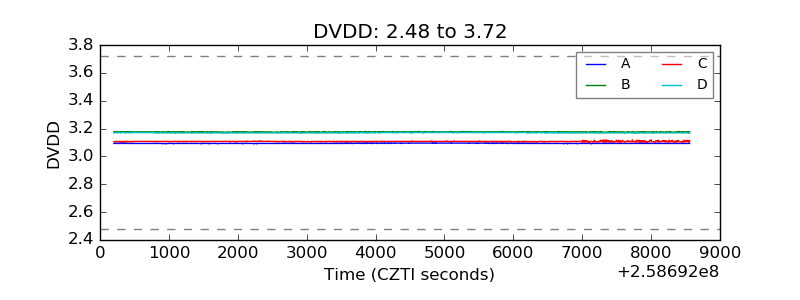 |
| Temperature 1 | 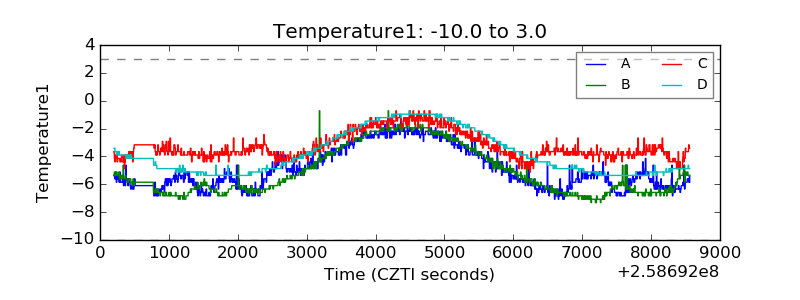 |
| Veto HV Monitor | 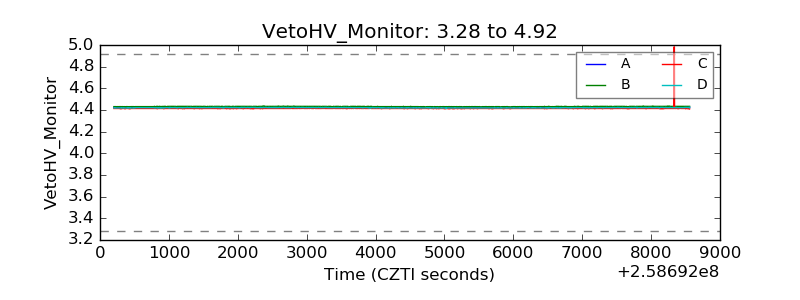 |
| Veto LLD | 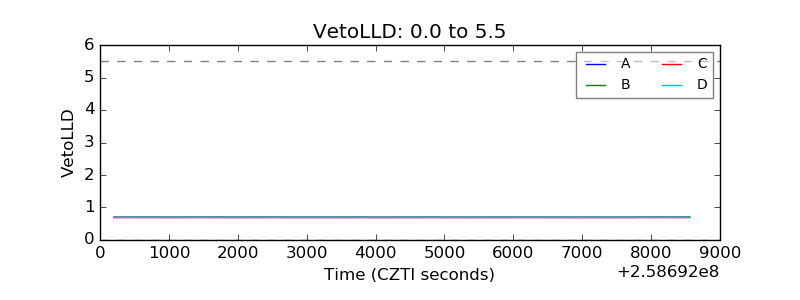 |
| Alpha Counter | 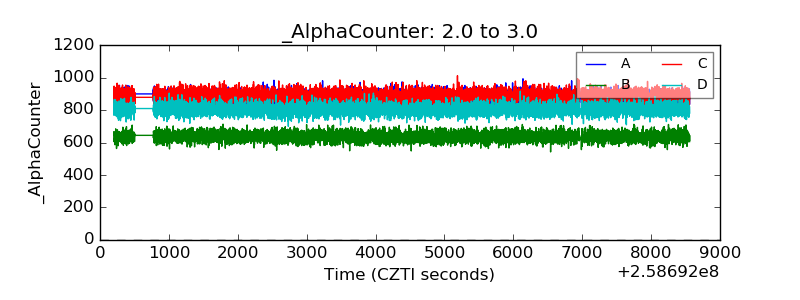 |
| _CPM_Rate | 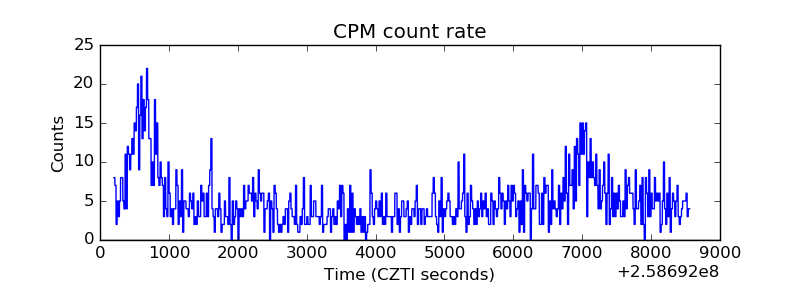 |
| CZT Counter | 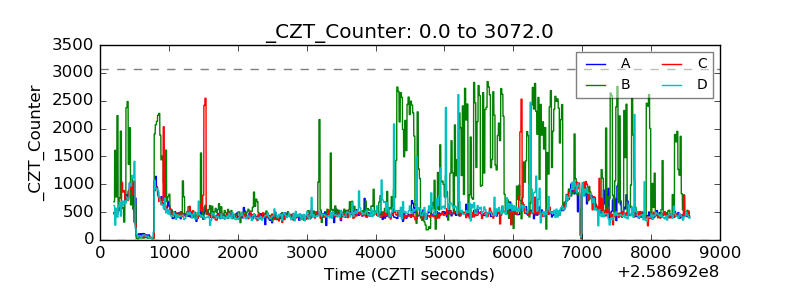 |
| +2.5 Volts monitor |  |
| +5 Volts monitor | 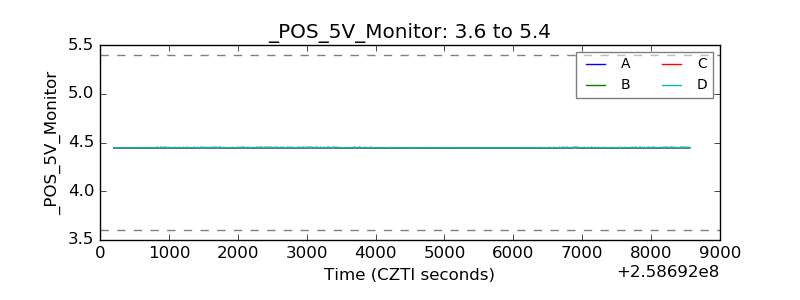 |
| _ROLL_ROT | 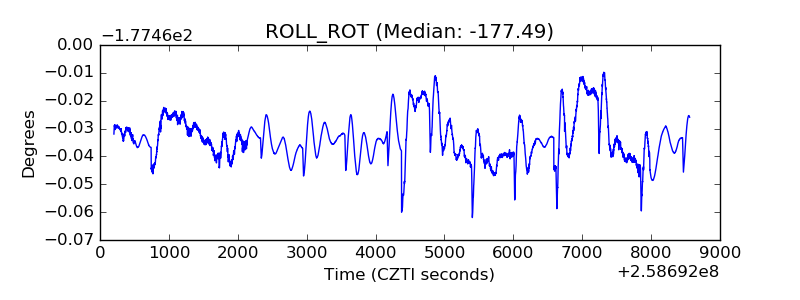 |
| _Roll_DEC | 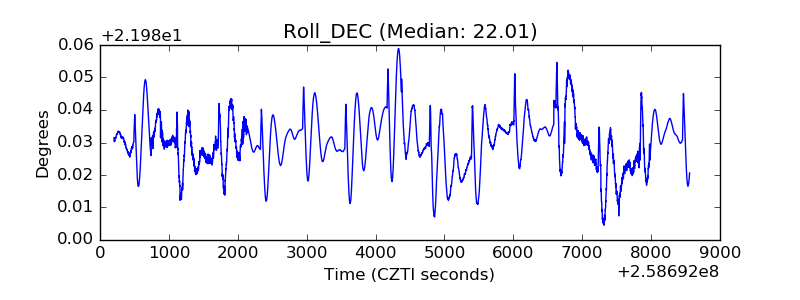 |
| _Roll_RA | 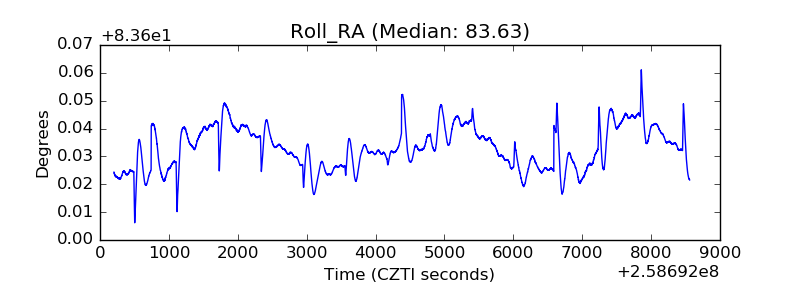 |
| Veto Counter | 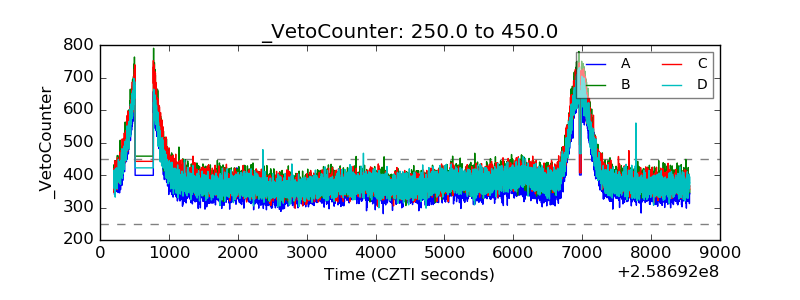 |