| Param | Original file | Final file |
|---|---|---|
| Filename | modeM0/AS1T02_013T01_9000001976_13293cztM0_level2.evt | modeM0/AS1T02_013T01_9000001976_13293cztM0_level2_quad_clean.evt |
| Size (bytes) | 701,328,960 | 74,269,440 |
| Size | 668.8 MB | 70.8 MB |
| Events in quadrant A | 4,235,752 | 526,869 |
| Events in quadrant B | 7,050,139 | 184,145 |
| Events in quadrant C | 3,621,008 | 531,041 |
| Events in quadrant D | 5,812,389 | 472,308 |
| Mode M9 | |||
|---|---|---|---|
| Quadrant | BADHDUFLAG | Total packets | Discarded packets |
| A | 0 | 4 | 0 |
| B | 0 | 4 | 0 |
| C | 0 | 4 | 0 |
| D | 0 | 4 | 0 |
| Mode SS | |||
|---|---|---|---|
| Quadrant | BADHDUFLAG | Total packets | Discarded packets |
| A | 0 | 154 | 0 |
| B | 0 | 154 | 0 |
| C | 0 | 154 | 0 |
| D | 0 | 154 | 0 |
| Mode M0 | |||
|---|---|---|---|
| Quadrant | BADHDUFLAG | Total packets | Discarded packets |
| A | 0 | 17496 | 2 |
| B | 0 | 25979 | 1 |
| C | 0 | 15784 | 1 |
| D | 0 | 22377 | 1 |
| Quadrant | Total seconds | Saturated seconds | Saturation percentage |
|---|---|---|---|
| A | 7666 | 172 | 2.243673% |
| B | 7666 | 3506 | 45.734412% |
| C | 7666 | 91 | 1.187060% |
| D | 7666 | 800 | 10.435690% |
Noise dominated data is calculated using 1-second bins in cleaned event files. If a bin has >2000 counts, and if more than 50% of those come from <1% of pixels, then it is considered to be noise-dominated and hence unusable.
| Quadrant | # 1 sec bins | Bins with >0 counts | Bins with >2000 counts | High rate bins dominated by noise | Noise dominated (total time) | Noise dominated (detector-on time) | Marked lightcurve |
|---|---|---|---|---|---|---|---|
| A | 7987 | 7668 | 21 | 21 | 0.26% | 0.27% | 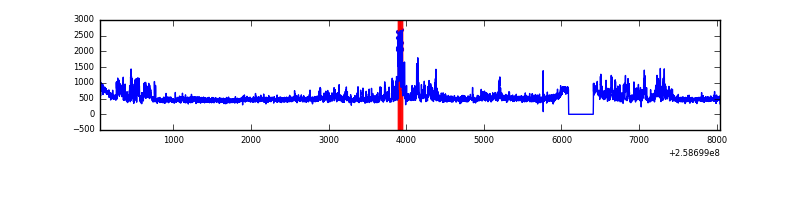 |
| B | 7987 | 7667 | 898 | 898 | 11.24% | 11.71% | 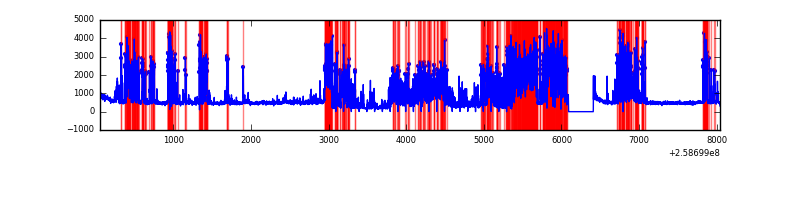 |
| C | 7987 | 7668 | 0 | 0 | 0.00% | 0.00% | 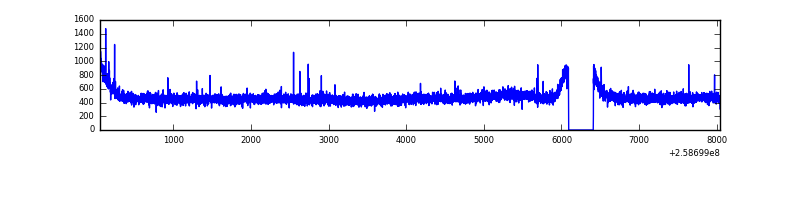 |
| D | 7987 | 7668 | 564 | 564 | 7.06% | 7.36% | 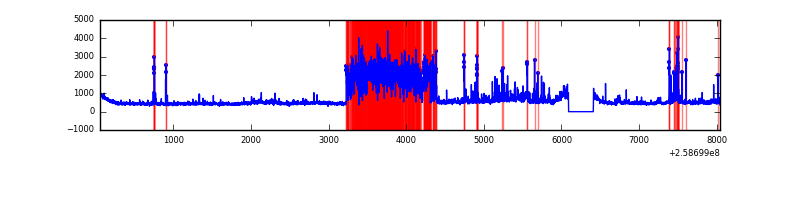 |
Top three noisy pixels from each quadrant. If the there are fewer than three noisy pixels in the level2.evt file, extra rows are filled as -1
| Pixel properties | Quadrant properties | ||||||
|---|---|---|---|---|---|---|---|
| Quadrant | DetID | PixID | Counts | Sigma | Mean | Median | Sigma |
| A | 8 | 15 | 454544 | 2360.64 | 938 | 919 | 192.2 |
| A | 15 | 69 | 116271 | 600.28 | 938 | 919 | 192.2 |
| A | 1 | 162 | 32727 | 165.53 | 938 | 919 | 192.2 |
| B | 4 | 239 | 4607759 | 39278.82 | 598 | 584 | 117.3 |
| B | 3 | 64 | 33523 | 280.82 | 598 | 584 | 117.3 |
| B | 0 | 214 | 17057 | 140.44 | 598 | 584 | 117.3 |
| C | 15 | 208 | 13446 | 58.33 | 920 | 928 | 214.6 |
| C | 13 | 61 | 6650 | 26.66 | 920 | 928 | 214.6 |
| C | 3 | 233 | 6109 | 24.14 | 920 | 928 | 214.6 |
| D | 1 | 52 | 1892761 | 8826.4 | 887 | 864 | 214.3 |
| D | 8 | 195 | 231736 | 1077.1 | 887 | 864 | 214.3 |
| D | 13 | 249 | 171649 | 796.78 | 887 | 864 | 214.3 |
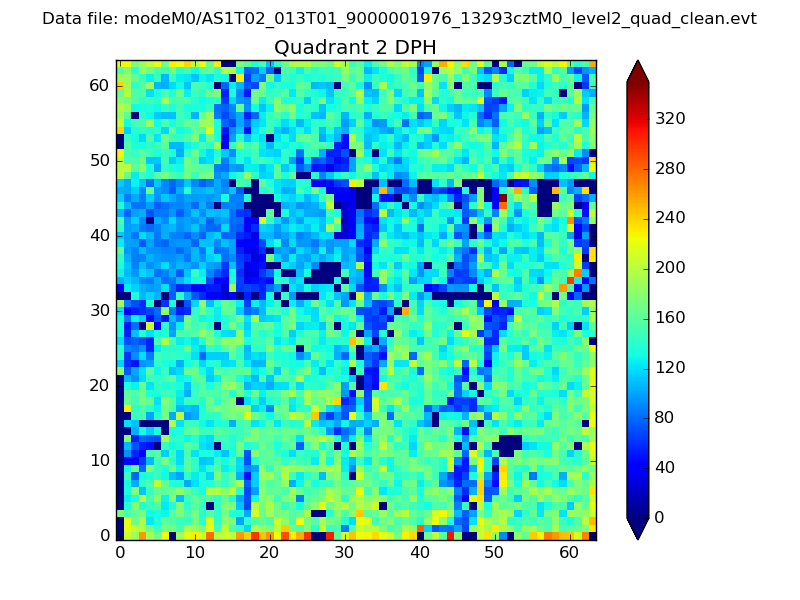
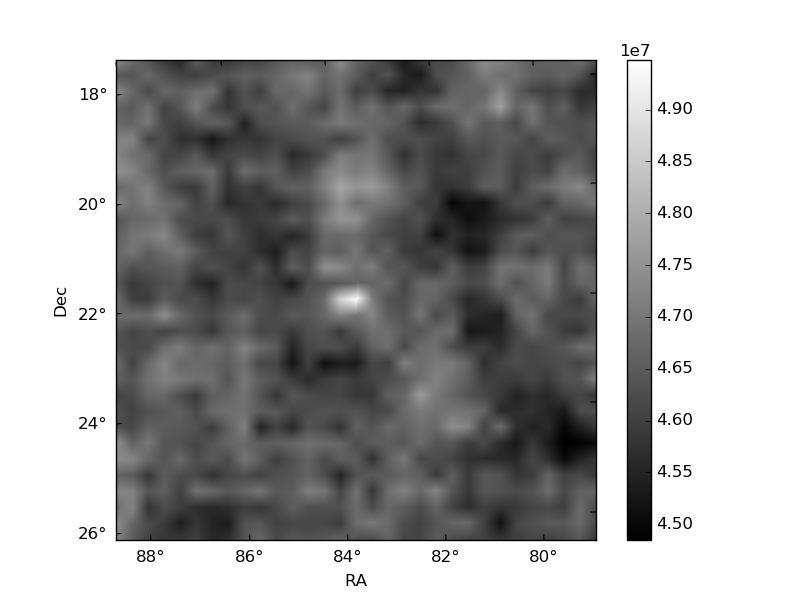
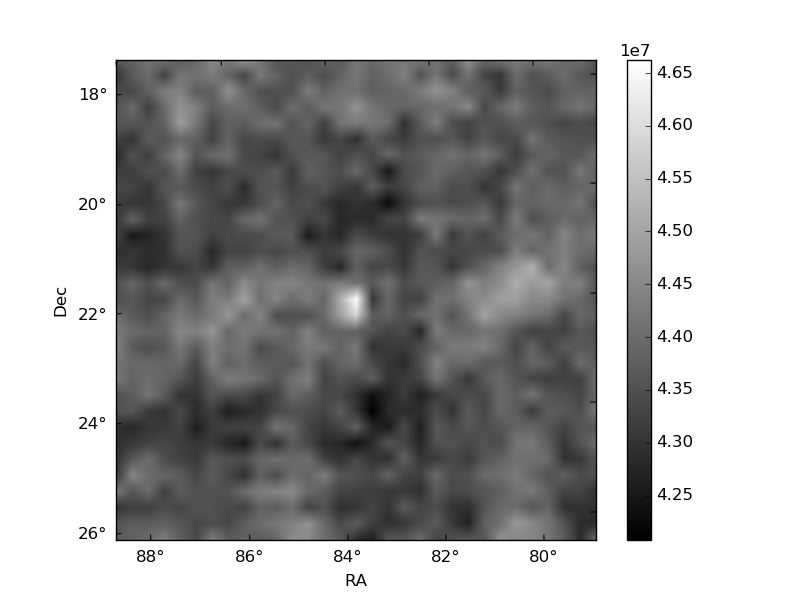
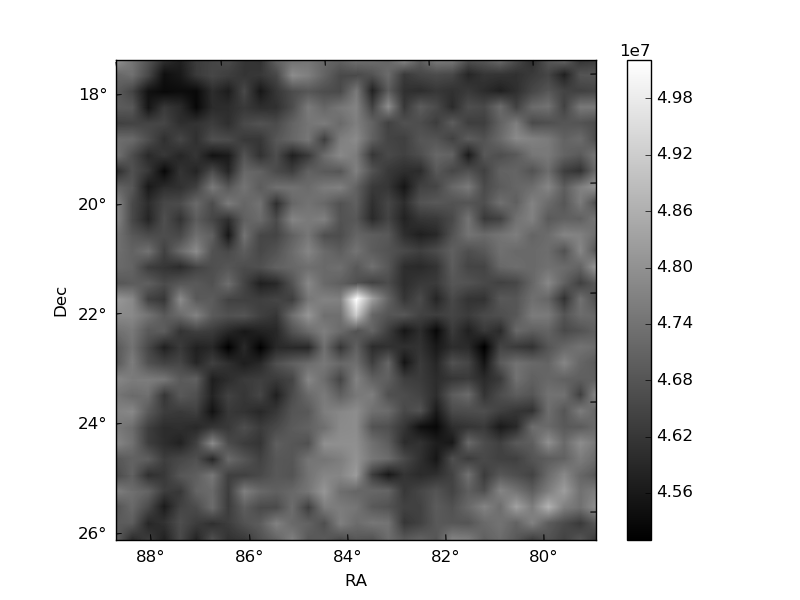
Histogram calculated using DETX and DETY for each event in the final _common_clean file
| Quadrant A | 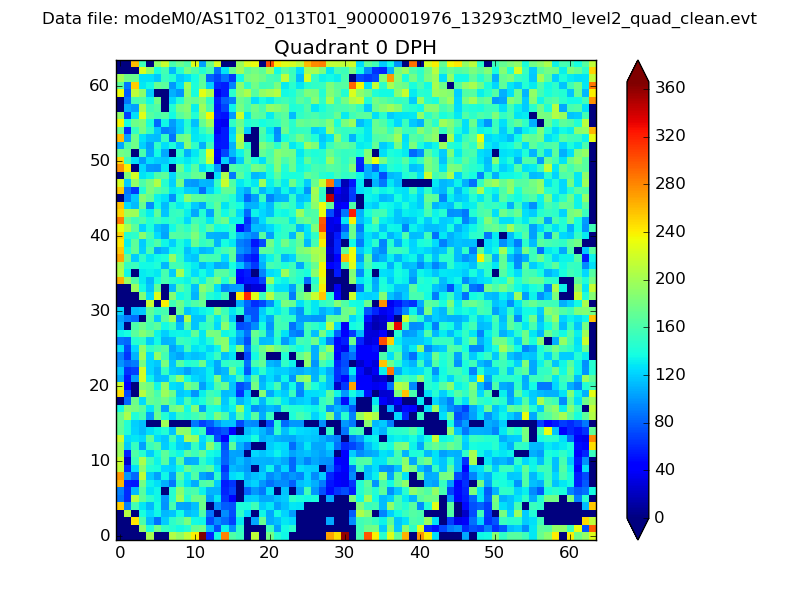 |
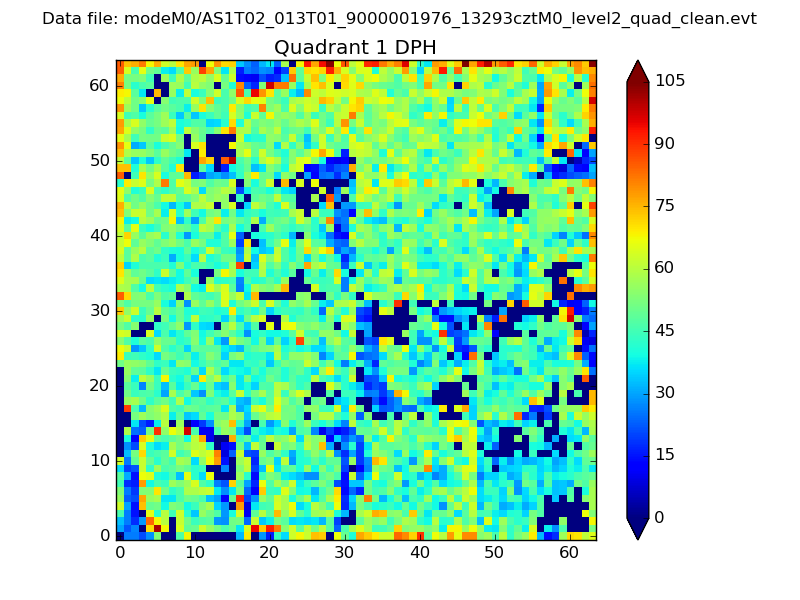 |
Quadrant B |
|---|---|---|---|
| Quadrant D | 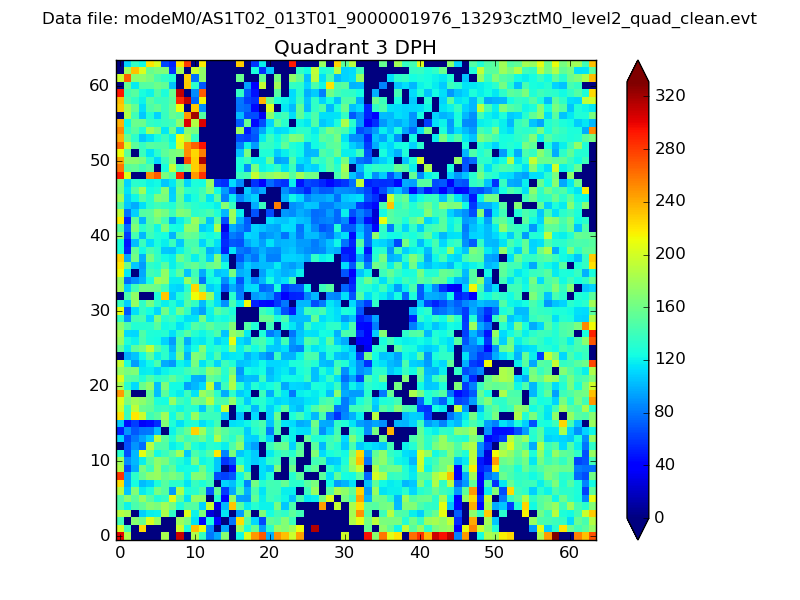 |
 |
Quadrant C |
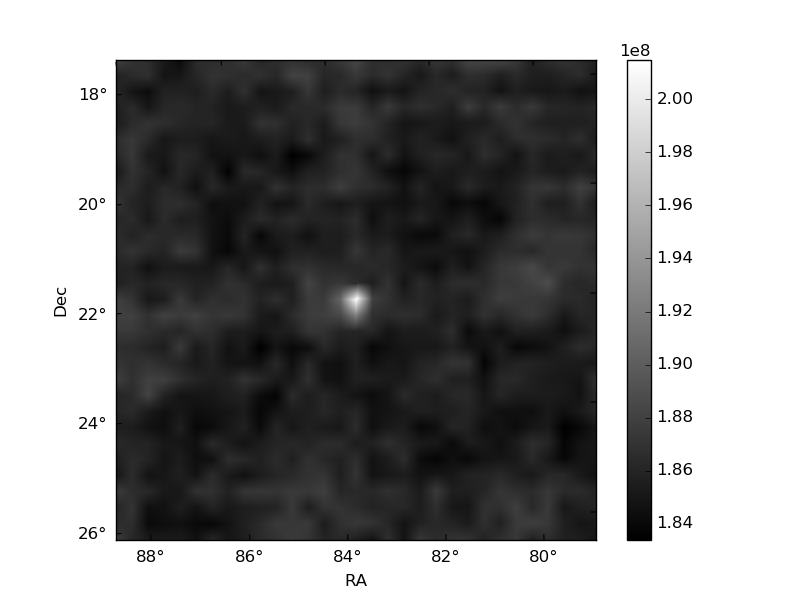
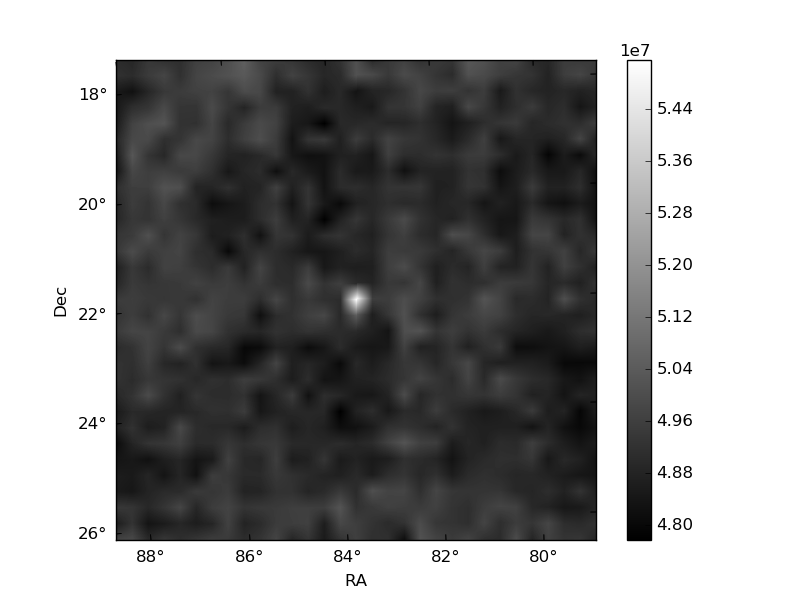
| Plot type | Count rate plots | Images |
|---|---|---|
| Comparison with Poisson distribution Blue bars denote a histogram of data divided into 1 sec bins. Red curve is a Poisson curve with rate = median count rate of data. |
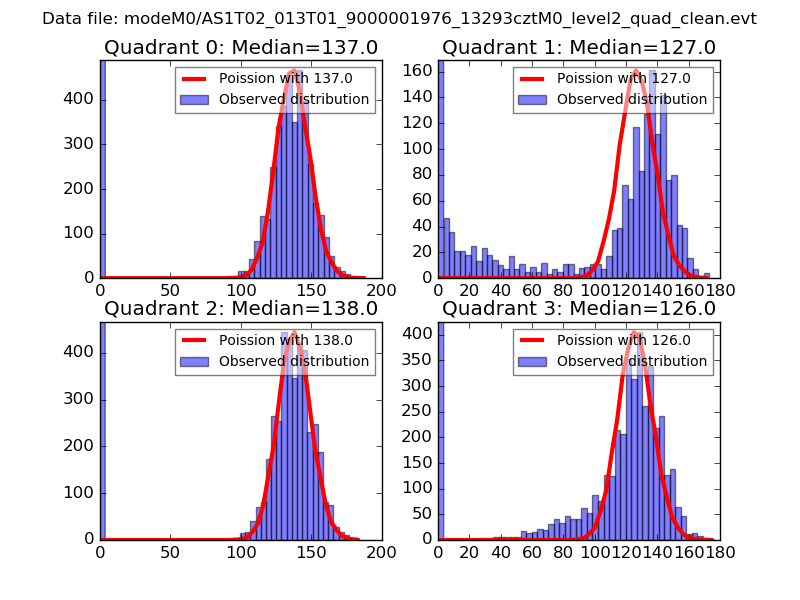 |
 |
| Quadrant-wise count rates Data is divided into 100 sec bins |
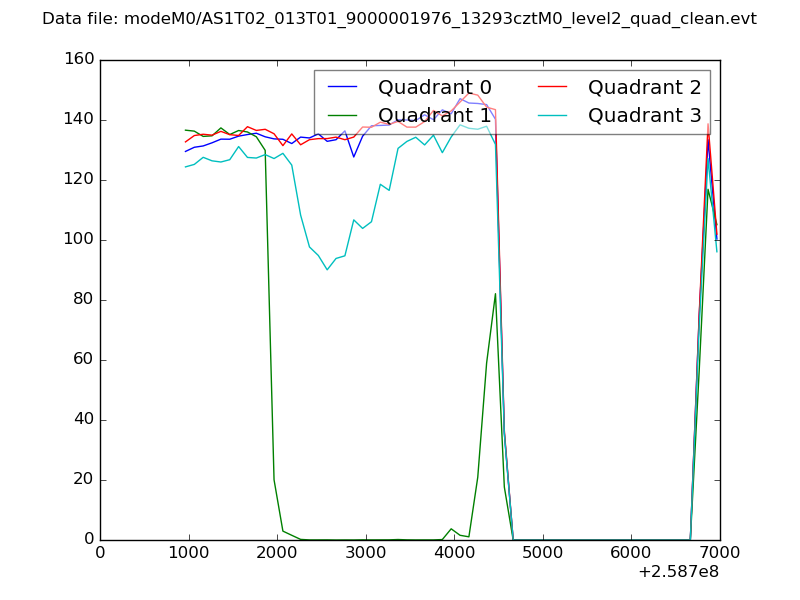 |
|
| Module-wise count rates for Quadrant A Data is divided into 100 sec bins |
 |
 |
| Module-wise count rates for Quadrant B Data is divided into 100 sec bins |
 |
 |
| Module-wise count rates for Quadrant C Data is divided into 100 sec bins |
 |
 |
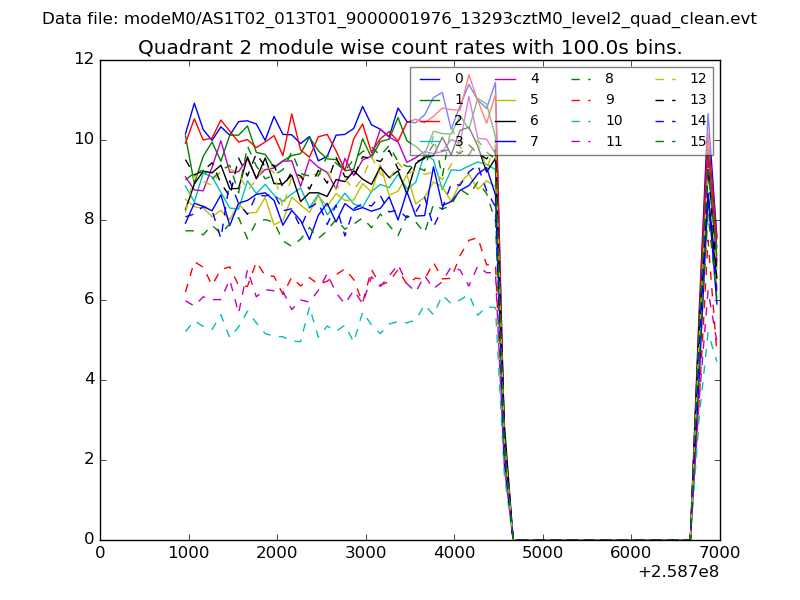
| Module-wise count rates for Quadrant D Data is divided into 100 sec bins |
 |
 |
| Parameter | Plot |
|---|---|
| CZT HV Monitor | 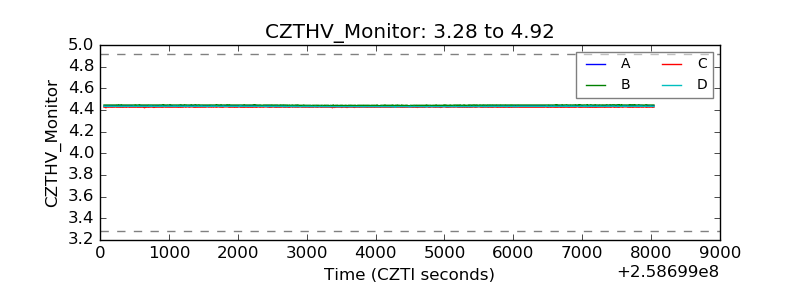 |
| D_VDD | 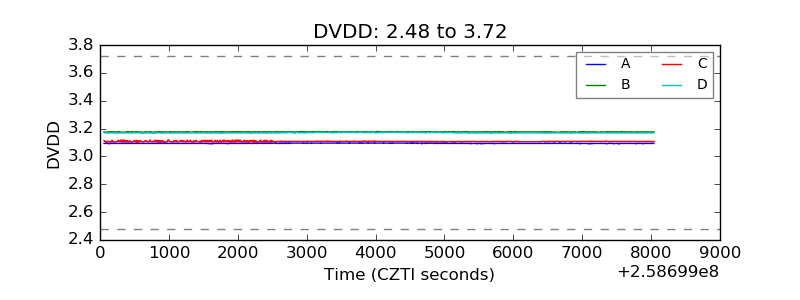 |
| Temperature 1 | 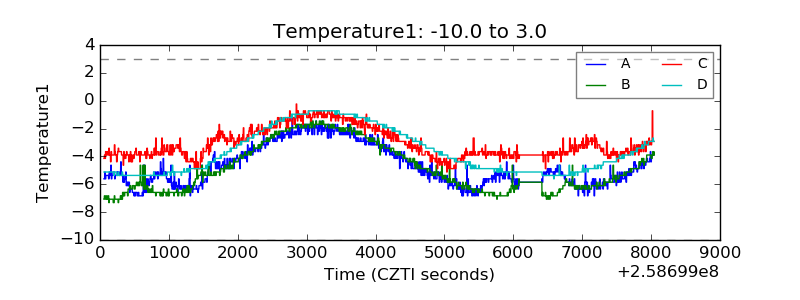 |
| Veto HV Monitor | 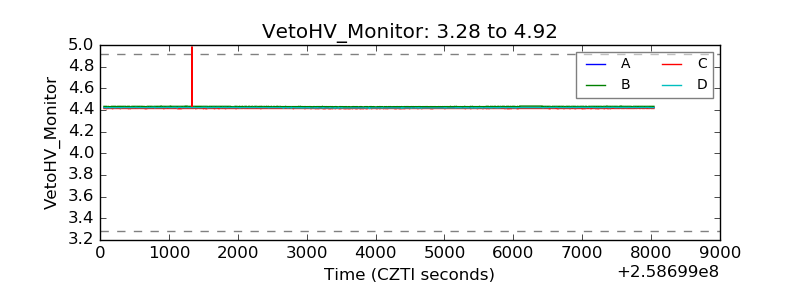 |
| Veto LLD |  |
| Alpha Counter | 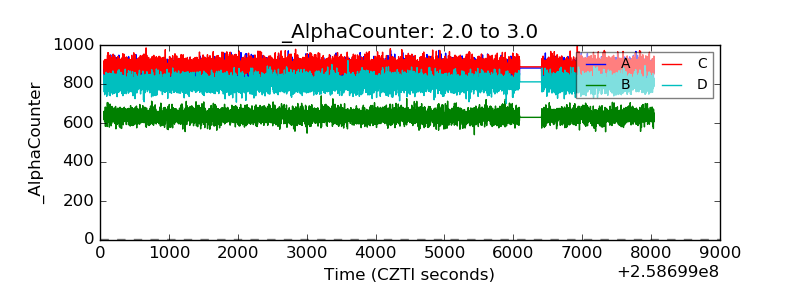 |
| _CPM_Rate | 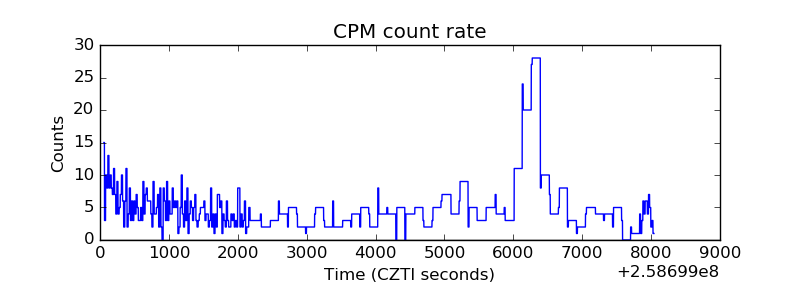 |
| CZT Counter | 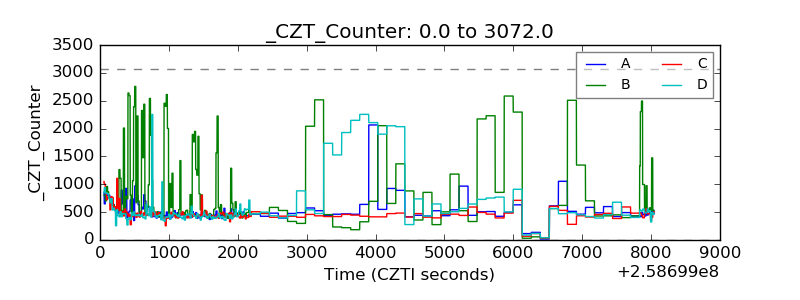 |
| +2.5 Volts monitor |  |
| +5 Volts monitor |  |
| _ROLL_ROT | 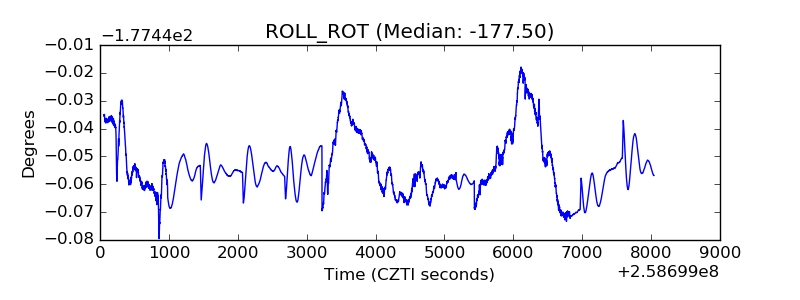 |
| _Roll_DEC | 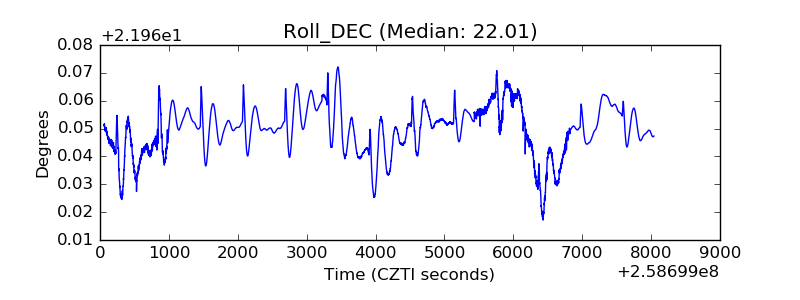 |
| _Roll_RA | 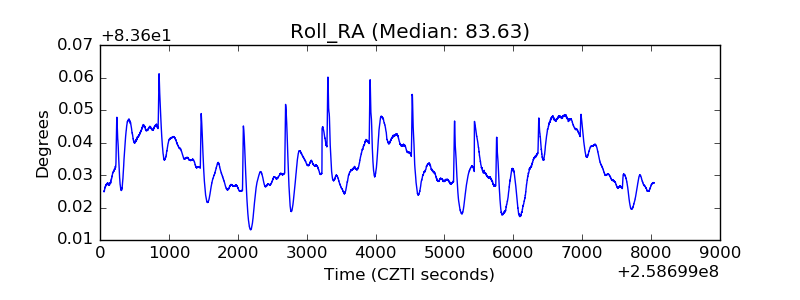 |
| Veto Counter |  |