| Param | Original file | Final file |
|---|---|---|
| Filename | modeM0/AS1T02_013T01_9000001976_13295cztM0_level2.evt | modeM0/AS1T02_013T01_9000001976_13295cztM0_level2_quad_clean.evt |
| Size (bytes) | 1,423,065,600 | 149,434,560 |
| Size | 1.3 GB | 142.5 MB |
| Events in quadrant A | 7,303,033 | 1,126,911 |
| Events in quadrant B | 16,803,961 | 391,239 |
| Events in quadrant C | 6,127,208 | 1,136,770 |
| Events in quadrant D | 11,992,248 | 976,146 |
| Mode M9 | |||
|---|---|---|---|
| Quadrant | BADHDUFLAG | Total packets | Discarded packets |
| A | 0 | 12 | 0 |
| B | 0 | 12 | 0 |
| C | 0 | 12 | 0 |
| D | 0 | 12 | 0 |
| Mode SS | |||
|---|---|---|---|
| Quadrant | BADHDUFLAG | Total packets | Discarded packets |
| A | 0 | 262 | 0 |
| B | 0 | 262 | 0 |
| C | 0 | 262 | 0 |
| D | 0 | 262 | 0 |
| Mode M0 | |||
|---|---|---|---|
| Quadrant | BADHDUFLAG | Total packets | Discarded packets |
| A | 0 | 29777 | 4 |
| B | 0 | 58503 | 3 |
| C | 0 | 26538 | 3 |
| D | 0 | 43955 | 3 |
| Quadrant | Total seconds | Saturated seconds | Saturation percentage |
|---|---|---|---|
| A | 12894 | 139 | 1.078021% |
| B | 12894 | 7643 | 59.275632% |
| C | 12894 | 61 | 0.473088% |
| D | 12894 | 1645 | 12.757872% |
Noise dominated data is calculated using 1-second bins in cleaned event files. If a bin has >2000 counts, and if more than 50% of those come from <1% of pixels, then it is considered to be noise-dominated and hence unusable.
| Quadrant | # 1 sec bins | Bins with >0 counts | Bins with >2000 counts | High rate bins dominated by noise | Noise dominated (total time) | Noise dominated (detector-on time) | Marked lightcurve |
|---|---|---|---|---|---|---|---|
| A | 14140 | 12897 | 15 | 15 | 0.11% | 0.12% | 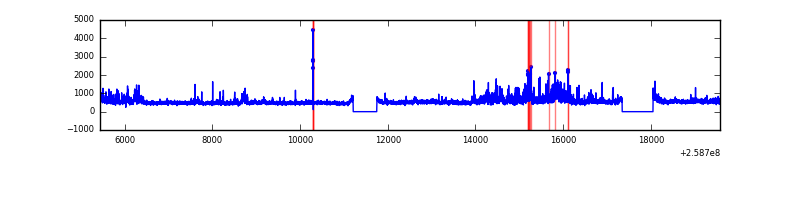 |
| B | 14139 | 12896 | 3322 | 3322 | 23.50% | 25.76% | 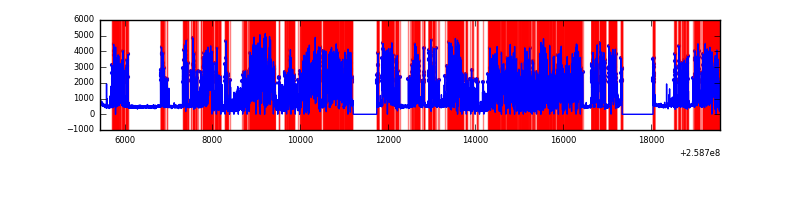 |
| C | 14140 | 12897 | 5 | 5 | 0.04% | 0.04% | 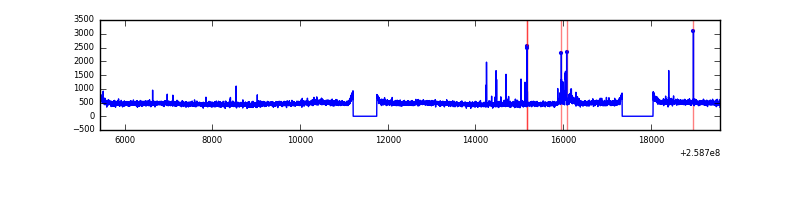 |
| D | 14140 | 12897 | 1390 | 1390 | 9.83% | 10.78% | 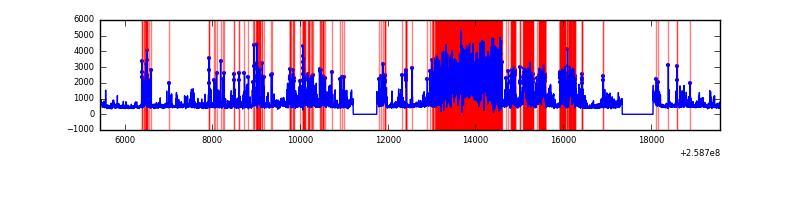 |
Top three noisy pixels from each quadrant. If the there are fewer than three noisy pixels in the level2.evt file, extra rows are filled as -1
| Pixel properties | Quadrant properties | ||||||
|---|---|---|---|---|---|---|---|
| Quadrant | DetID | PixID | Counts | Sigma | Mean | Median | Sigma |
| A | 8 | 15 | 1120812 | 3471.18 | 1571 | 1538 | 322.4 |
| A | 9 | 143 | 46266 | 138.71 | 1571 | 1538 | 322.4 |
| A | 1 | 162 | 41128 | 122.78 | 1571 | 1538 | 322.4 |
| B | 4 | 239 | 13386609 | 82378.18 | 842 | 820 | 162.5 |
| B | 0 | 214 | 25436 | 151.49 | 842 | 820 | 162.5 |
| B | 3 | 64 | 23788 | 141.35 | 842 | 820 | 162.5 |
| C | 15 | 208 | 134449 | 372.86 | 1535 | 1548 | 356.4 |
| C | 14 | 234 | 11138 | 26.9 | 1535 | 1548 | 356.4 |
| C | 13 | 61 | 11066 | 26.7 | 1535 | 1548 | 356.4 |
| D | 5 | 222 | 2742819 | 7748.32 | 1455 | 1415 | 353.8 |
| D | 1 | 52 | 1543502 | 4358.56 | 1455 | 1415 | 353.8 |
| D | 12 | 222 | 936546 | 2643.06 | 1455 | 1415 | 353.8 |
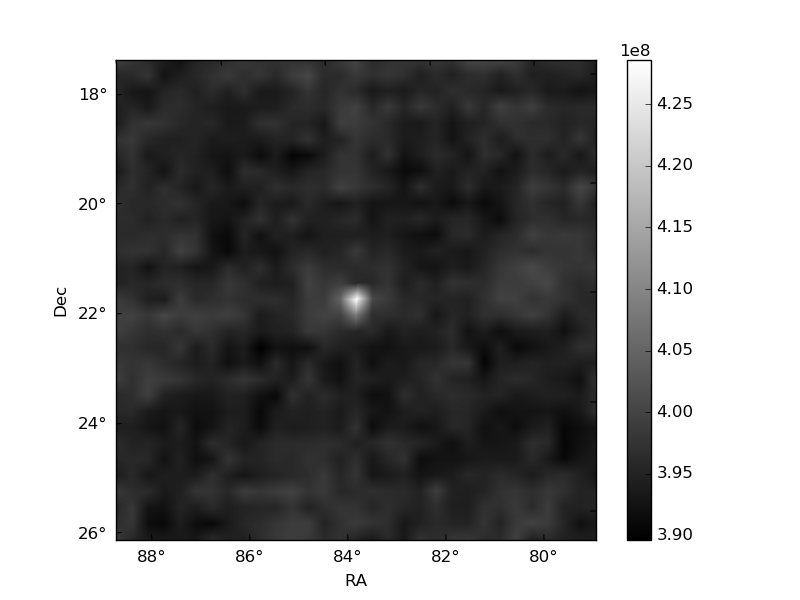
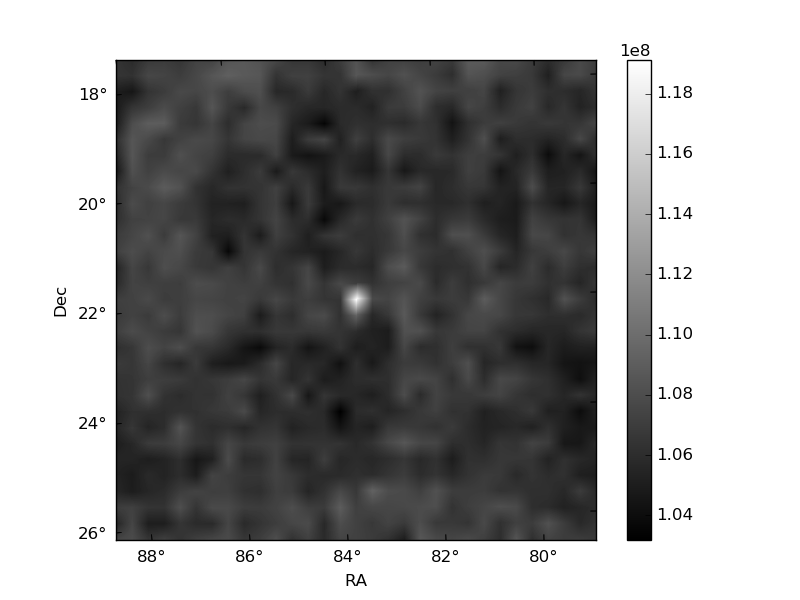
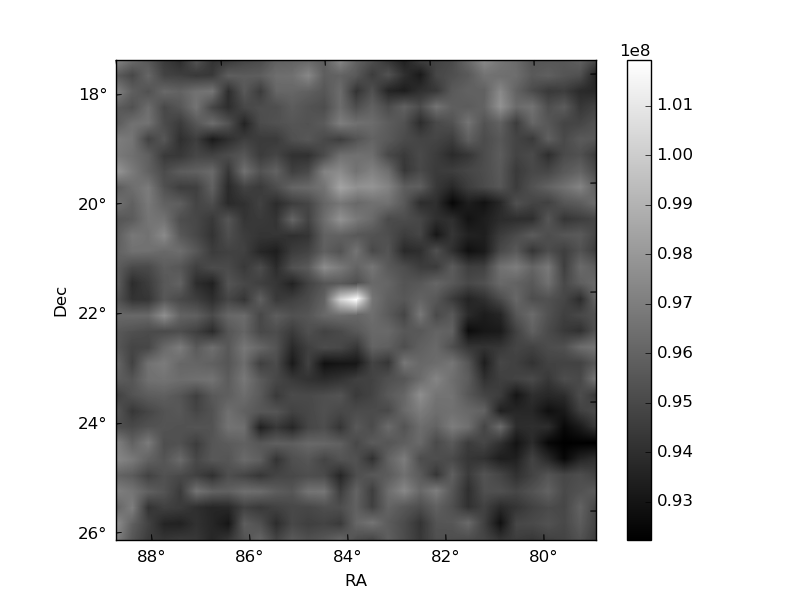
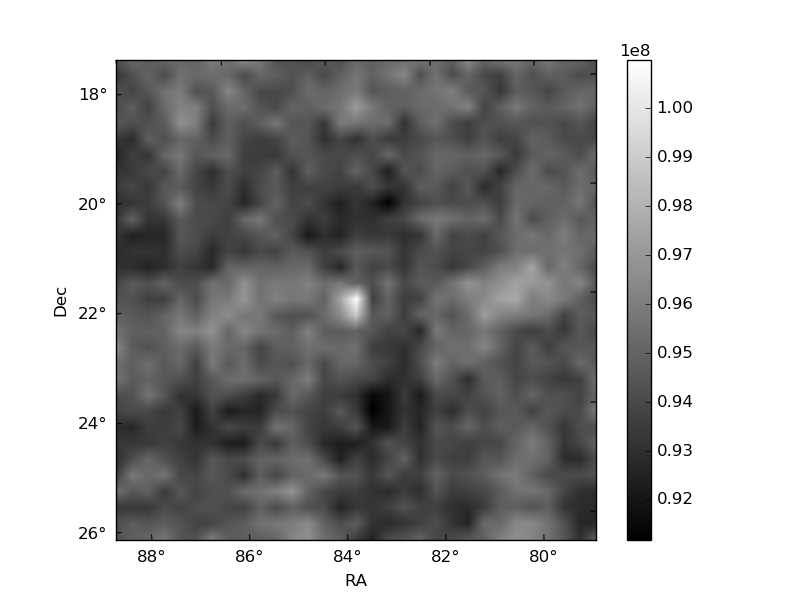
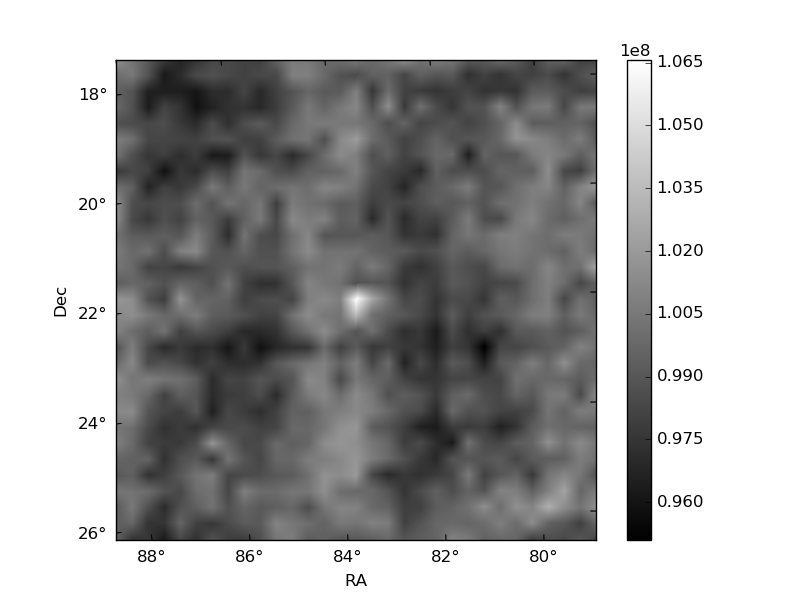
Histogram calculated using DETX and DETY for each event in the final _common_clean file
| Quadrant A | 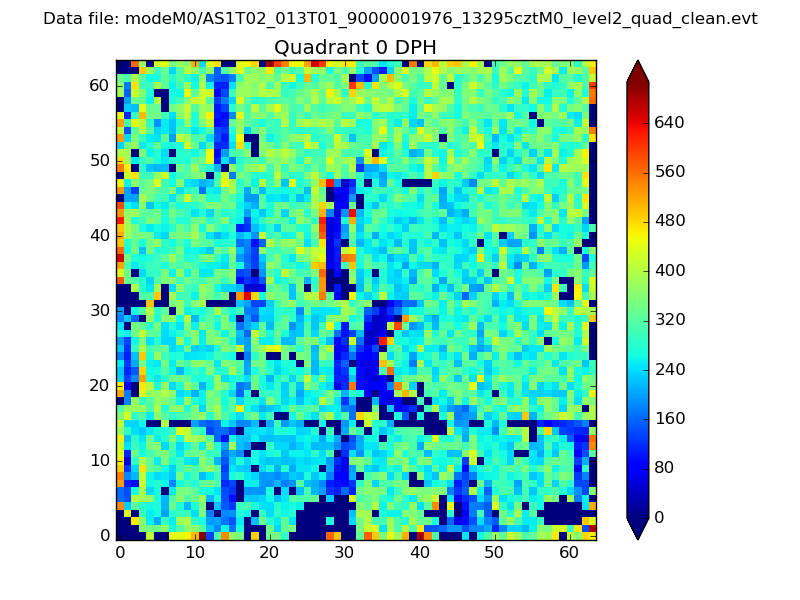 |
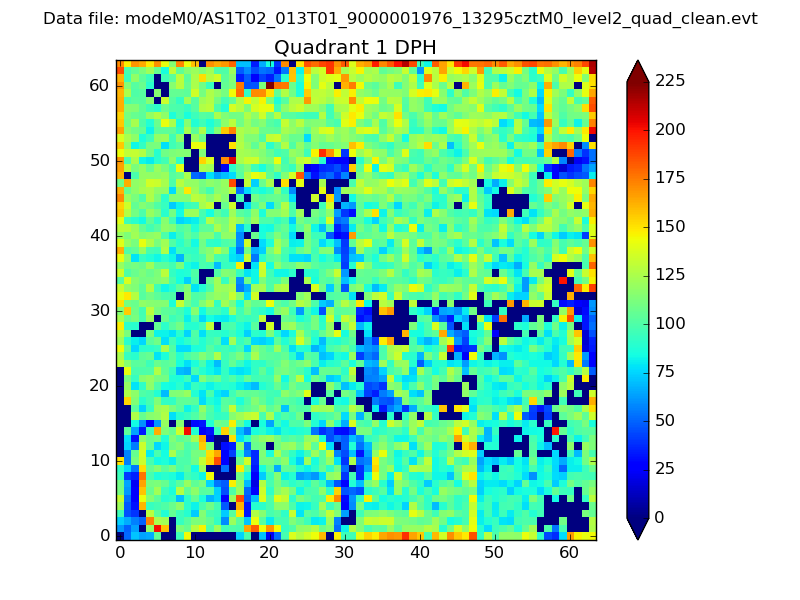 |
Quadrant B |
|---|---|---|---|
| Quadrant D | 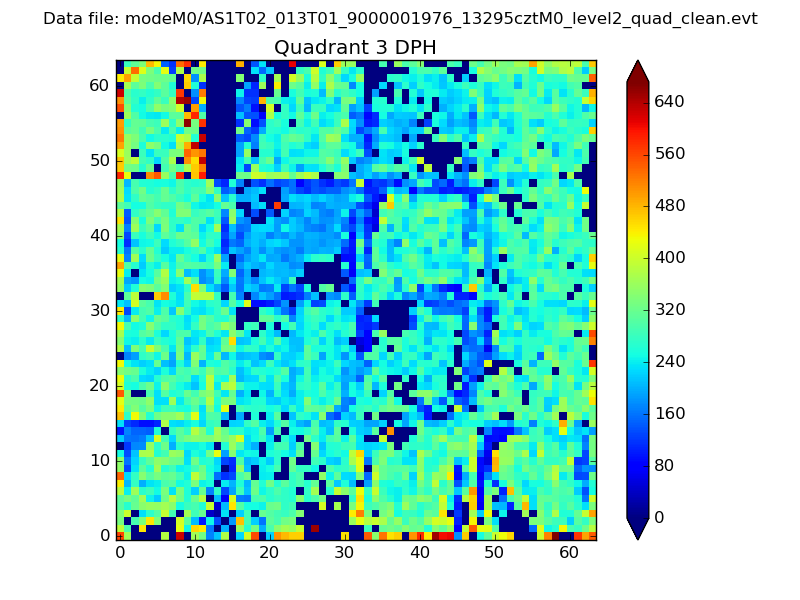 |
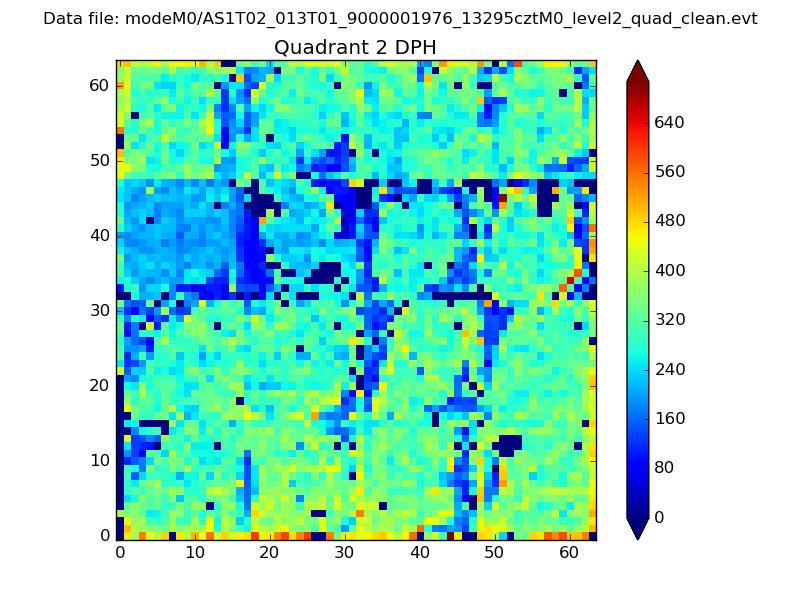 |
Quadrant C |
| Plot type | Count rate plots | Images |
|---|---|---|
| Comparison with Poisson distribution Blue bars denote a histogram of data divided into 1 sec bins. Red curve is a Poisson curve with rate = median count rate of data. |
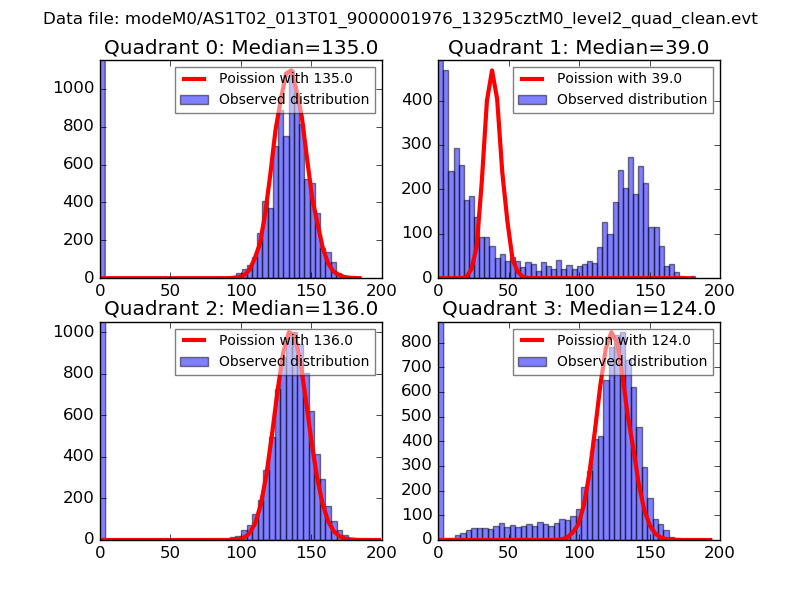 |
 |
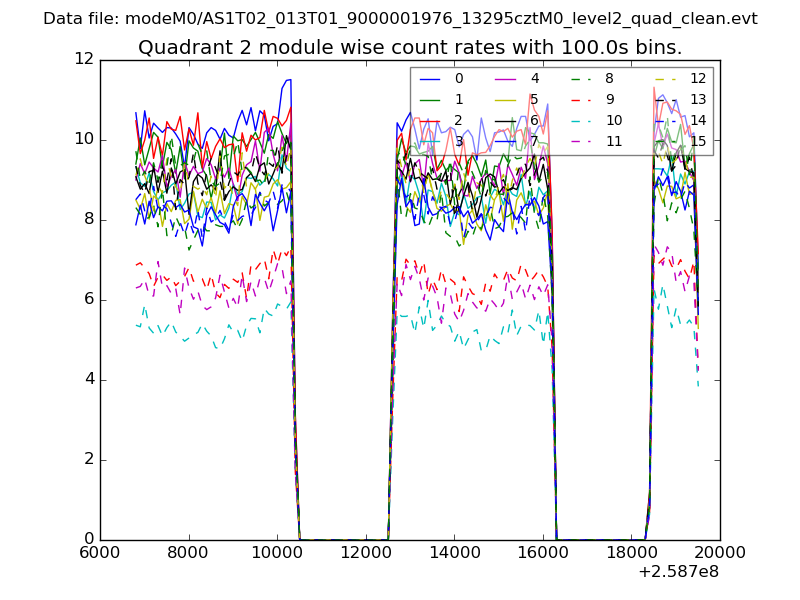
| Quadrant-wise count rates Data is divided into 100 sec bins |
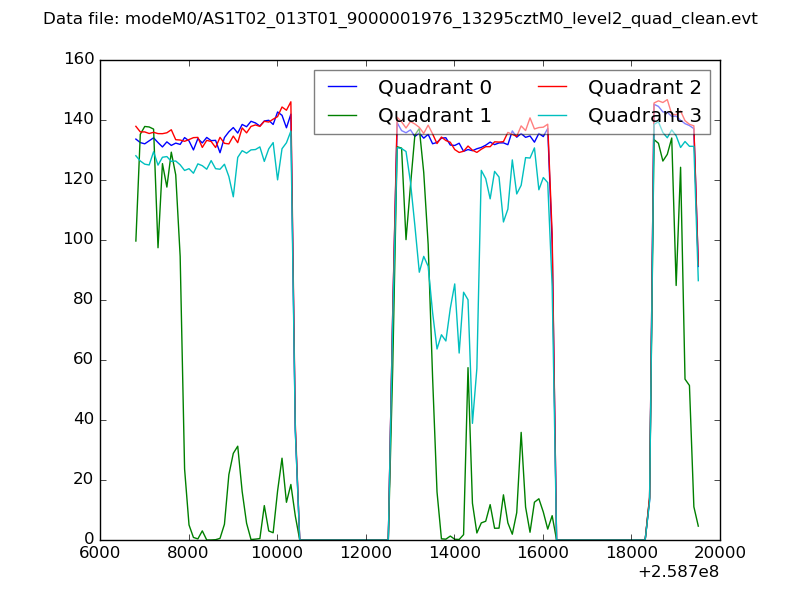 |
|
| Module-wise count rates for Quadrant A Data is divided into 100 sec bins |
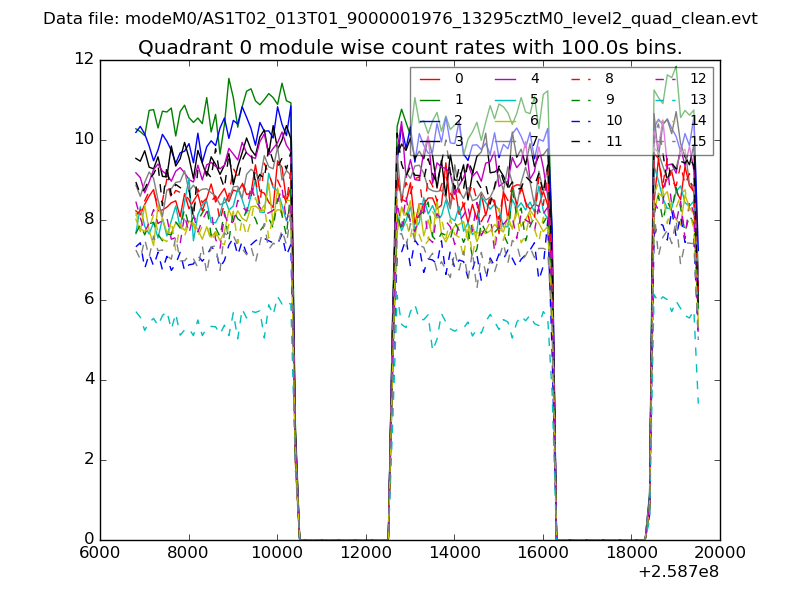 |
 |
| Module-wise count rates for Quadrant B Data is divided into 100 sec bins |
 |
 |
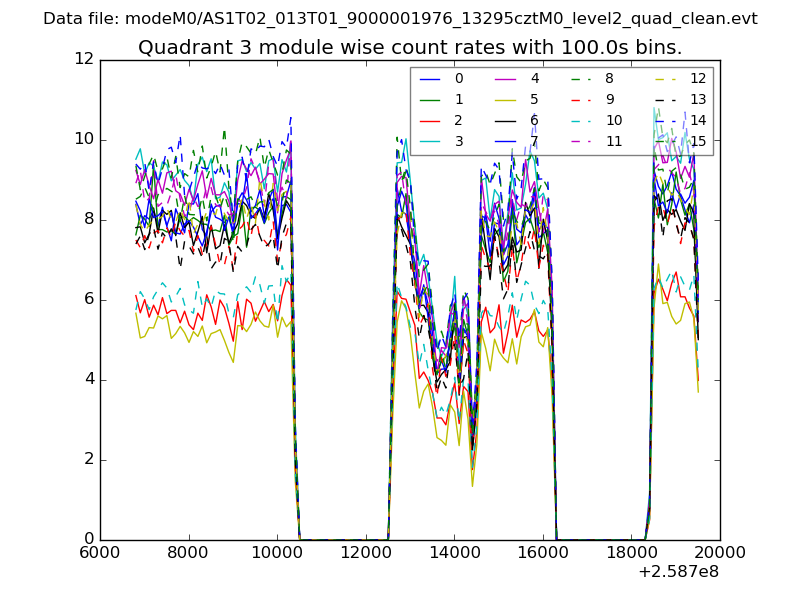
| Module-wise count rates for Quadrant C Data is divided into 100 sec bins |
 |
 |
| Module-wise count rates for Quadrant D Data is divided into 100 sec bins |
 |
 |
| Parameter | Plot |
|---|---|
| CZT HV Monitor | 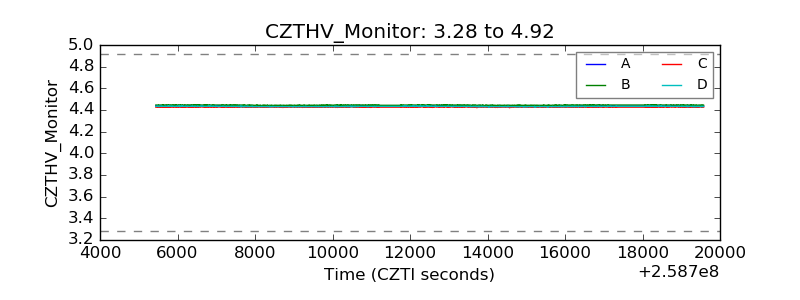 |
| D_VDD |  |
| Temperature 1 | 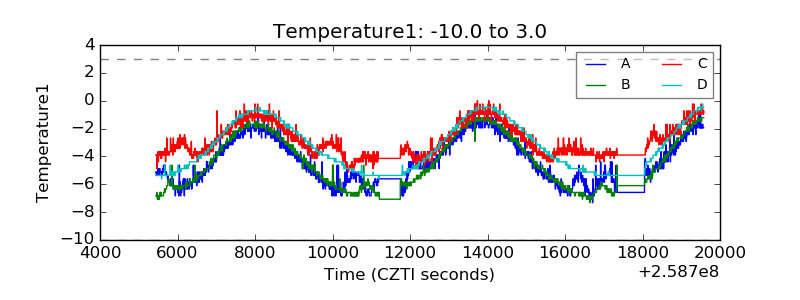 |
| Veto HV Monitor | 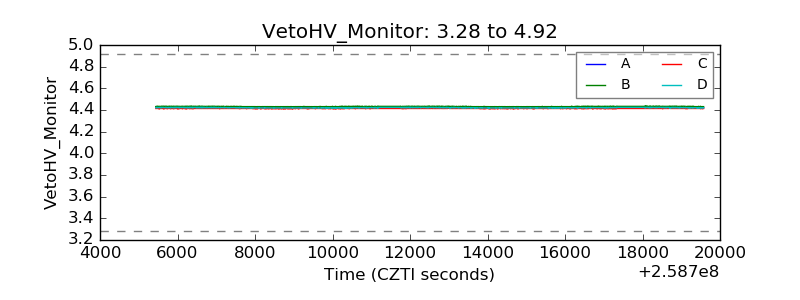 |
| Veto LLD | 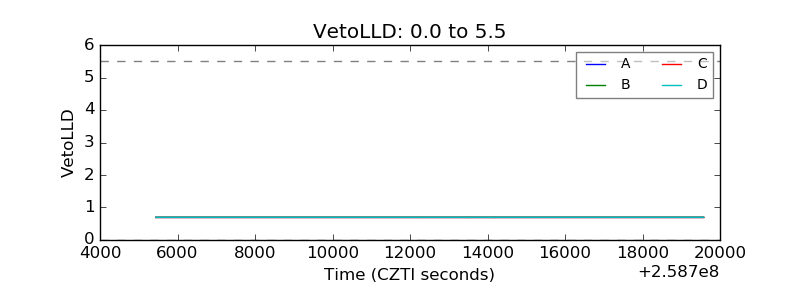 |
| Alpha Counter | 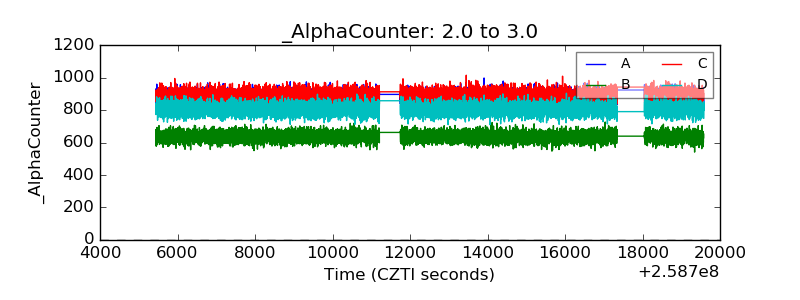 |
| _CPM_Rate | 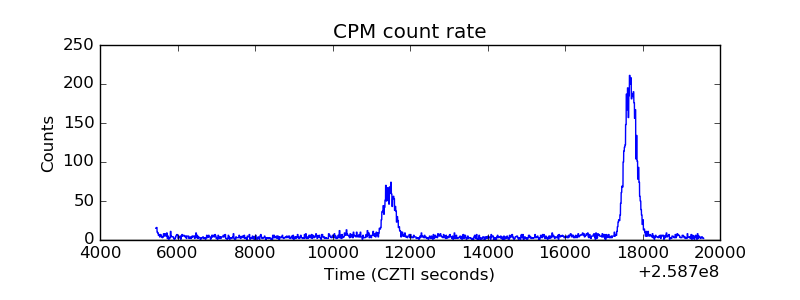 |
| CZT Counter | 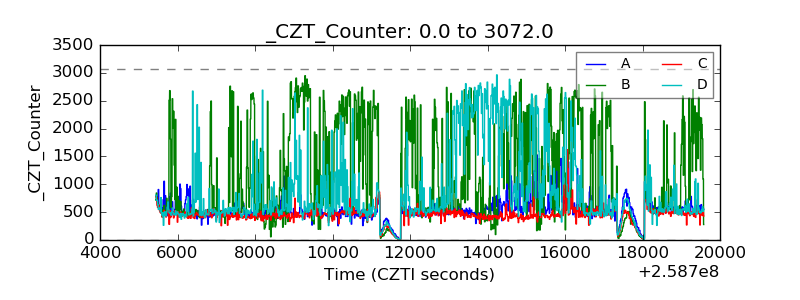 |
| +2.5 Volts monitor |  |
| +5 Volts monitor |  |
| _ROLL_ROT | 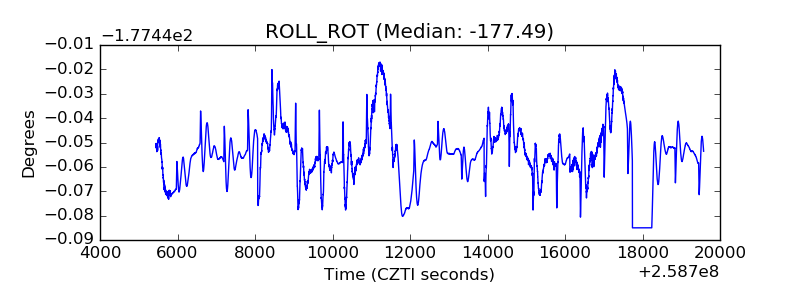 |
| _Roll_DEC | 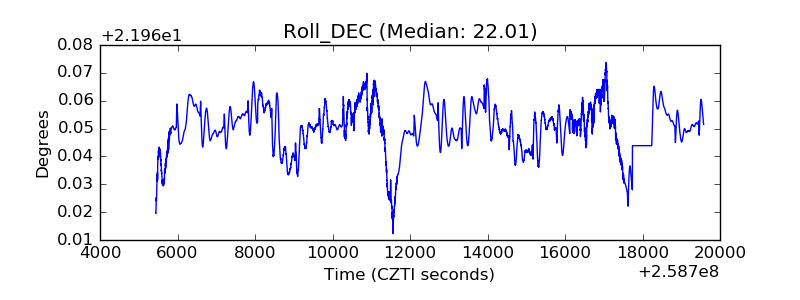 |
| _Roll_RA | 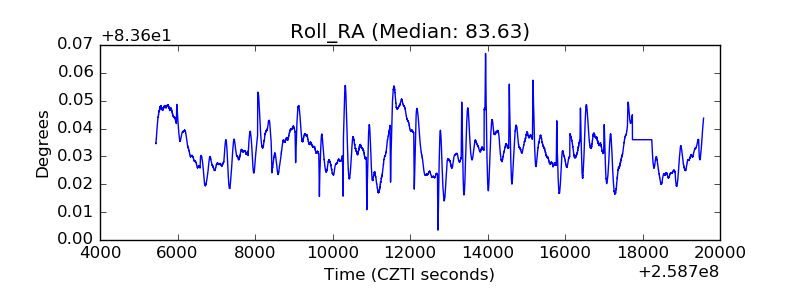 |
| Veto Counter |  |