| Param | Original file | Final file |
|---|---|---|
| Filename | modeM0/AS1T02_013T01_9000001976_13297cztM0_level2.evt | modeM0/AS1T02_013T01_9000001976_13297cztM0_level2_quad_clean.evt |
| Size (bytes) | 199,437,120 | 40,930,560 |
| Size | 190.2 MB | 39.0 MB |
| Events in quadrant A | 1,236,286 | 292,541 |
| Events in quadrant B | 2,078,268 | 224,500 |
| Events in quadrant C | 1,173,577 | 290,391 |
| Events in quadrant D | 1,404,130 | 276,372 |
| Mode SS | |||
|---|---|---|---|
| Quadrant | BADHDUFLAG | Total packets | Discarded packets |
| A | 0 | 42 | 0 |
| B | 0 | 42 | 0 |
| C | 0 | 42 | 0 |
| D | 0 | 42 | 0 |
| Mode M0 | |||
|---|---|---|---|
| Quadrant | BADHDUFLAG | Total packets | Discarded packets |
| A | 0 | 5010 | 0 |
| B | 0 | 7589 | 1 |
| C | 0 | 4872 | 0 |
| D | 0 | 5539 | 0 |
| Quadrant | Total seconds | Saturated seconds | Saturation percentage |
|---|---|---|---|
| A | 2153 | 4 | 0.185787% |
| B | 2128 | 606 | 28.477444% |
| C | 2153 | 29 | 1.346958% |
| D | 2153 | 27 | 1.254064% |
Noise dominated data is calculated using 1-second bins in cleaned event files. If a bin has >2000 counts, and if more than 50% of those come from <1% of pixels, then it is considered to be noise-dominated and hence unusable.
| Quadrant | # 1 sec bins | Bins with >0 counts | Bins with >2000 counts | High rate bins dominated by noise | Noise dominated (total time) | Noise dominated (detector-on time) | Marked lightcurve |
|---|---|---|---|---|---|---|---|
| A | 2154 | 2154 | 0 | 0 | 0.00% | 0.00% | 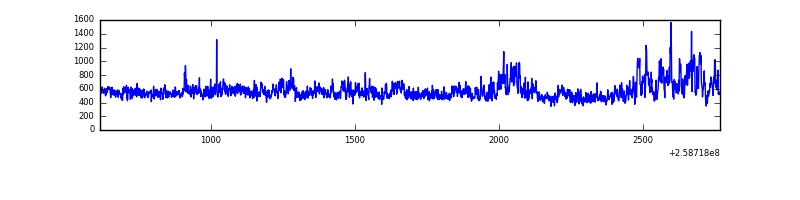 |
| B | 2154 | 2129 | 323 | 323 | 15.00% | 15.17% | 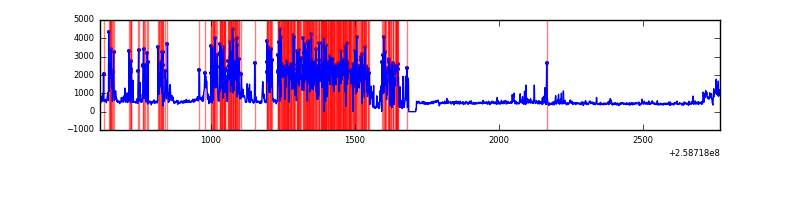 |
| C | 2154 | 2154 | 32 | 32 | 1.49% | 1.49% |  |
| D | 2154 | 2154 | 22 | 22 | 1.02% | 1.02% | 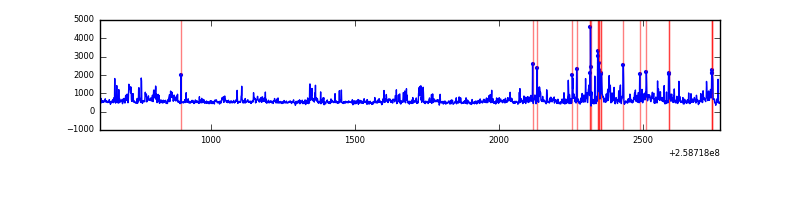 |
Top three noisy pixels from each quadrant. If the there are fewer than three noisy pixels in the level2.evt file, extra rows are filled as -1
| Pixel properties | Quadrant properties | ||||||
|---|---|---|---|---|---|---|---|
| Quadrant | DetID | PixID | Counts | Sigma | Mean | Median | Sigma |
| A | 8 | 15 | 230349 | 4109.21 | 260 | 255 | 56.0 |
| A | 9 | 143 | 2446 | 39.13 | 260 | 255 | 56.0 |
| A | 0 | 226 | 2372 | 37.81 | 260 | 255 | 56.0 |
| B | 4 | 239 | 1201520 | 30773.8 | 196 | 192 | 39.0 |
| B | 0 | 189 | 37878 | 965.38 | 196 | 192 | 39.0 |
| B | 4 | 216 | 25732 | 654.25 | 196 | 192 | 39.0 |
| C | 15 | 208 | 204861 | 3444.61 | 246 | 248 | 59.4 |
| C | 14 | 234 | 3726 | 58.55 | 246 | 248 | 59.4 |
| C | 0 | 207 | 2963 | 45.71 | 246 | 248 | 59.4 |
| D | 1 | 52 | 153298 | 2463.24 | 250 | 243 | 62.1 |
| D | 13 | 249 | 77784 | 1247.93 | 250 | 243 | 62.1 |
| D | 2 | 136 | 58554 | 938.45 | 250 | 243 | 62.1 |
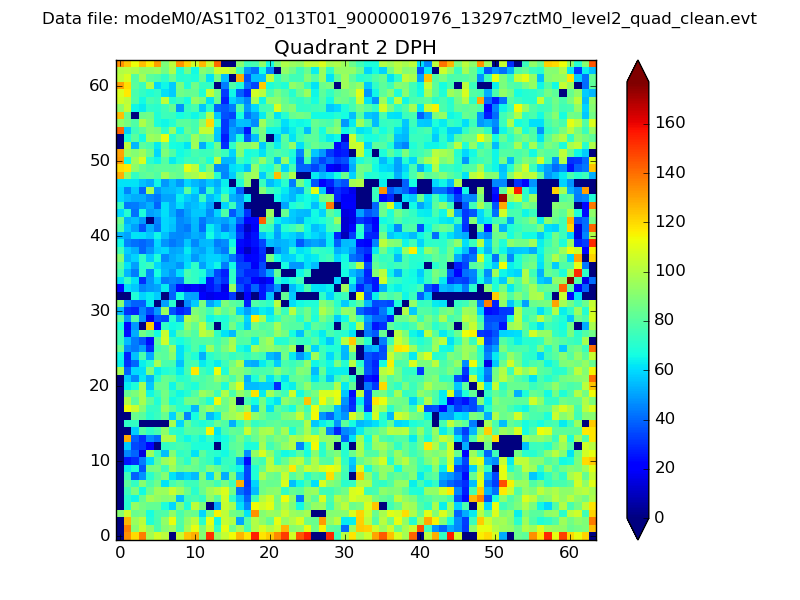
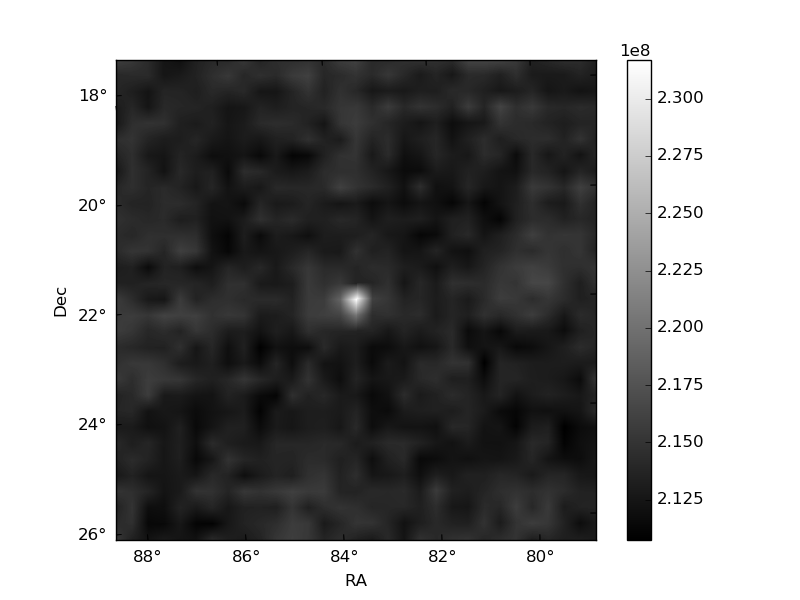
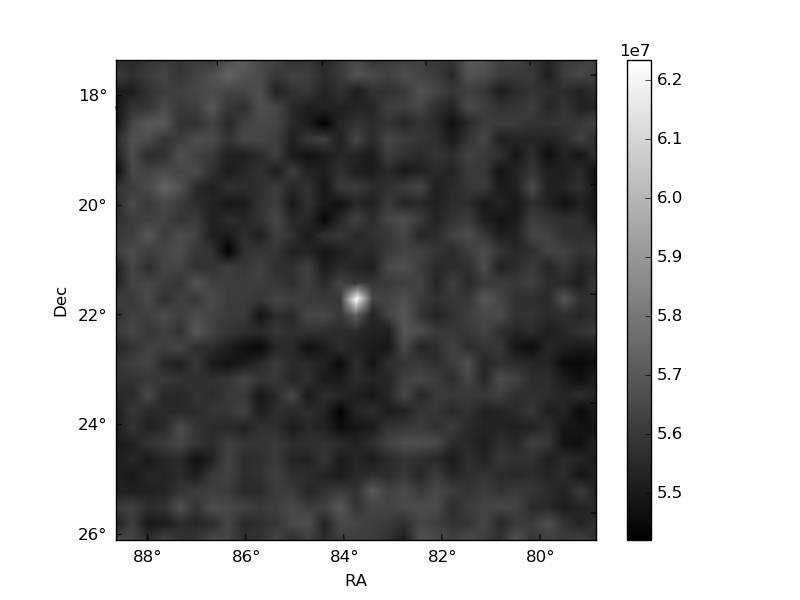
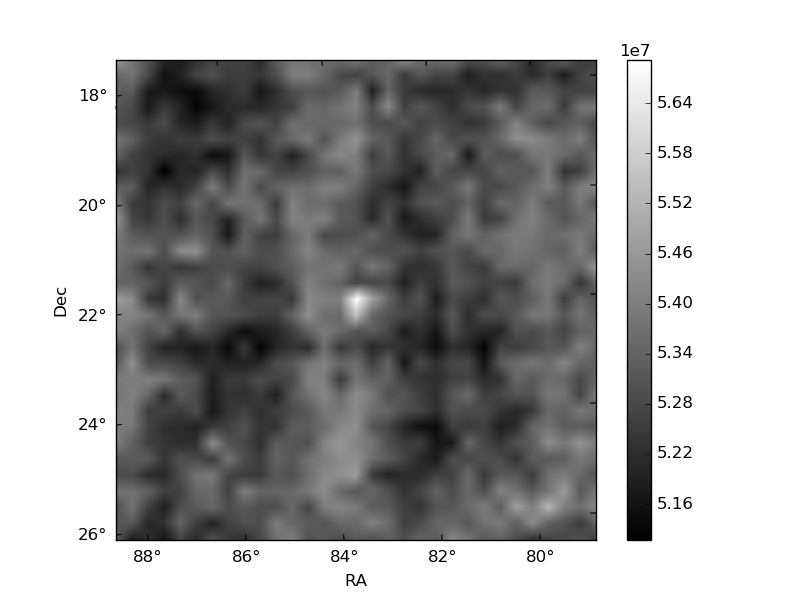
Histogram calculated using DETX and DETY for each event in the final _common_clean file
| Quadrant A | 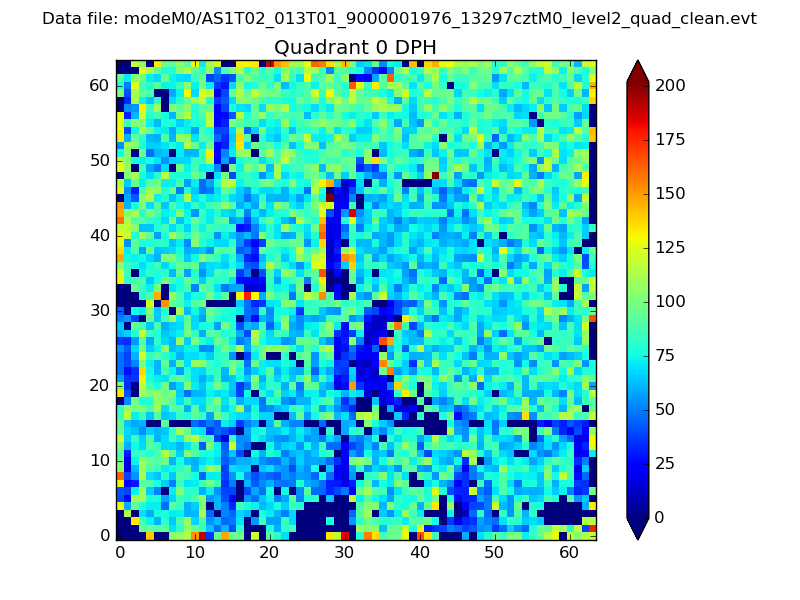 |
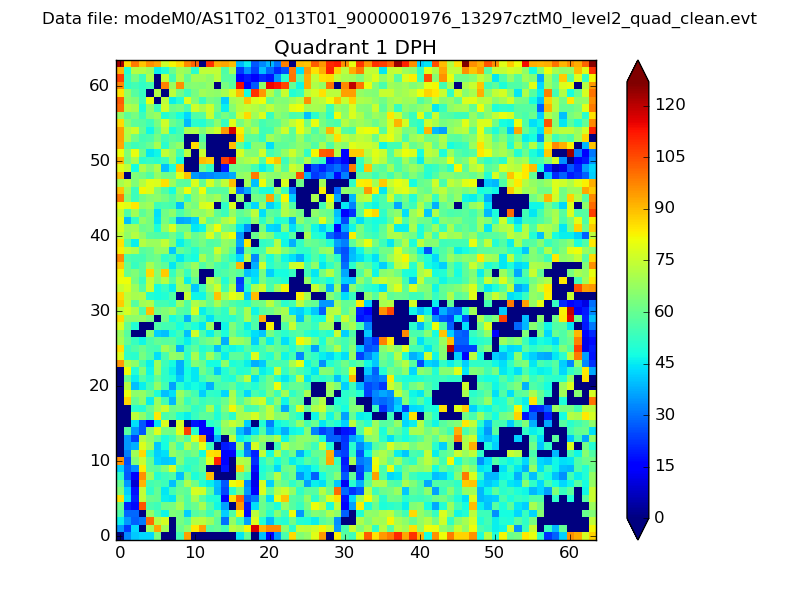 |
Quadrant B |
|---|---|---|---|
| Quadrant D | 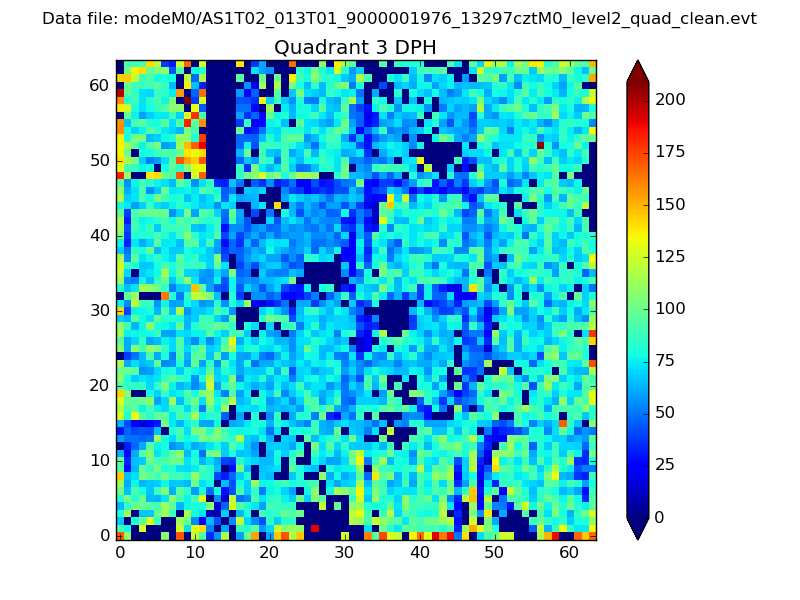 |
 |
Quadrant C |
| Plot type | Count rate plots | Images |
|---|---|---|
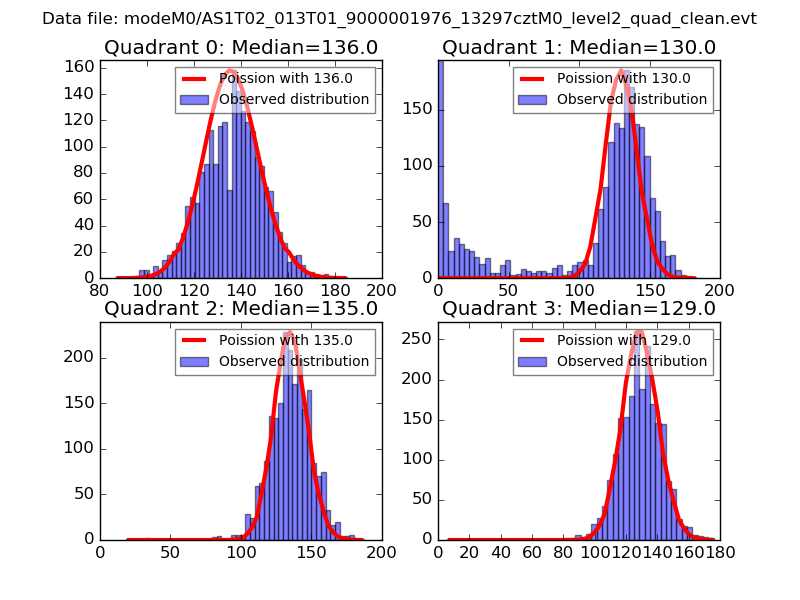
| Comparison with Poisson distribution Blue bars denote a histogram of data divided into 1 sec bins. Red curve is a Poisson curve with rate = median count rate of data. |
 |
 |
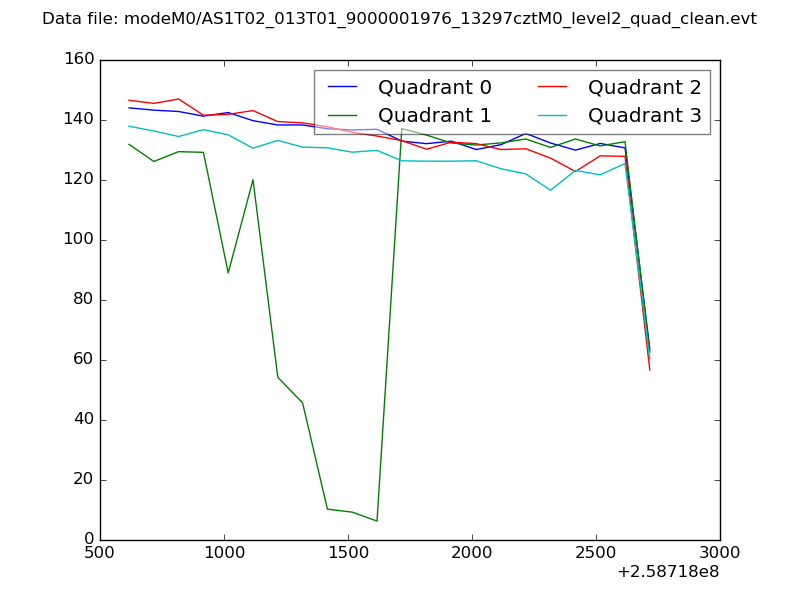
| Quadrant-wise count rates Data is divided into 100 sec bins |
 |
|
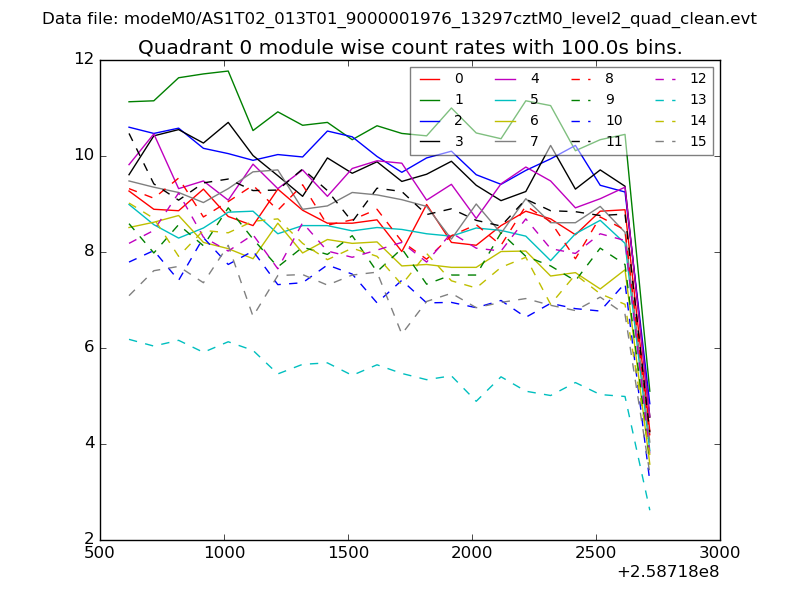
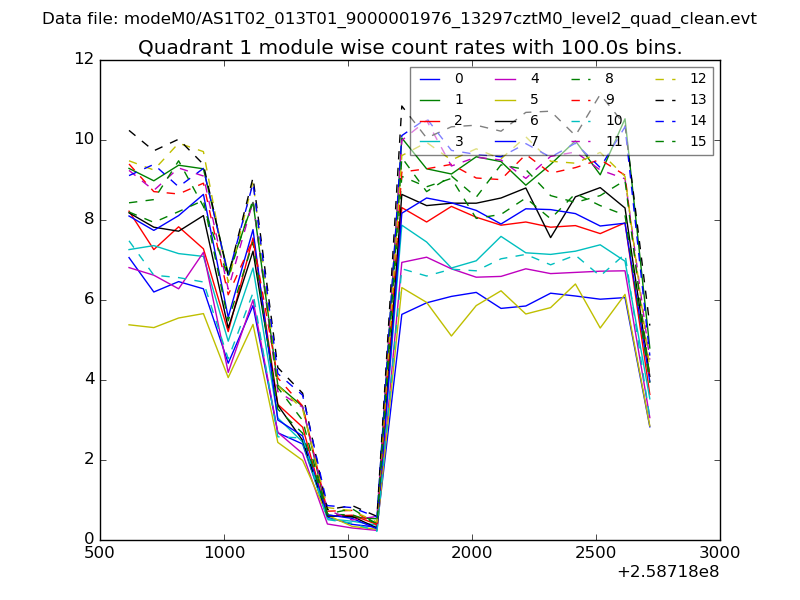
| Module-wise count rates for Quadrant A Data is divided into 100 sec bins |
 |
 |
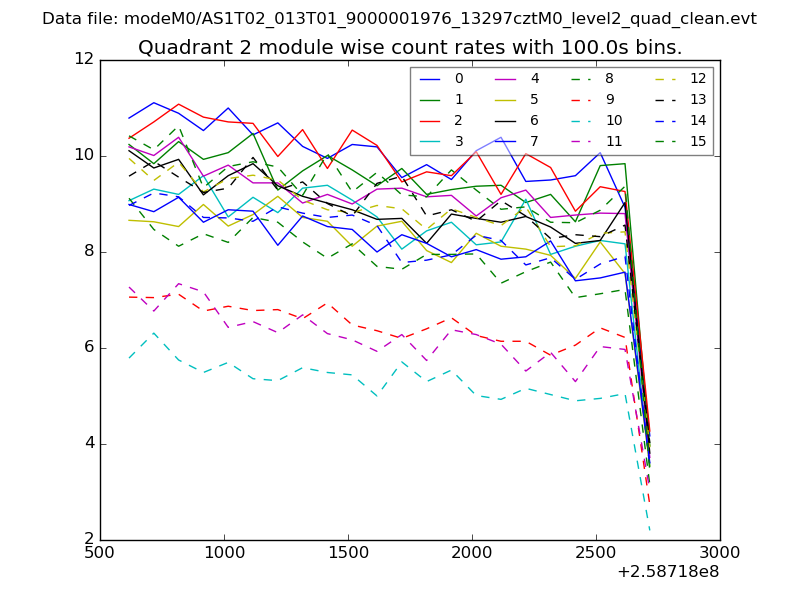
| Module-wise count rates for Quadrant B Data is divided into 100 sec bins |
 |
 |
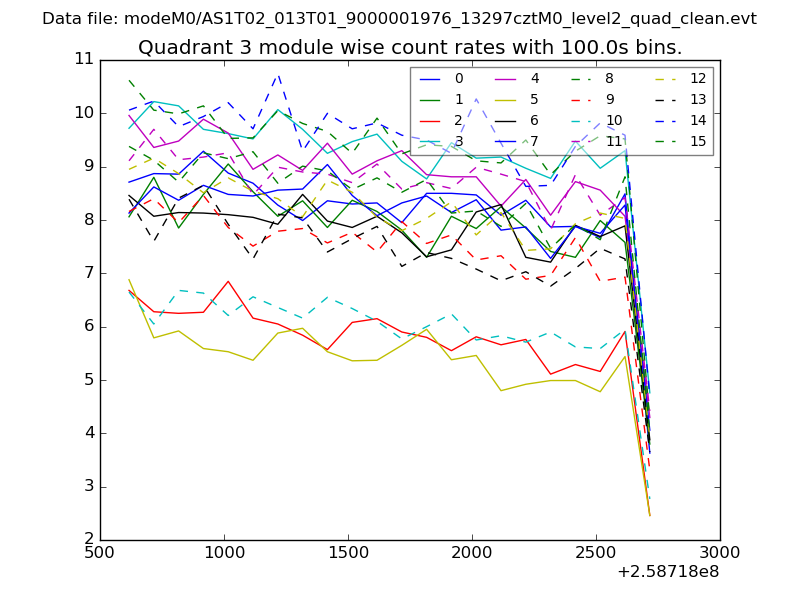
| Module-wise count rates for Quadrant C Data is divided into 100 sec bins |
 |
 |
| Module-wise count rates for Quadrant D Data is divided into 100 sec bins |
 |
 |
| Parameter | Plot |
|---|---|
| CZT HV Monitor |  |
| D_VDD |  |
| Temperature 1 | 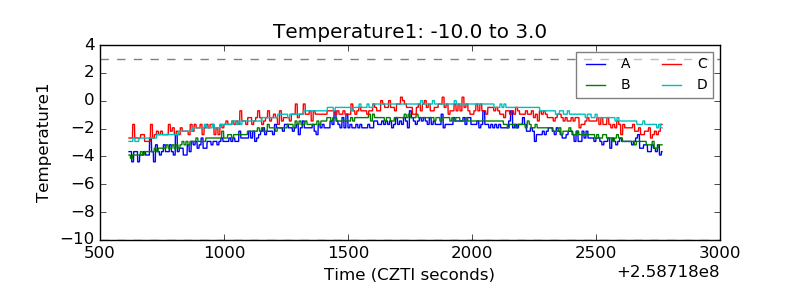 |
| Veto HV Monitor | 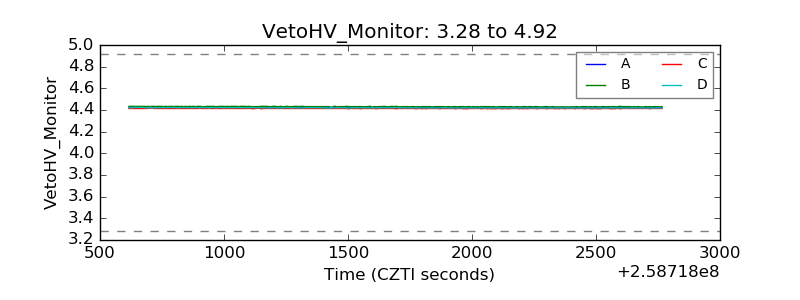 |
| Veto LLD | 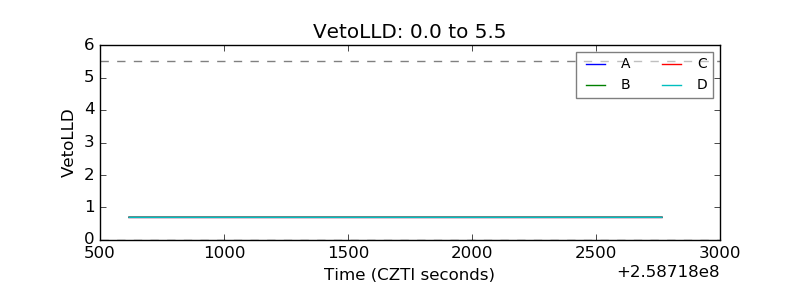 |
| Alpha Counter | 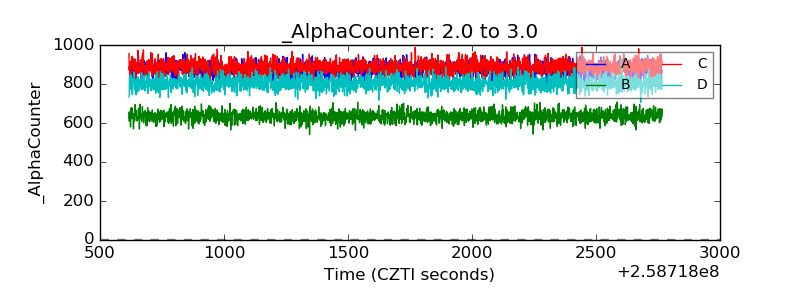 |
| _CPM_Rate | 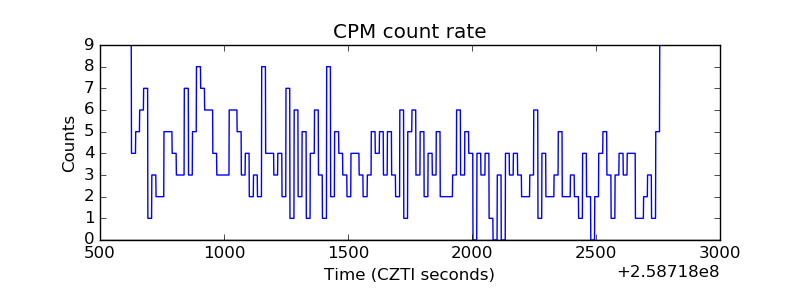 |
| CZT Counter | 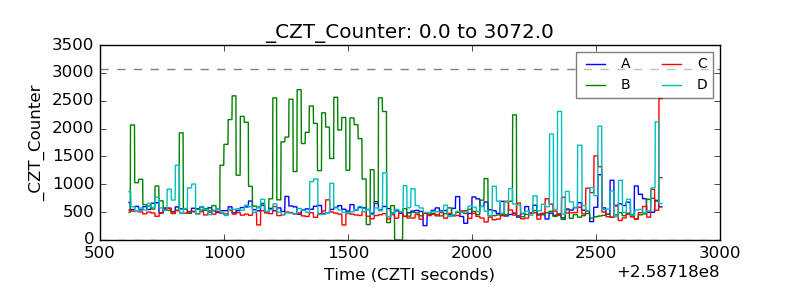 |
| +2.5 Volts monitor |  |
| +5 Volts monitor |  |
| _ROLL_ROT | 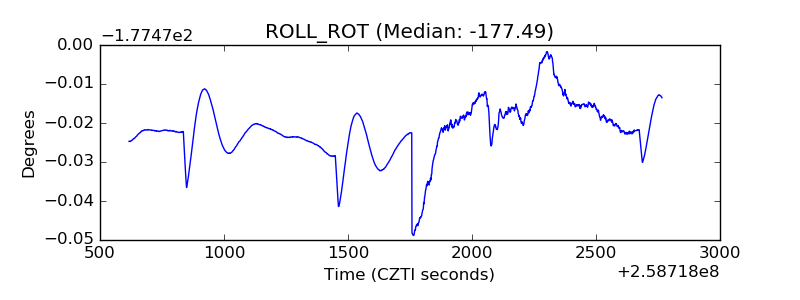 |
| _Roll_DEC | 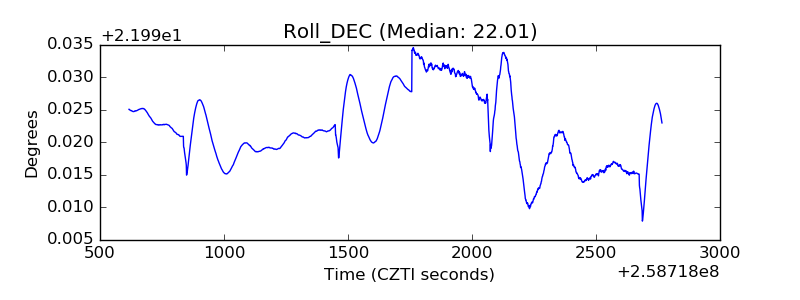 |
| _Roll_RA | 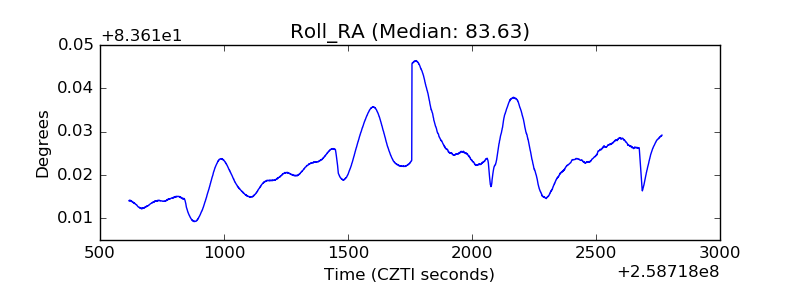 |
| Veto Counter | 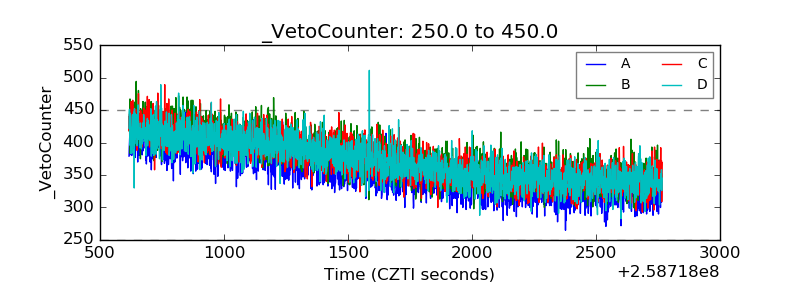 |