| Param | Original file | Final file |
|---|---|---|
| Filename | modeM0/AS1G08_023T01_9000001978cztM0_level2.fits | modeM0/AS1G08_023T01_9000001978cztM0_level2_quad_clean.evt |
| Size (bytes) | 773,769,600 | 807,111,360 |
| Size | 737.9 MB | 769.7 MB |
| Events in quadrant A | 4,687,240 | 4,927,493 |
| Events in quadrant B | 4,584,286 | 4,990,253 |
| Events in quadrant C | 4,619,994 | 4,694,337 |
| Events in quadrant D | 3,965,078 | 4,256,703 |
| Mode M0 | |||
|---|---|---|---|
| Quadrant | BADHDUFLAG | Total packets | Discarded packets |
| A | 0 | 176880 | 0 |
| B | 0 | 176679 | 0 |
| C | 0 | 169411 | 0 |
| D | 0 | 193307 | 0 |
| Mode SS | |||
|---|---|---|---|
| Quadrant | BADHDUFLAG | Total packets | Discarded packets |
| A | 0 | 1658 | 0 |
| B | 0 | 1658 | 0 |
| C | 0 | 1658 | 0 |
| D | 0 | 1658 | 0 |
| Mode M9 | |||
|---|---|---|---|
| Quadrant | BADHDUFLAG | Total packets | Discarded packets |
| A | 0 | 126 | 0 |
| B | 0 | 126 | 0 |
| C | 0 | 126 | 0 |
| D | 0 | 126 | 0 |
| Quadrant | Total seconds | Saturated seconds | Saturation percentage |
|---|---|---|---|
| A | 81327 | 1484 | 1.824732% |
| B | 81327 | 1560 | 1.918182% |
| C | 81327 | 839 | 1.031638% |
| D | 81327 | 2536 | 3.118276% |
Noise dominated data is calculated using 1-second bins in cleaned event files. If a bin has >2000 counts, and if more than 50% of those come from <1% of pixels, then it is considered to be noise-dominated and hence unusable.
| Quadrant | # 1 sec bins | Bins with >0 counts | Bins with >2000 counts | High rate bins dominated by noise | Noise dominated (total time) | Noise dominated (detector-on time) | Marked lightcurve |
|---|---|---|---|---|---|---|---|
| A | 94017 | 81309 | 0 | 0 | 0.00% | 0.00% | 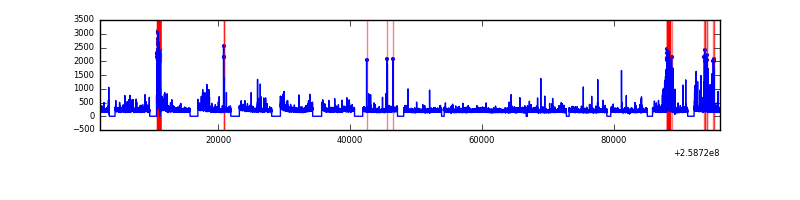 |
| B | 94017 | 81318 | 0 | 0 | 0.00% | 0.00% | 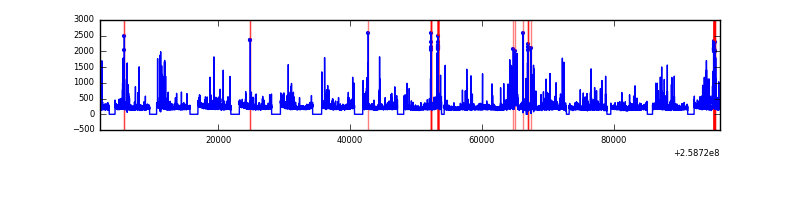 |
| C | 94017 | 81327 | 0 | 0 | 0.00% | 0.00% | 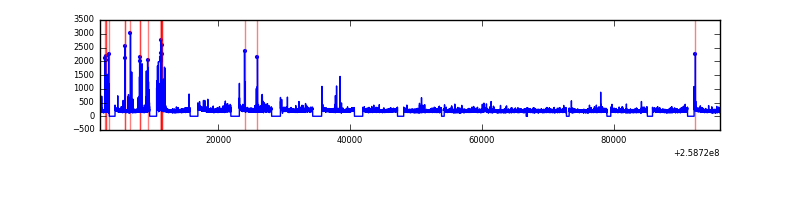 |
| D | 94017 | 81318 | 0 | 0 | 0.00% | 0.00% | 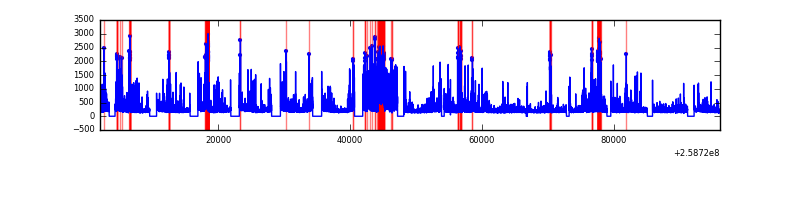 |
Top three noisy pixels from each quadrant. If the there are fewer than three noisy pixels in the level2.evt file, extra rows are filled as -1
| Pixel properties | Quadrant properties | ||||||
|---|---|---|---|---|---|---|---|
| Quadrant | DetID | PixID | Counts | Sigma | Mean | Median | Sigma |
| A | 0 | 29 | 4528 | 11.13 | 1217 | 1141 | 304.2 |
| A | 7 | 110 | 3791 | 8.71 | 1217 | 1141 | 304.2 |
| A | 9 | 19 | 3411 | 7.46 | 1217 | 1141 | 304.2 |
| B | 2 | 9 | 3983 | 12.19 | 1207 | 1151 | 232.3 |
| B | 2 | 8 | 3064 | 8.24 | 1207 | 1151 | 232.3 |
| B | 5 | 128 | 3064 | 8.24 | 1207 | 1151 | 232.3 |
| C | 12 | 241 | 3281 | 6.83 | 1221 | 1136 | 314.2 |
| C | 2 | 191 | 3006 | 5.95 | 1221 | 1136 | 314.2 |
| C | 3 | 126 | 3004 | 5.94 | 1221 | 1136 | 314.2 |
| D | 6 | 231 | 2925 | 6.22 | 1131 | 1028 | 305.2 |
| D | 3 | 14 | 2849 | 5.97 | 1131 | 1028 | 305.2 |
| D | 6 | 67 | 2791 | 5.78 | 1131 | 1028 | 305.2 |
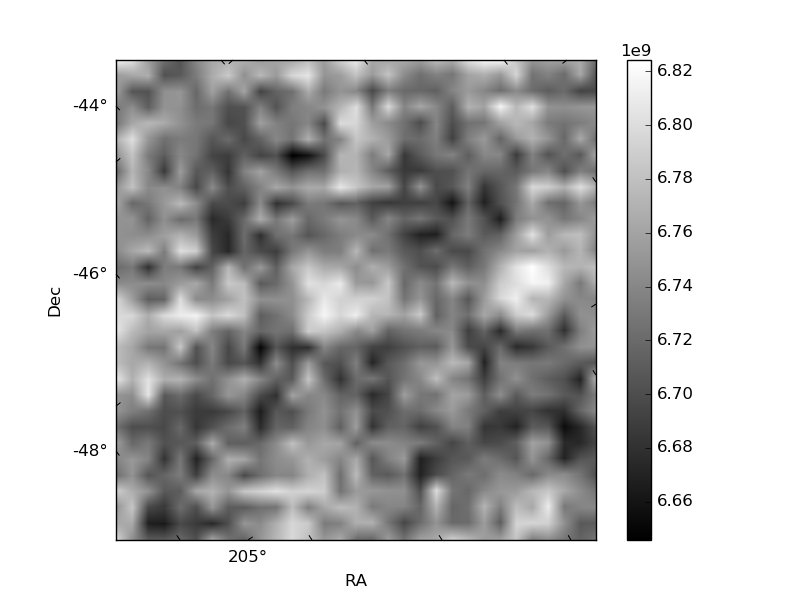
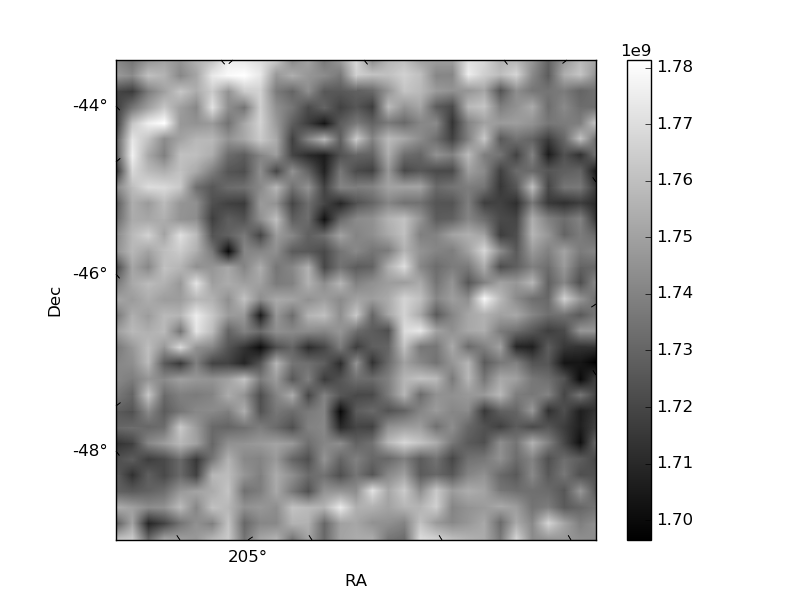
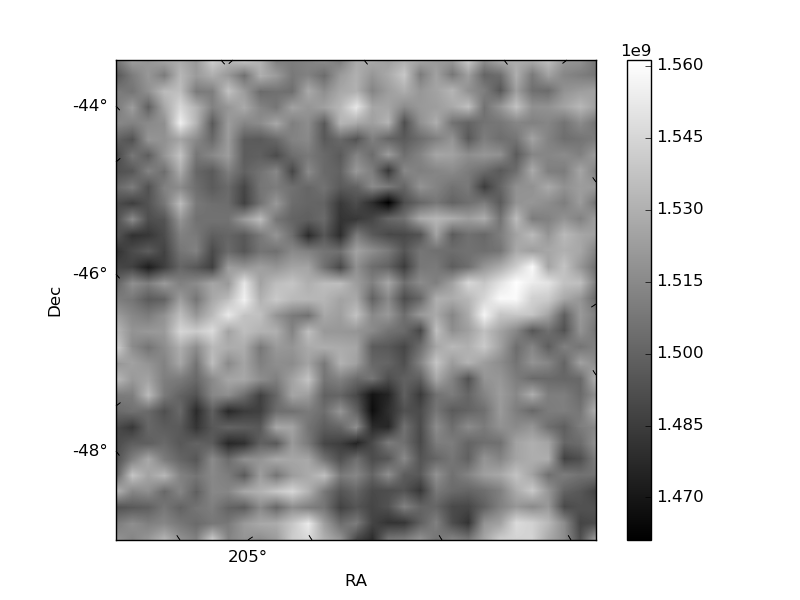
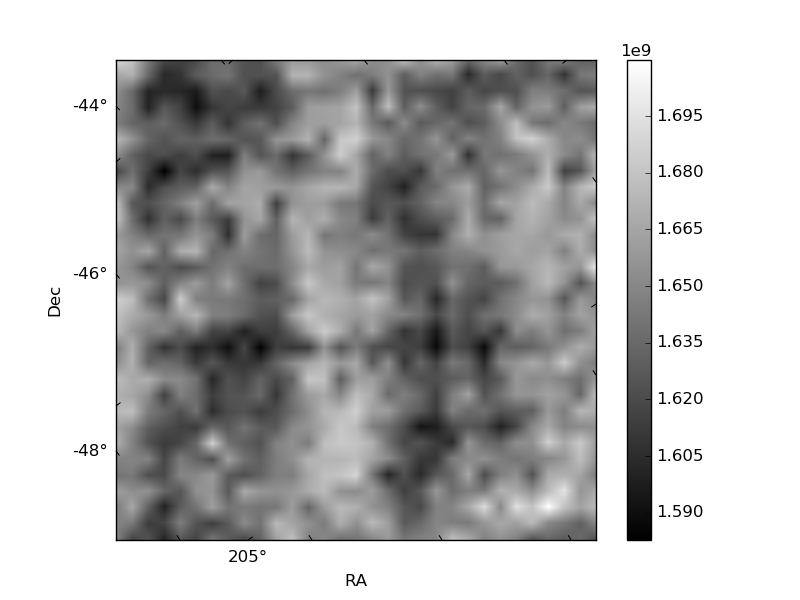
Histogram calculated using DETX and DETY for each event in the final _common_clean file
| Quadrant A | 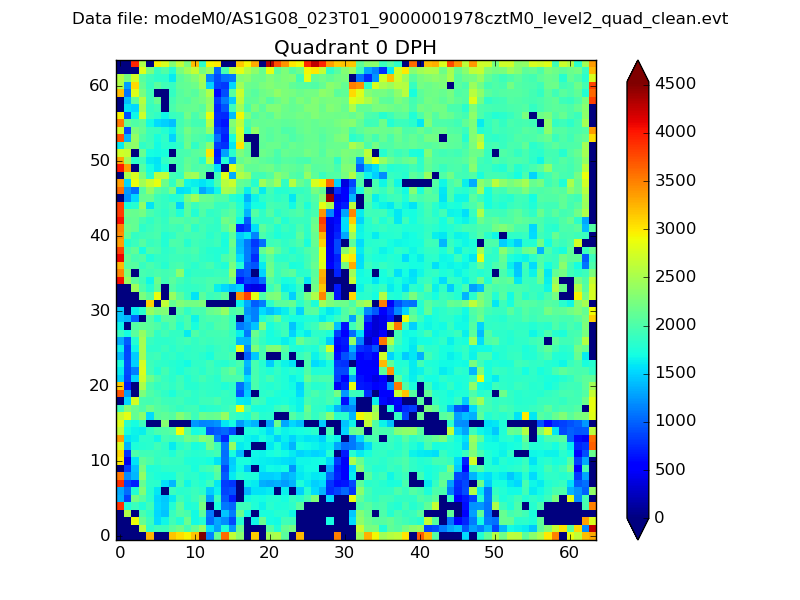 |
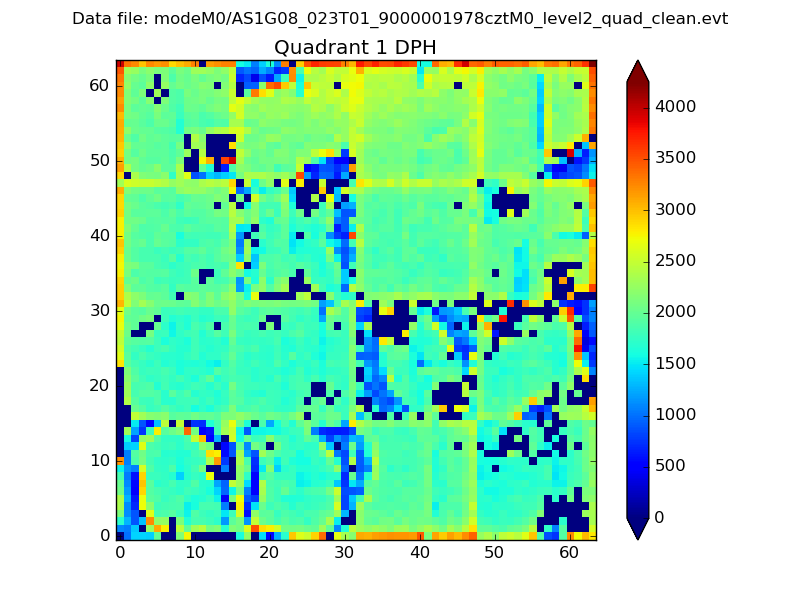 |
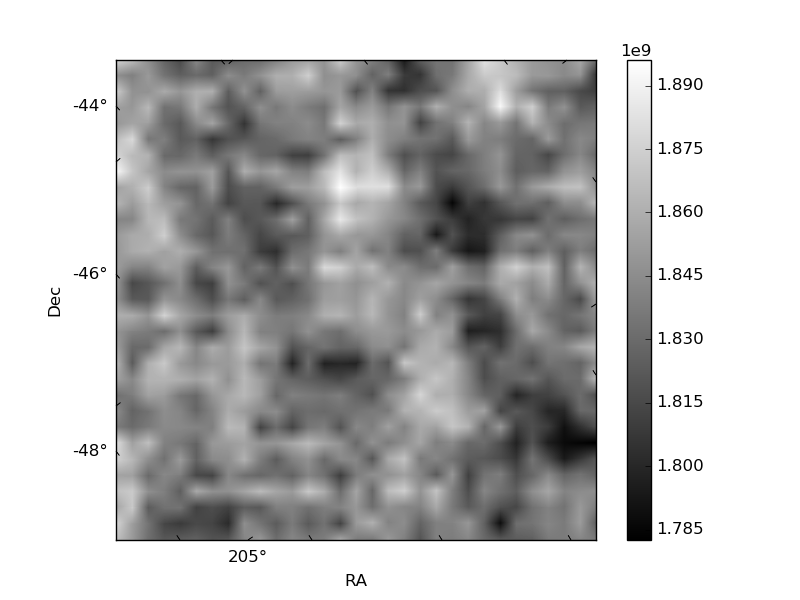
Quadrant B |
|---|---|---|---|
| Quadrant D | 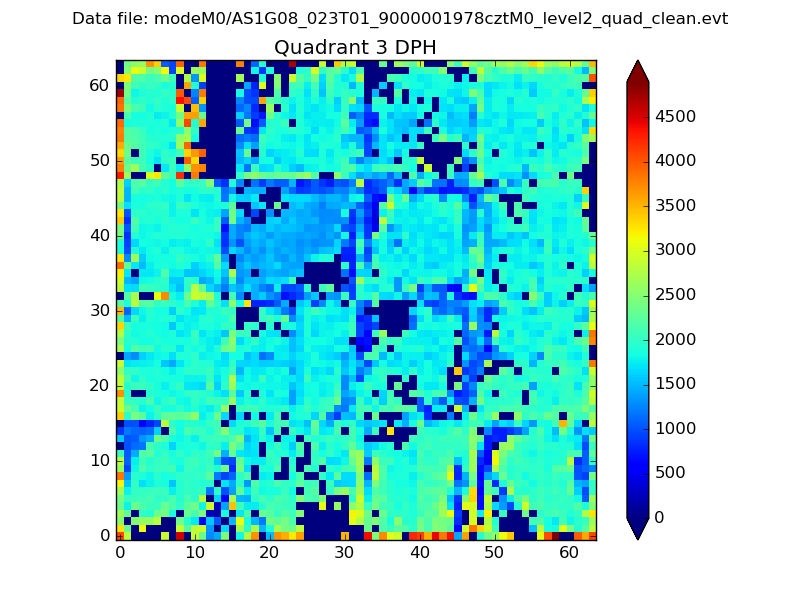 |
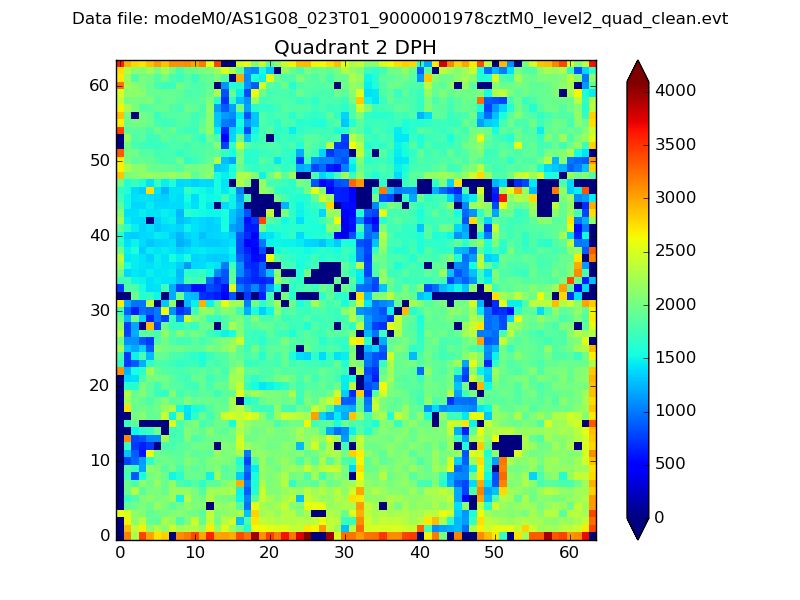 |
Quadrant C |
| Plot type | Count rate plots | Images |
|---|---|---|
| Comparison with Poisson distribution Blue bars denote a histogram of data divided into 1 sec bins. Red curve is a Poisson curve with rate = median count rate of data. |
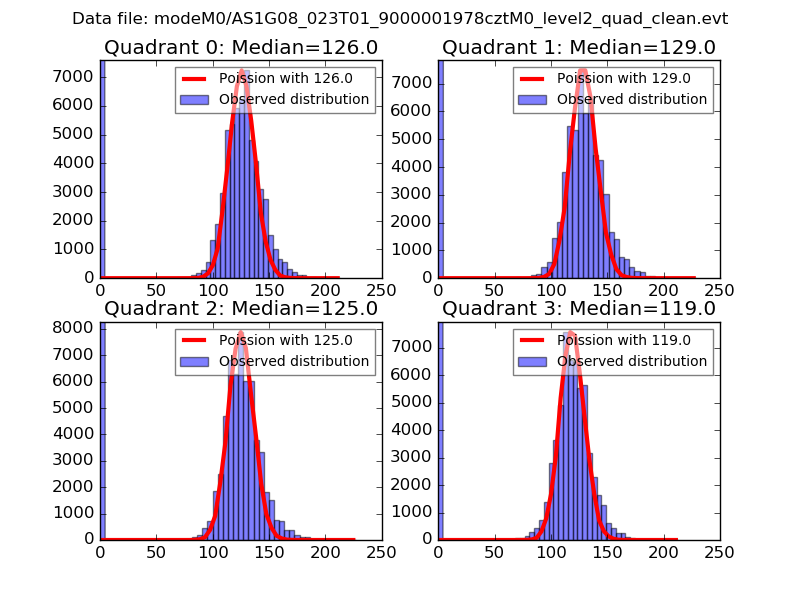 |
 |
| Quadrant-wise count rates Data is divided into 100 sec bins |
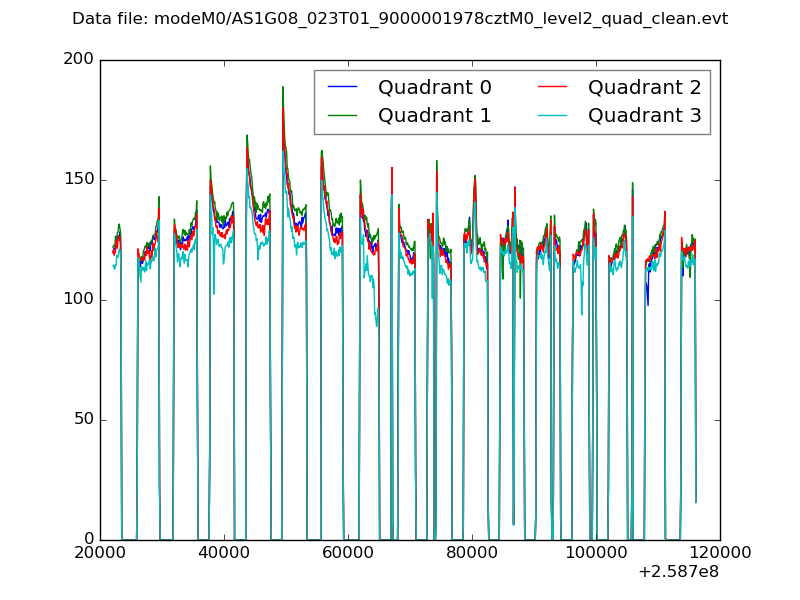 |
|
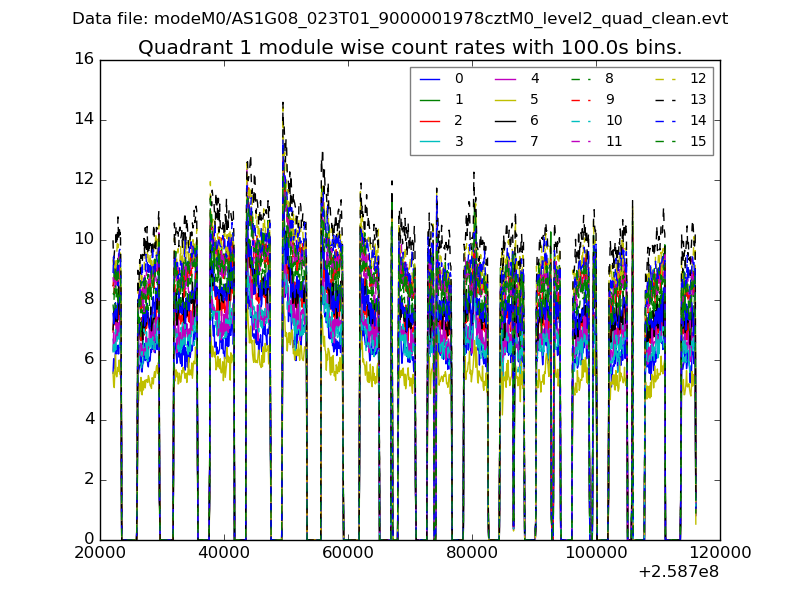
| Module-wise count rates for Quadrant A Data is divided into 100 sec bins |
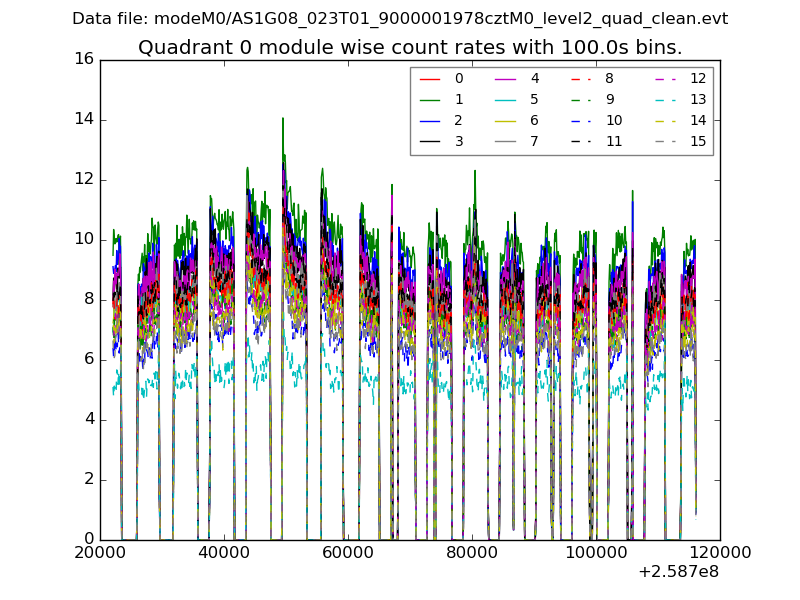 |
 |
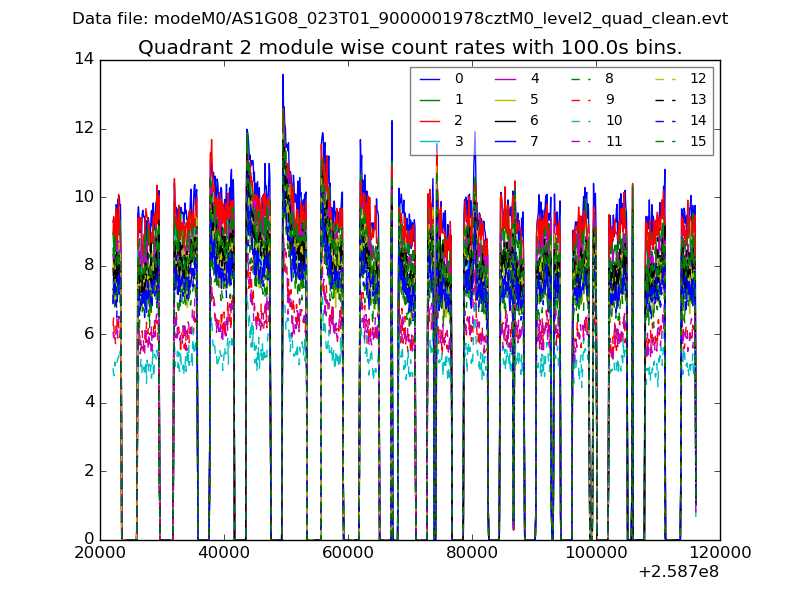
| Module-wise count rates for Quadrant B Data is divided into 100 sec bins |
 |
 |
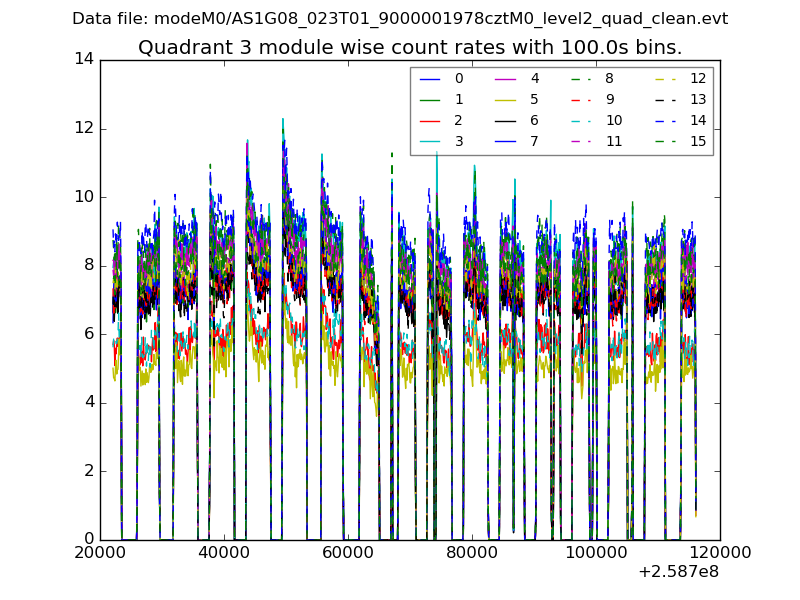
| Module-wise count rates for Quadrant C Data is divided into 100 sec bins |
 |
 |
| Module-wise count rates for Quadrant D Data is divided into 100 sec bins |
 |
 |
| Parameter | Plot |
|---|---|
| CZT HV Monitor | 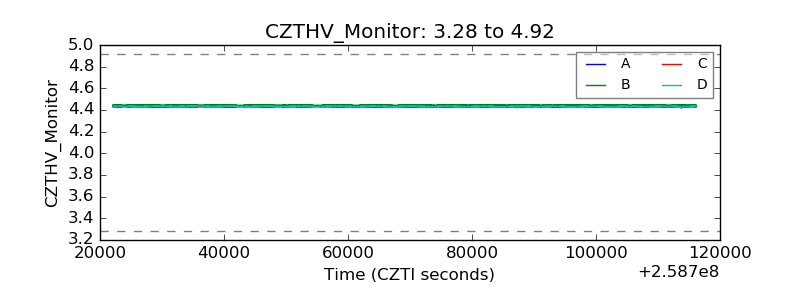 |
| D_VDD | 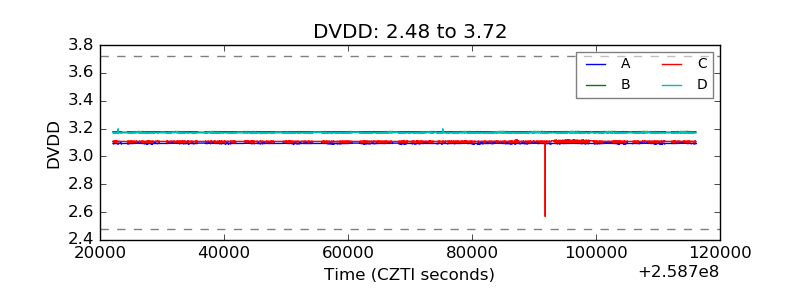 |
| Temperature 1 | 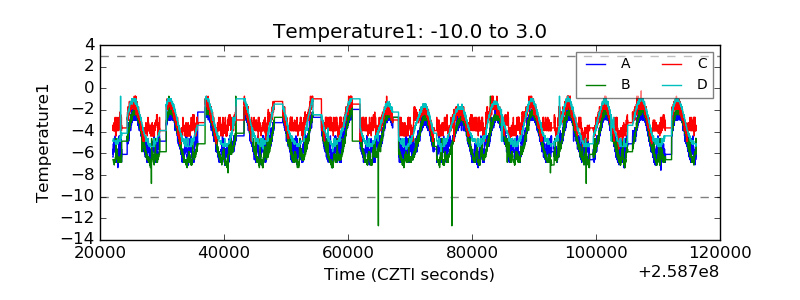 |
| Veto HV Monitor | 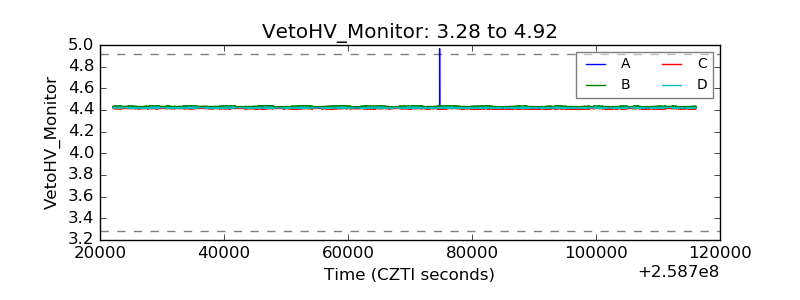 |
| Veto LLD | 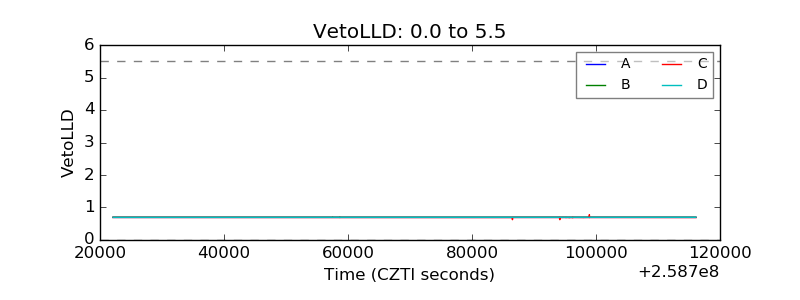 |
| Alpha Counter | 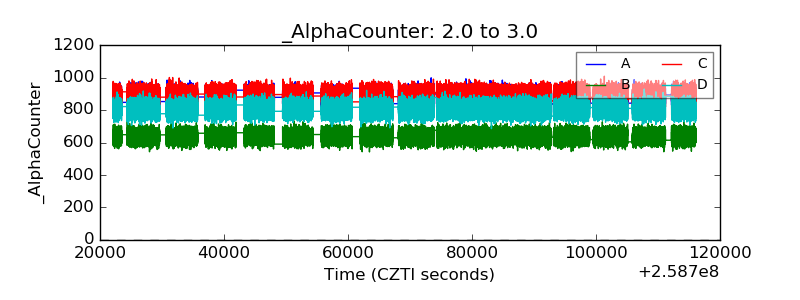 |
| _CPM_Rate | 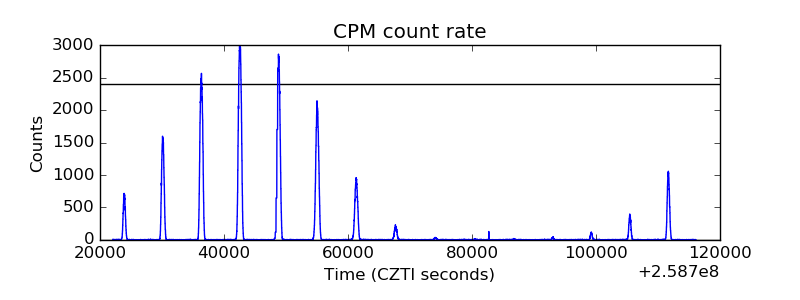 |
| CZT Counter | 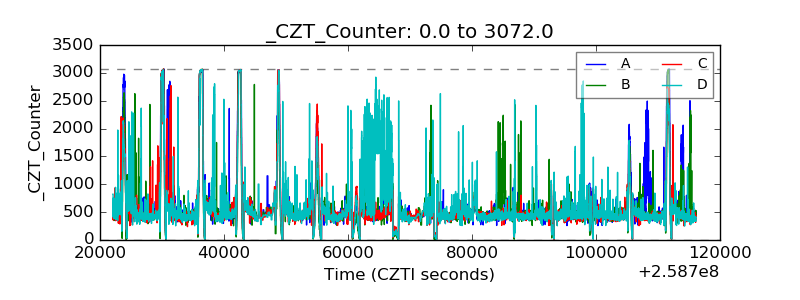 |
| +2.5 Volts monitor | 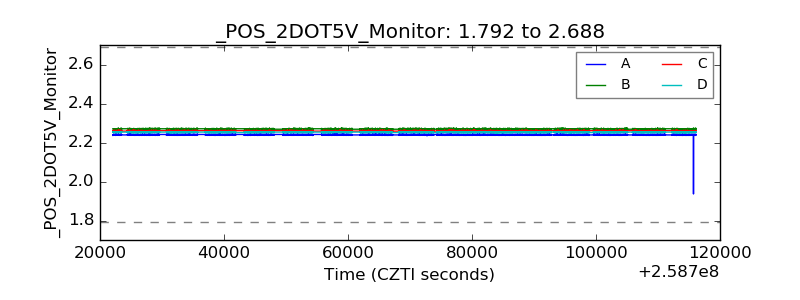 |
| +5 Volts monitor | 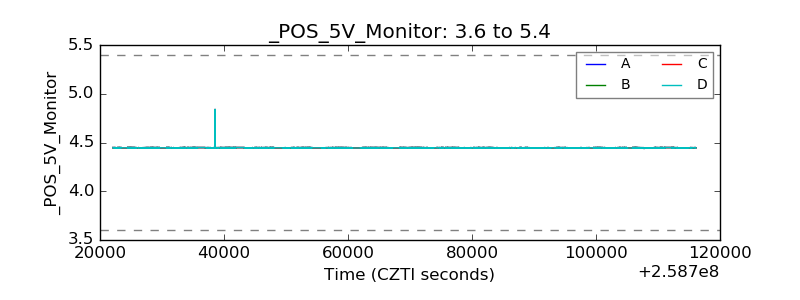 |
| _ROLL_ROT | 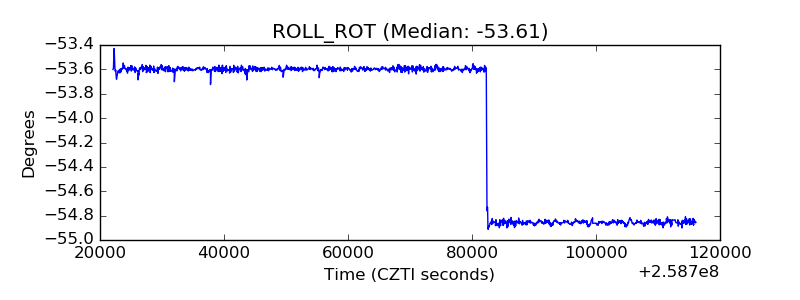 |
| _Roll_DEC | 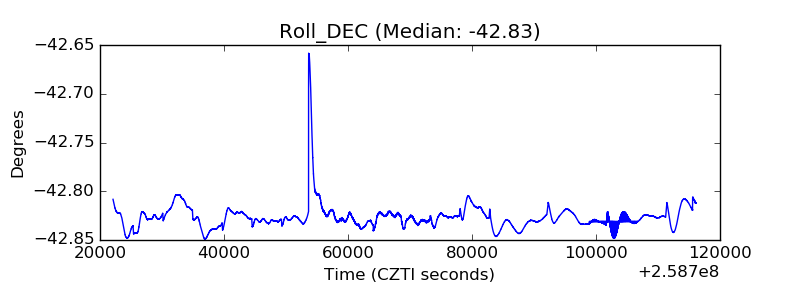 |
| _Roll_RA | 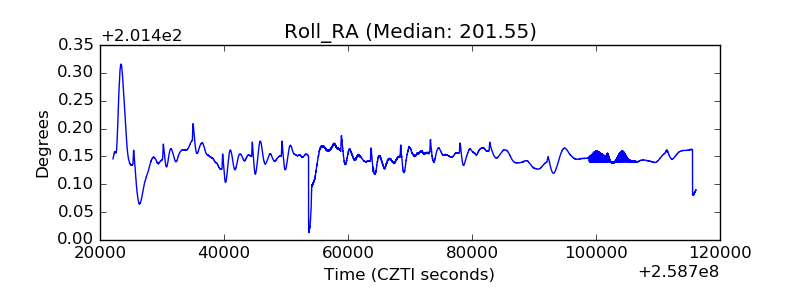 |
| Veto Counter | 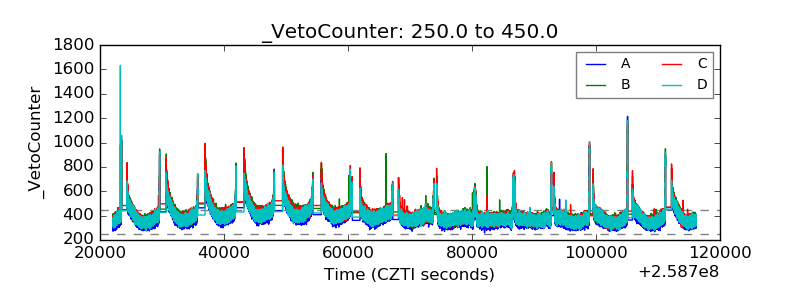 |