| Param | Original file | Final file |
|---|---|---|
| Filename | modeM0/AS1G08_023T01_9000001978_13297cztM0_level2.evt | modeM0/AS1G08_023T01_9000001978_13297cztM0_level2_quad_clean.evt |
| Size (bytes) | 632,021,760 | 105,387,840 |
| Size | 602.7 MB | 100.5 MB |
| Events in quadrant A | 5,070,199 | 658,199 |
| Events in quadrant B | 4,323,402 | 669,349 |
| Events in quadrant C | 4,525,365 | 655,126 |
| Events in quadrant D | 4,657,623 | 630,851 |
| Mode M0 | |||
|---|---|---|---|
| Quadrant | BADHDUFLAG | Total packets | Discarded packets |
| A | 0 | 20443 | 3 |
| B | 0 | 18263 | 2 |
| C | 0 | 19229 | 2 |
| D | 0 | 19555 | 2 |
| Mode SS | |||
|---|---|---|---|
| Quadrant | BADHDUFLAG | Total packets | Discarded packets |
| A | 0 | 170 | 0 |
| B | 0 | 170 | 0 |
| C | 0 | 170 | 0 |
| D | 0 | 170 | 0 |
| Mode M9 | |||
|---|---|---|---|
| Quadrant | BADHDUFLAG | Total packets | Discarded packets |
| A | 0 | 19 | 0 |
| B | 0 | 19 | 0 |
| C | 0 | 19 | 0 |
| D | 0 | 19 | 0 |
| Quadrant | Total seconds | Saturated seconds | Saturation percentage |
|---|---|---|---|
| A | 8323 | 526 | 6.319837% |
| B | 8323 | 180 | 2.162682% |
| C | 8323 | 168 | 2.018503% |
| D | 8323 | 193 | 2.318875% |
Noise dominated data is calculated using 1-second bins in cleaned event files. If a bin has >2000 counts, and if more than 50% of those come from <1% of pixels, then it is considered to be noise-dominated and hence unusable.
| Quadrant | # 1 sec bins | Bins with >0 counts | Bins with >2000 counts | High rate bins dominated by noise | Noise dominated (total time) | Noise dominated (detector-on time) | Marked lightcurve |
|---|---|---|---|---|---|---|---|
| A | 10264 | 8326 | 293 | 293 | 2.85% | 3.52% | 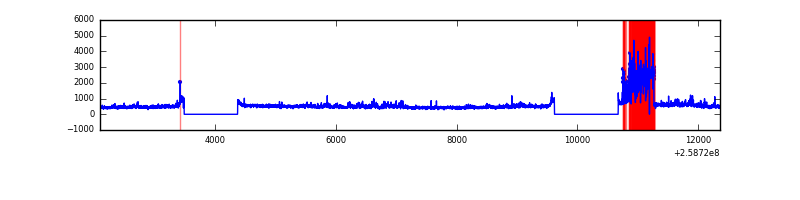 |
| B | 10264 | 8326 | 35 | 35 | 0.34% | 0.42% | 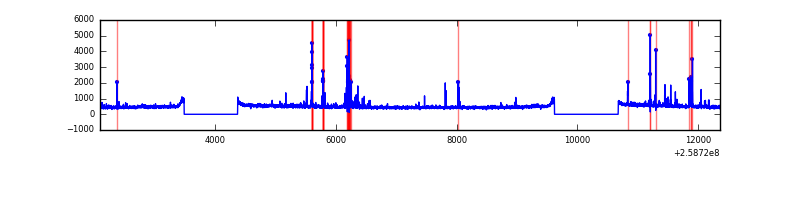 |
| C | 10264 | 8326 | 50 | 50 | 0.49% | 0.60% | 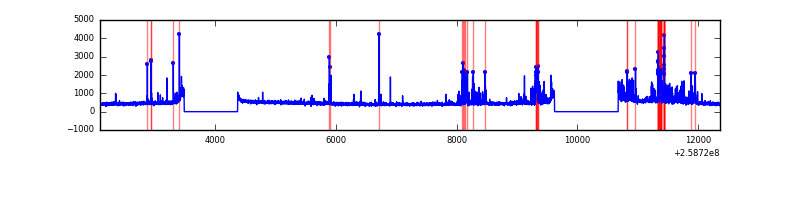 |
| D | 10264 | 8326 | 81 | 81 | 0.79% | 0.97% | 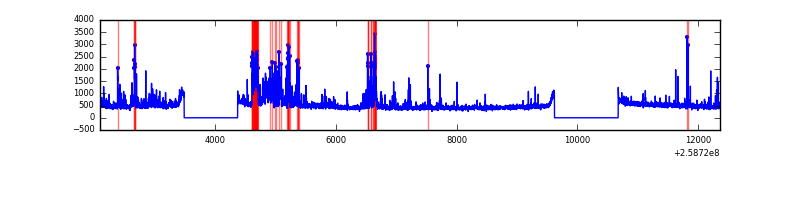 |
Top three noisy pixels from each quadrant. If the there are fewer than three noisy pixels in the level2.evt file, extra rows are filled as -1
| Pixel properties | Quadrant properties | ||||||
|---|---|---|---|---|---|---|---|
| Quadrant | DetID | PixID | Counts | Sigma | Mean | Median | Sigma |
| A | 9 | 143 | 883235 | 4424.38 | 986 | 965 | 199.4 |
| A | 8 | 15 | 359056 | 1795.74 | 986 | 965 | 199.4 |
| A | 1 | 162 | 20817 | 99.55 | 986 | 965 | 199.4 |
| B | 0 | 189 | 112002 | 573.45 | 1018 | 993 | 193.6 |
| B | 3 | 64 | 97188 | 496.93 | 1018 | 993 | 193.6 |
| B | 4 | 142 | 76267 | 388.85 | 1018 | 993 | 193.6 |
| C | 6 | 96 | 629349 | 2762.72 | 987 | 992 | 227.4 |
| C | 15 | 208 | 38280 | 163.95 | 987 | 992 | 227.4 |
| C | 14 | 234 | 8340 | 32.31 | 987 | 992 | 227.4 |
| D | 1 | 52 | 290409 | 1227.53 | 981 | 952 | 235.8 |
| D | 5 | 222 | 246490 | 1041.28 | 981 | 952 | 235.8 |
| D | 12 | 222 | 159508 | 672.41 | 981 | 952 | 235.8 |
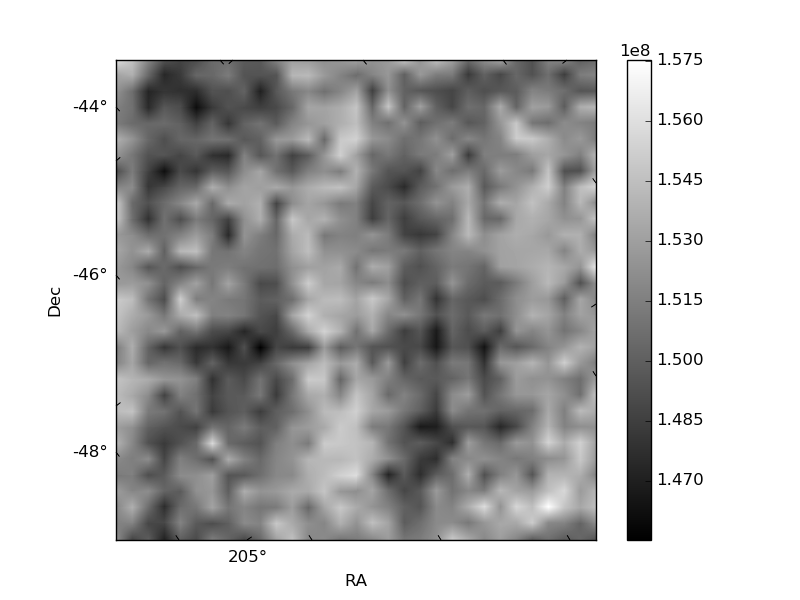
Histogram calculated using DETX and DETY for each event in the final _common_clean file
| Quadrant A | 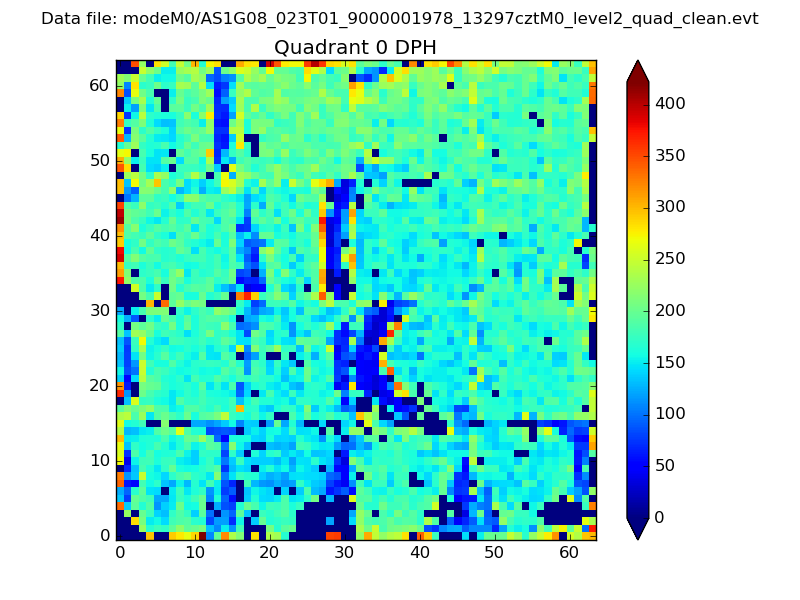 |
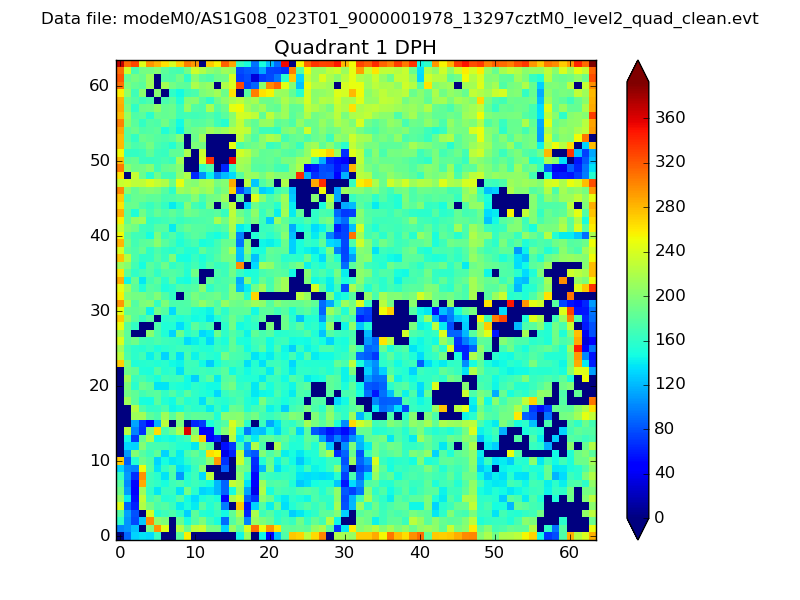 |
Quadrant B |
|---|---|---|---|
| Quadrant D | 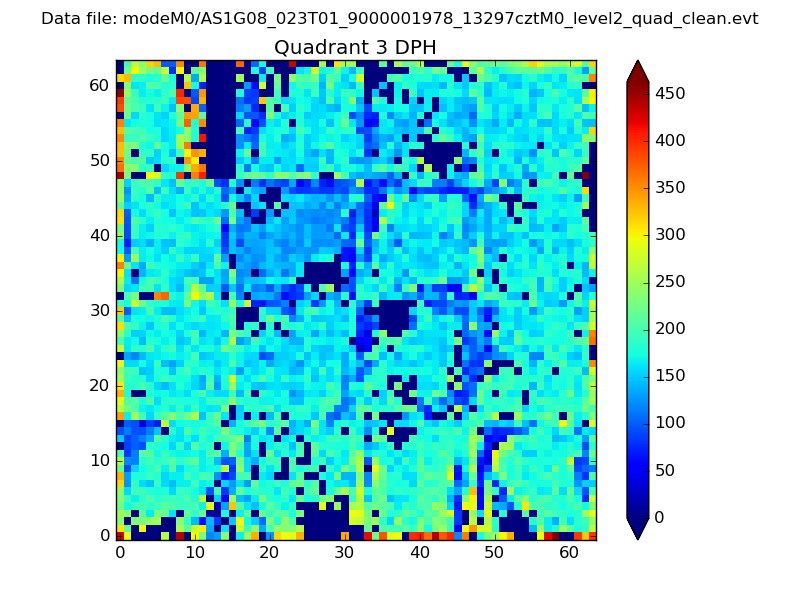 |
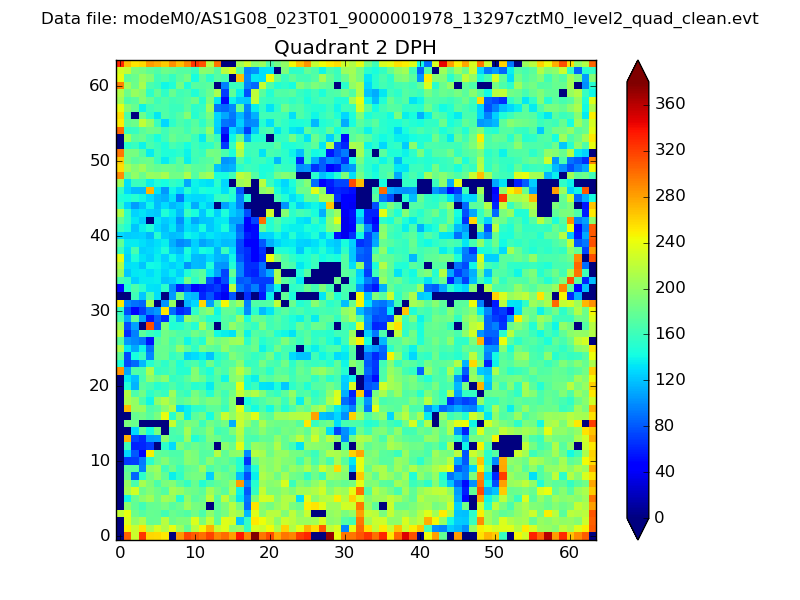 |
Quadrant C |
| Plot type | Count rate plots | Images |
|---|---|---|
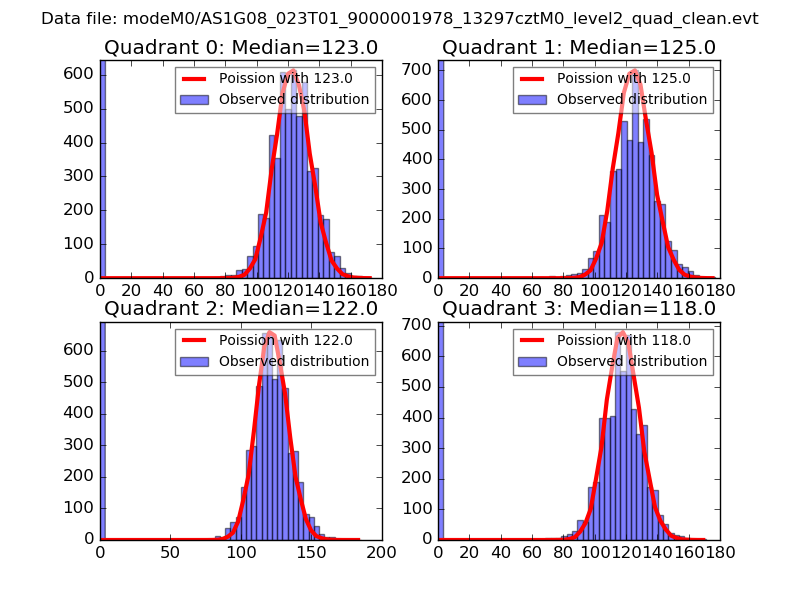
| Comparison with Poisson distribution Blue bars denote a histogram of data divided into 1 sec bins. Red curve is a Poisson curve with rate = median count rate of data. |
 |
 |
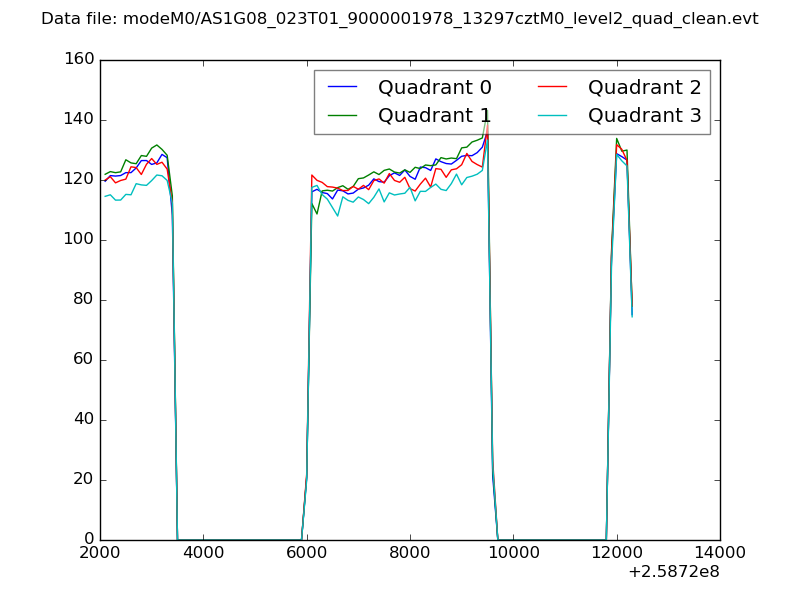
| Quadrant-wise count rates Data is divided into 100 sec bins |
 |
|
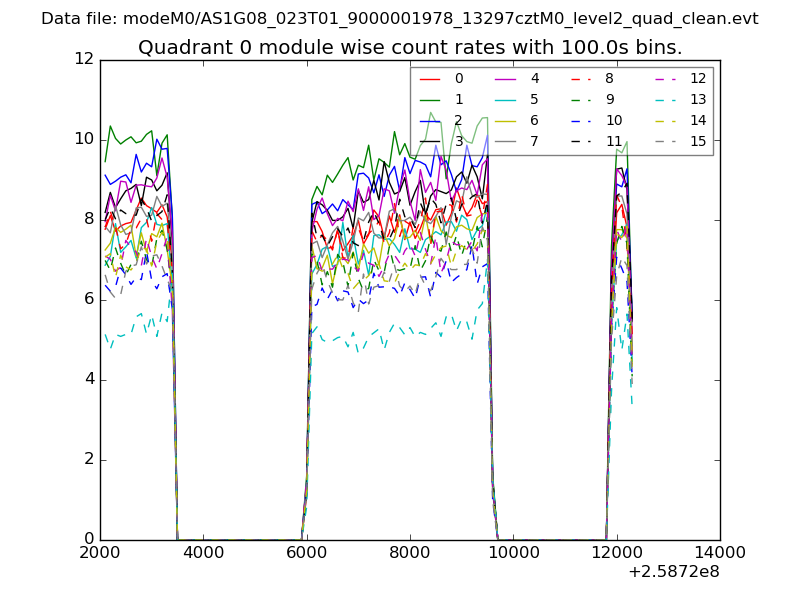
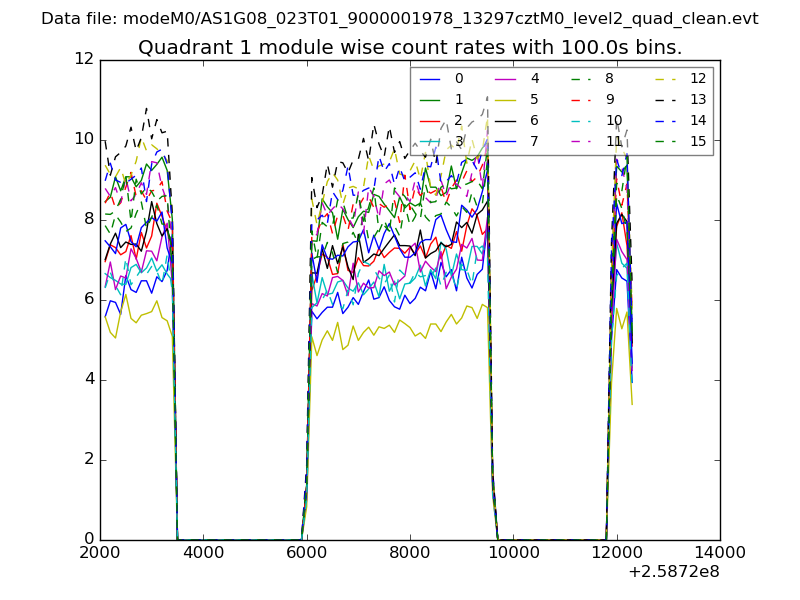
| Module-wise count rates for Quadrant A Data is divided into 100 sec bins |
 |
 |
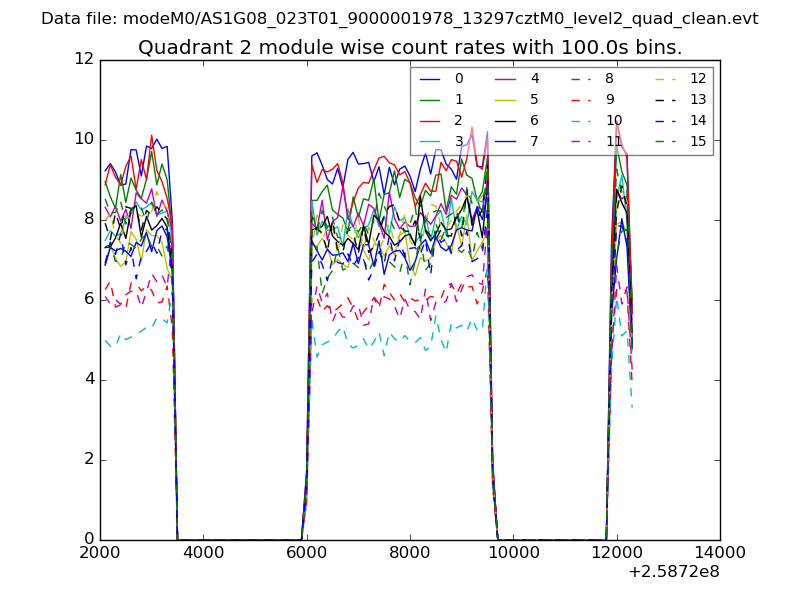
| Module-wise count rates for Quadrant B Data is divided into 100 sec bins |
 |
 |
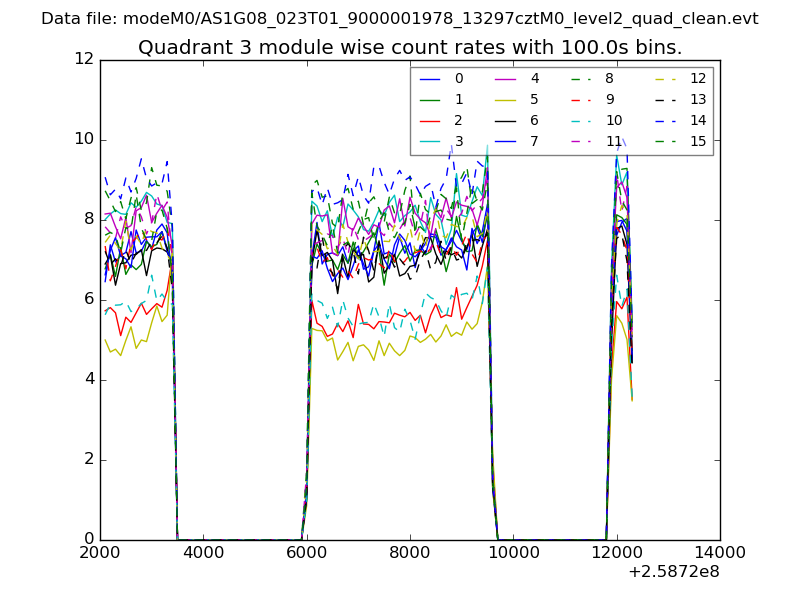
| Module-wise count rates for Quadrant C Data is divided into 100 sec bins |
 |
 |
| Module-wise count rates for Quadrant D Data is divided into 100 sec bins |
 |
 |
| Parameter | Plot |
|---|---|
| CZT HV Monitor | 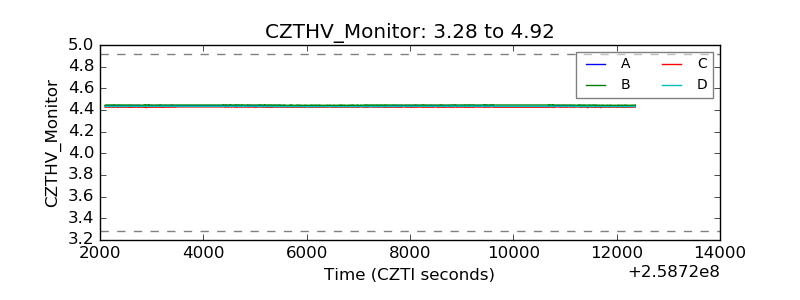 |
| D_VDD | 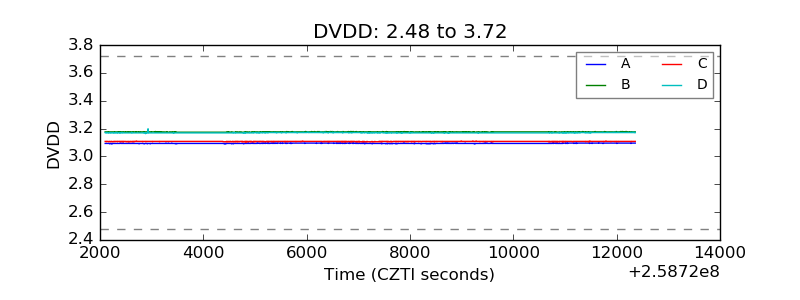 |
| Temperature 1 | 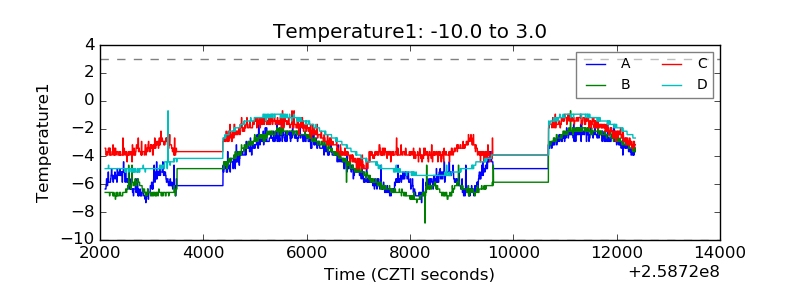 |
| Veto HV Monitor | 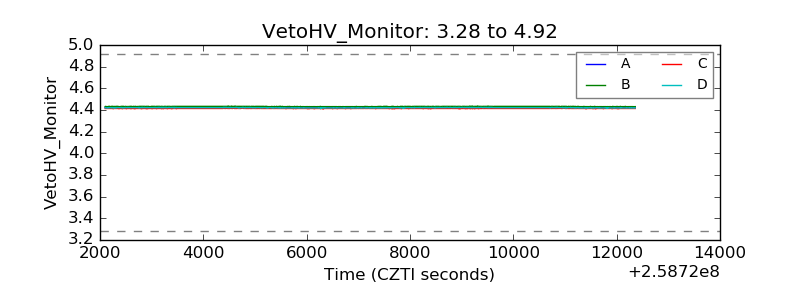 |
| Veto LLD | 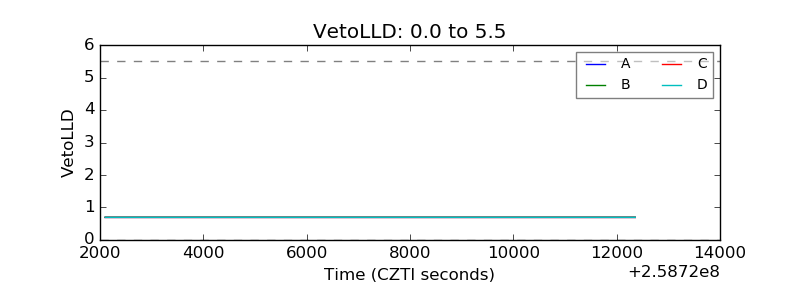 |
| Alpha Counter | 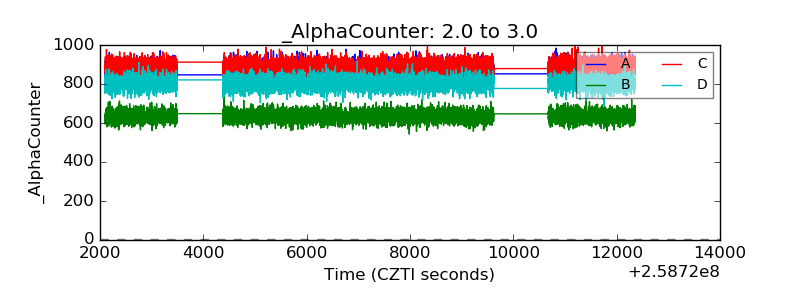 |
| _CPM_Rate |  |
| CZT Counter | 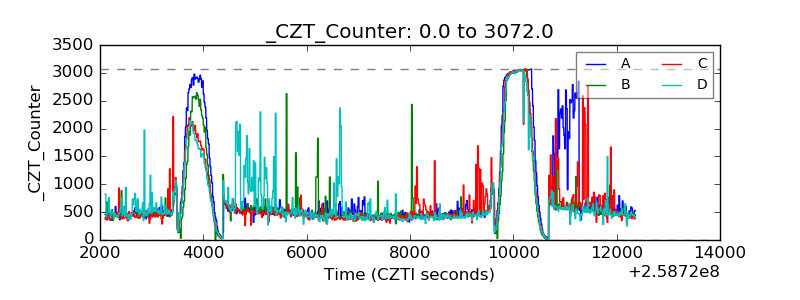 |
| +2.5 Volts monitor |  |
| +5 Volts monitor |  |
| _ROLL_ROT | 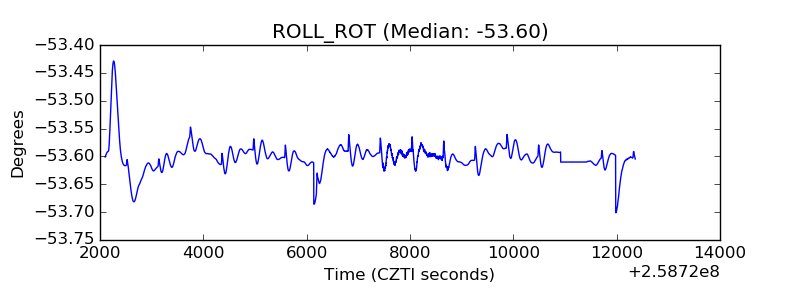 |
| _Roll_DEC | 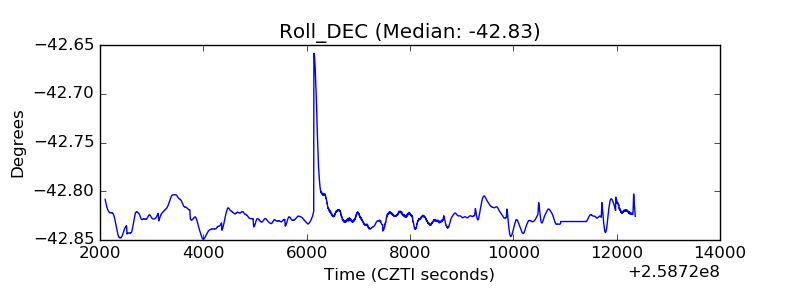 |
| _Roll_RA | 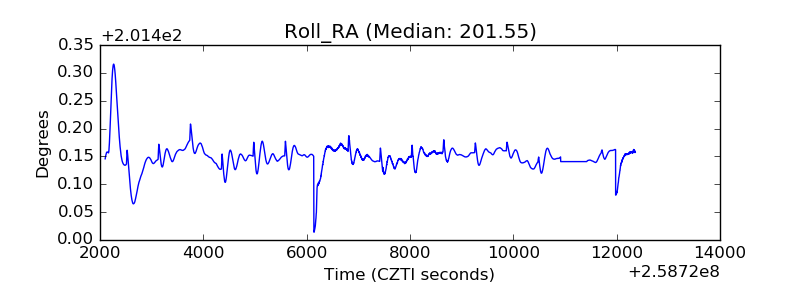 |
| Veto Counter | 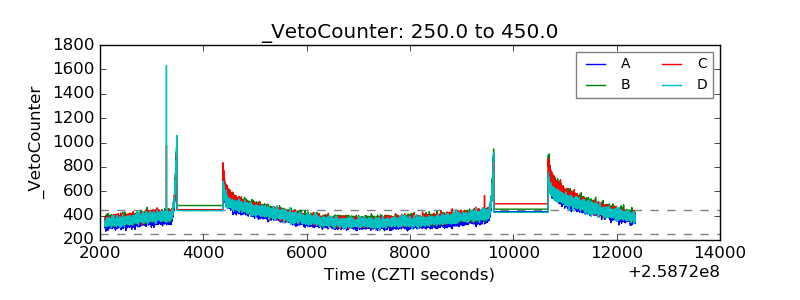 |