| Param | Original file | Final file |
|---|---|---|
| Filename | modeM0/AS1G08_023T01_9000001978_13299cztM0_level2.evt | modeM0/AS1G08_023T01_9000001978_13299cztM0_level2_quad_clean.evt |
| Size (bytes) | 501,822,720 | 90,786,240 |
| Size | 478.6 MB | 86.6 MB |
| Events in quadrant A | 4,310,413 | 577,856 |
| Events in quadrant B | 3,396,490 | 592,536 |
| Events in quadrant C | 3,462,803 | 575,036 |
| Events in quadrant D | 3,582,783 | 546,466 |
| Mode M0 | |||
|---|---|---|---|
| Quadrant | BADHDUFLAG | Total packets | Discarded packets |
| A | 0 | 17354 | 3 |
| B | 0 | 14445 | 2 |
| C | 0 | 14907 | 2 |
| D | 0 | 15158 | 2 |
| Mode SS | |||
|---|---|---|---|
| Quadrant | BADHDUFLAG | Total packets | Discarded packets |
| A | 0 | 134 | 0 |
| B | 0 | 134 | 0 |
| C | 0 | 134 | 0 |
| D | 0 | 134 | 0 |
| Mode M9 | |||
|---|---|---|---|
| Quadrant | BADHDUFLAG | Total packets | Discarded packets |
| A | 0 | 19 | 0 |
| B | 0 | 19 | 0 |
| C | 0 | 19 | 0 |
| D | 0 | 20 | 0 |
| Quadrant | Total seconds | Saturated seconds | Saturation percentage |
|---|---|---|---|
| A | 6557 | 453 | 6.908647% |
| B | 6557 | 56 | 0.854049% |
| C | 6557 | 73 | 1.113314% |
| D | 6557 | 76 | 1.159067% |
Noise dominated data is calculated using 1-second bins in cleaned event files. If a bin has >2000 counts, and if more than 50% of those come from <1% of pixels, then it is considered to be noise-dominated and hence unusable.
| Quadrant | # 1 sec bins | Bins with >0 counts | Bins with >2000 counts | High rate bins dominated by noise | Noise dominated (total time) | Noise dominated (detector-on time) | Marked lightcurve |
|---|---|---|---|---|---|---|---|
| A | 7748 | 6559 | 292 | 292 | 3.77% | 4.45% | 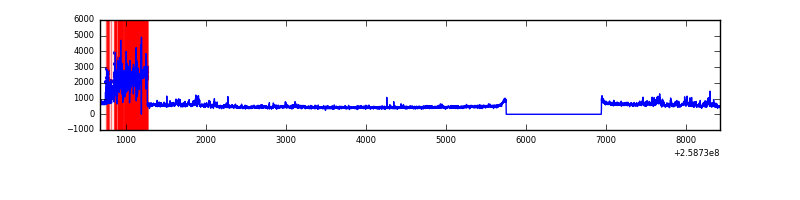 |
| B | 7748 | 6559 | 8 | 8 | 0.10% | 0.12% | 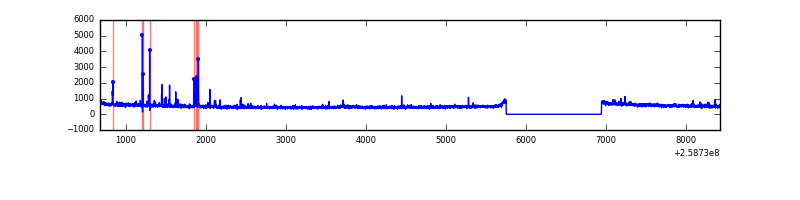 |
| C | 7748 | 6559 | 28 | 28 | 0.36% | 0.43% | 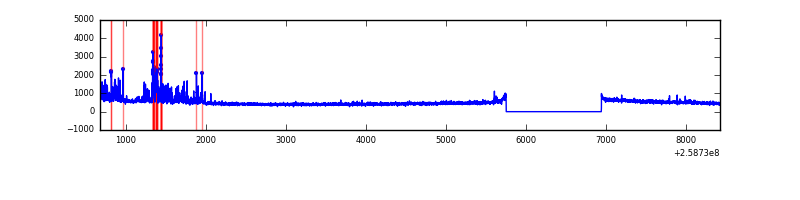 |
| D | 7748 | 6559 | 52 | 52 | 0.67% | 0.79% | 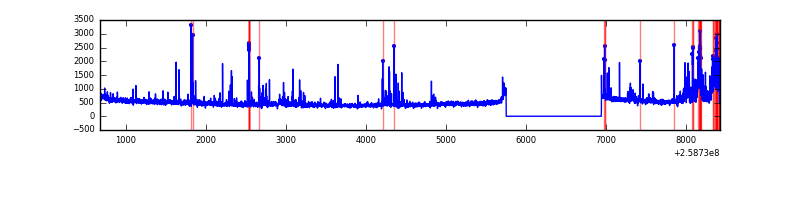 |
Top three noisy pixels from each quadrant. If the there are fewer than three noisy pixels in the level2.evt file, extra rows are filled as -1
| Pixel properties | Quadrant properties | ||||||
|---|---|---|---|---|---|---|---|
| Quadrant | DetID | PixID | Counts | Sigma | Mean | Median | Sigma |
| A | 9 | 143 | 877136 | 5449.33 | 799 | 781 | 160.8 |
| A | 8 | 15 | 326853 | 2027.57 | 799 | 781 | 160.8 |
| A | 1 | 162 | 19494 | 116.36 | 799 | 781 | 160.8 |
| B | 4 | 142 | 57282 | 361.23 | 834 | 815 | 156.3 |
| B | 3 | 64 | 32936 | 205.49 | 834 | 815 | 156.3 |
| B | 12 | 111 | 17342 | 105.73 | 834 | 815 | 156.3 |
| C | 6 | 96 | 329677 | 1809.72 | 795 | 800 | 181.7 |
| C | 15 | 208 | 16560 | 86.72 | 795 | 800 | 181.7 |
| C | 3 | 233 | 9496 | 47.85 | 795 | 800 | 181.7 |
| D | 12 | 222 | 301452 | 1579.07 | 792 | 771 | 190.4 |
| D | 1 | 52 | 102476 | 534.12 | 792 | 771 | 190.4 |
| D | 13 | 249 | 76588 | 398.16 | 792 | 771 | 190.4 |
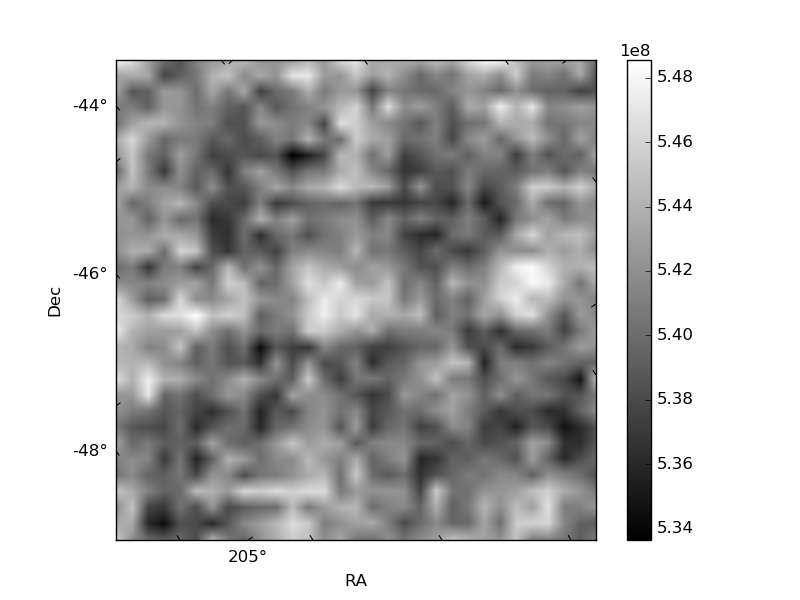
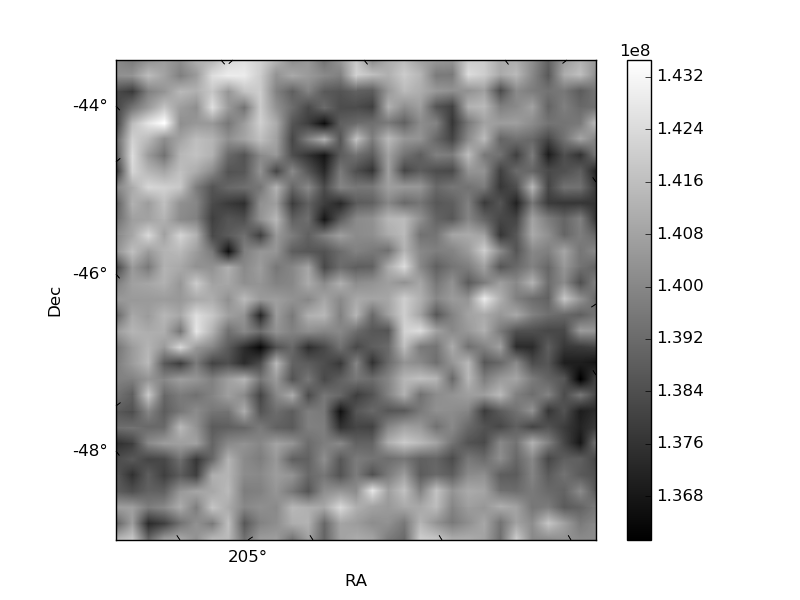
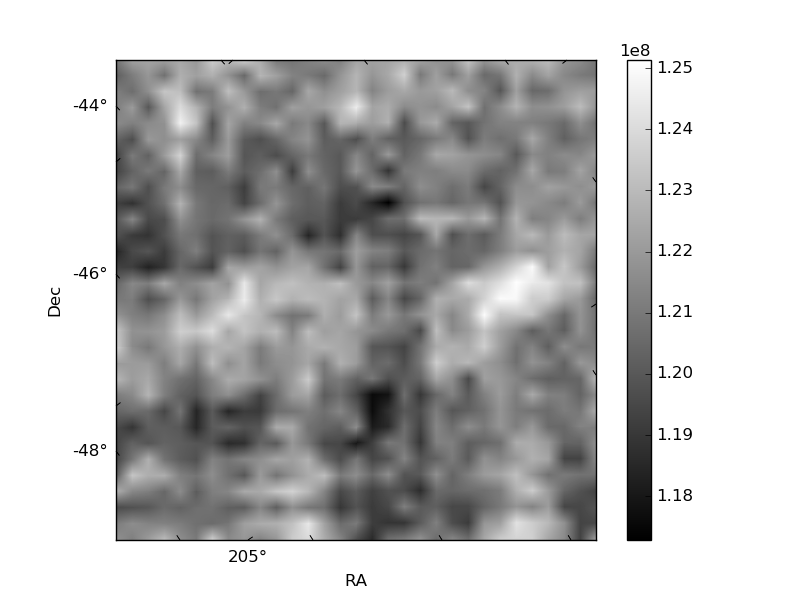
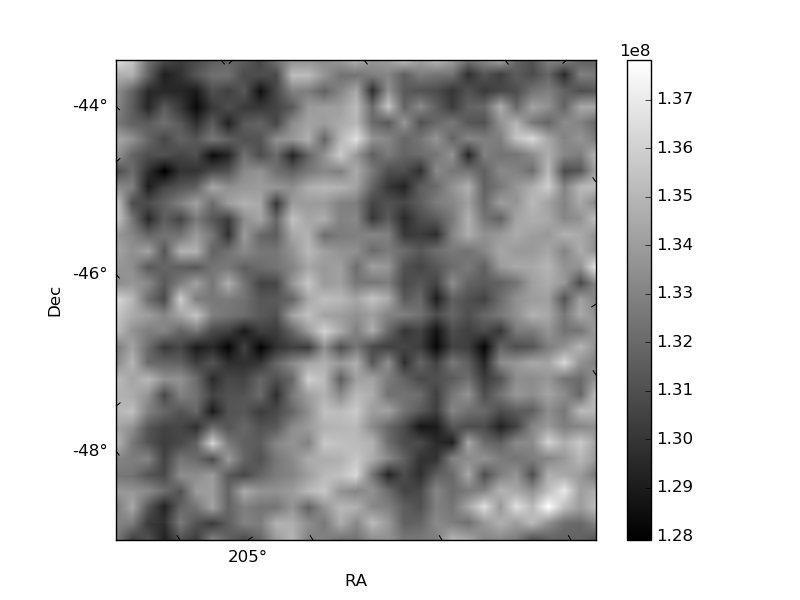
Histogram calculated using DETX and DETY for each event in the final _common_clean file
| Quadrant A | 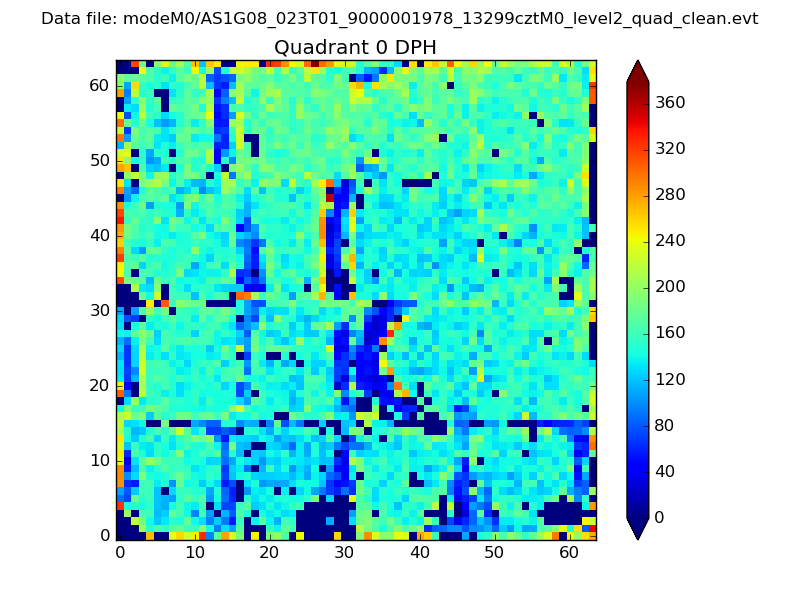 |
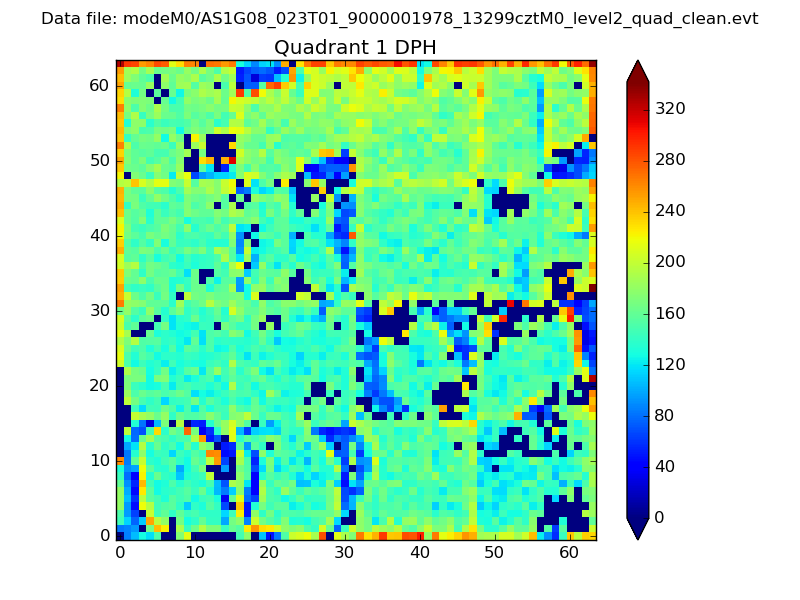 |
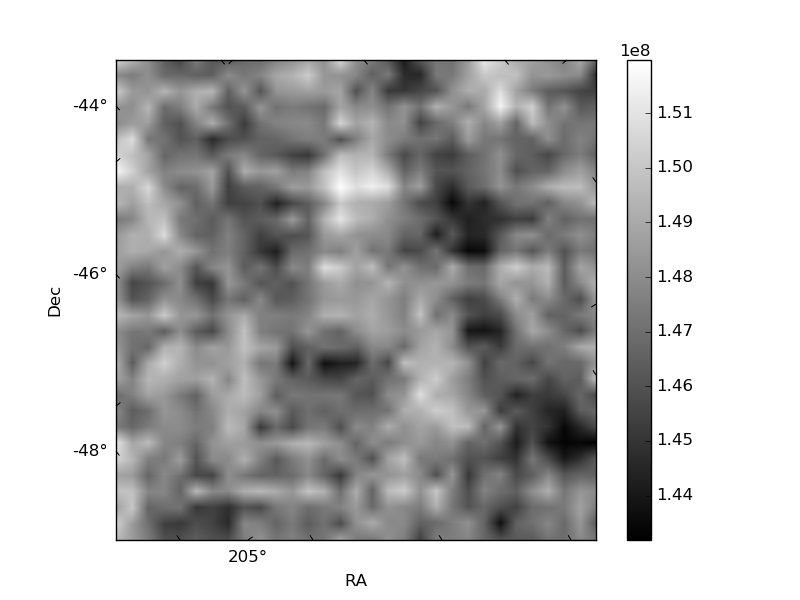
Quadrant B |
|---|---|---|---|
| Quadrant D | 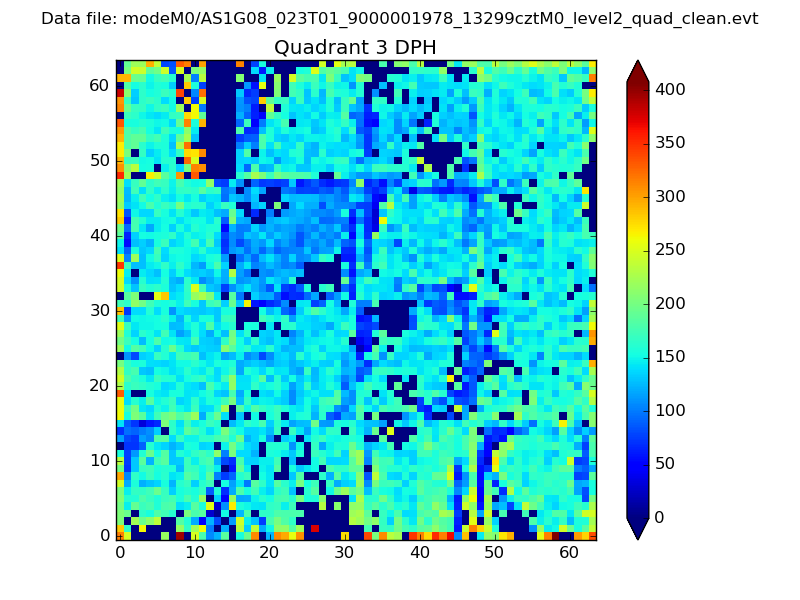 |
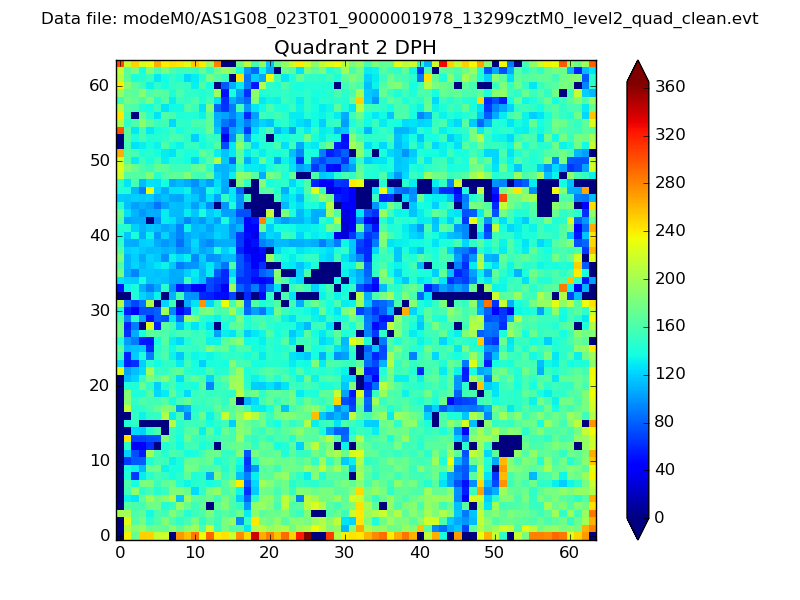 |
Quadrant C |
| Plot type | Count rate plots | Images |
|---|---|---|
| Comparison with Poisson distribution Blue bars denote a histogram of data divided into 1 sec bins. Red curve is a Poisson curve with rate = median count rate of data. |
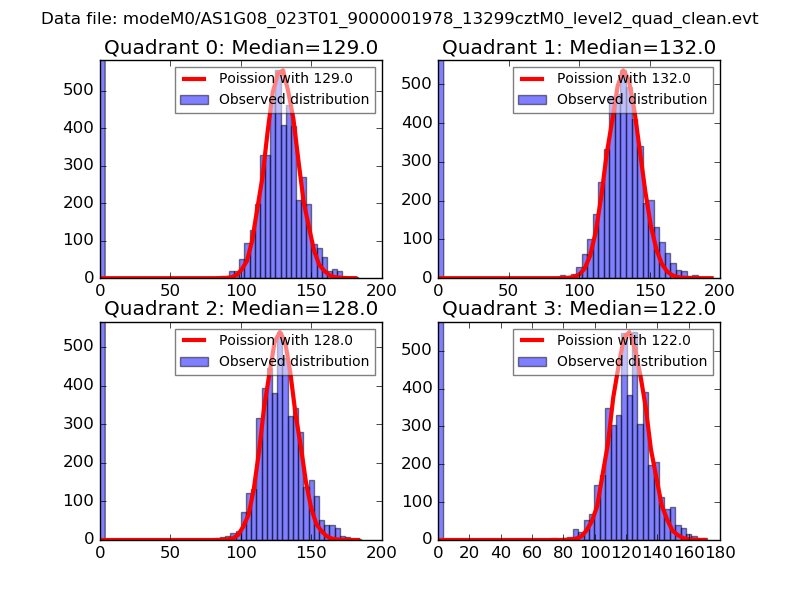 |
 |
| Quadrant-wise count rates Data is divided into 100 sec bins |
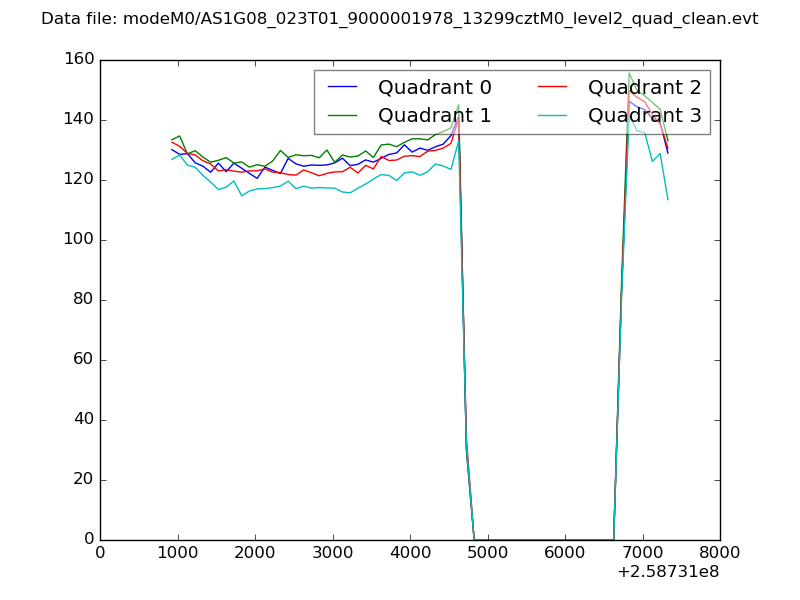 |
|
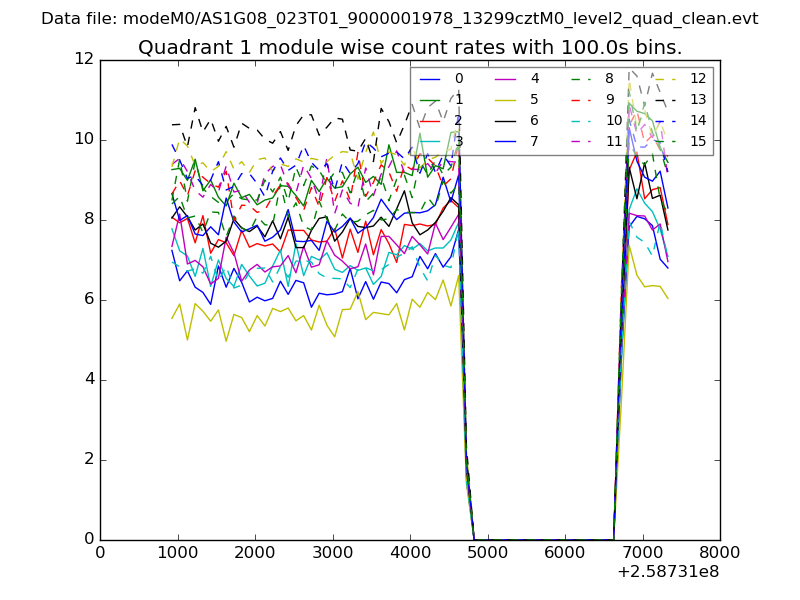
| Module-wise count rates for Quadrant A Data is divided into 100 sec bins |
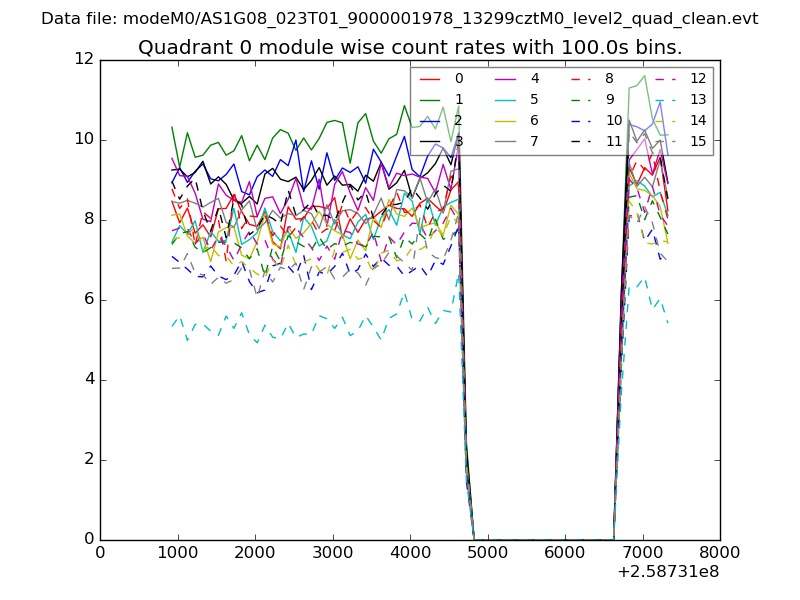 |
 |
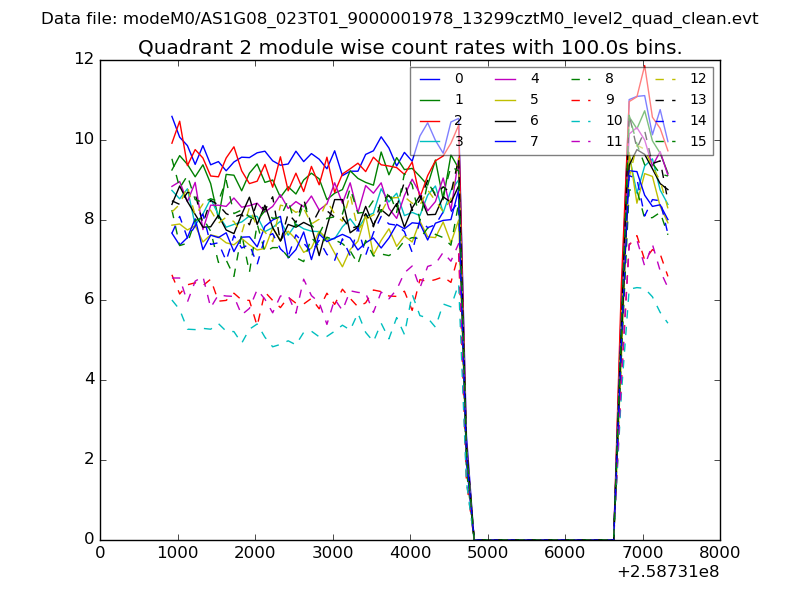
| Module-wise count rates for Quadrant B Data is divided into 100 sec bins |
 |
 |
| Module-wise count rates for Quadrant C Data is divided into 100 sec bins |
 |
 |
| Module-wise count rates for Quadrant D Data is divided into 100 sec bins |
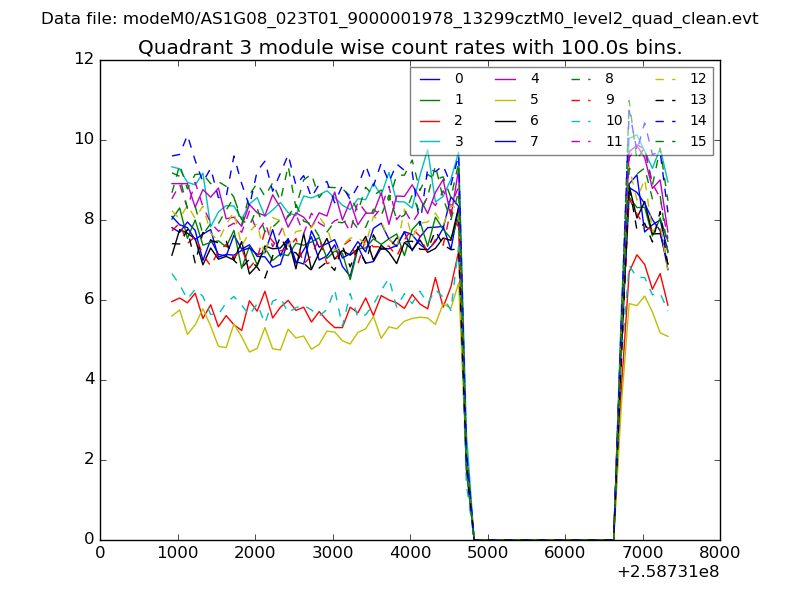 |
 |
| Parameter | Plot |
|---|---|
| CZT HV Monitor | 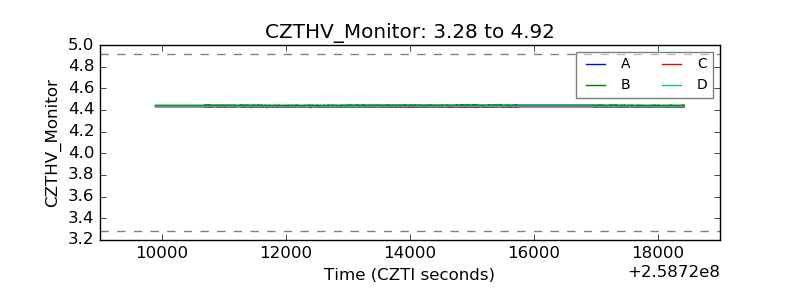 |
| D_VDD | 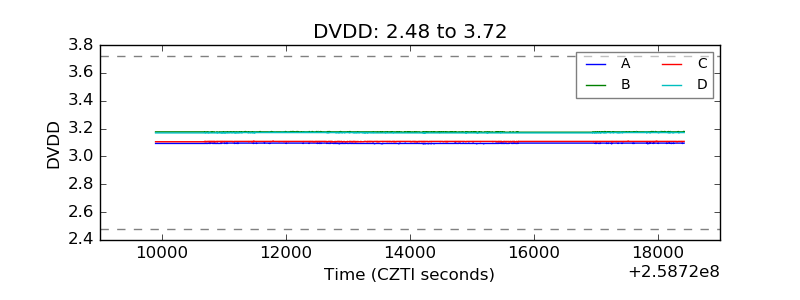 |
| Temperature 1 | 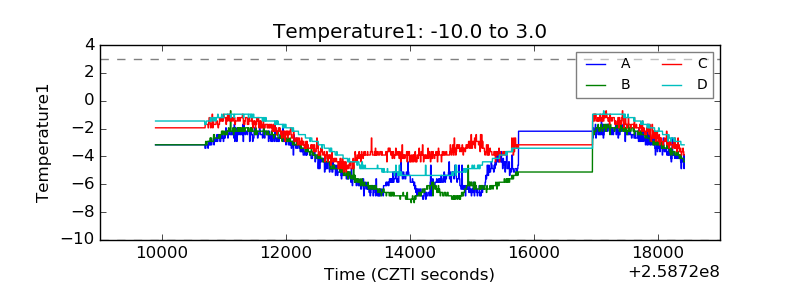 |
| Veto HV Monitor | 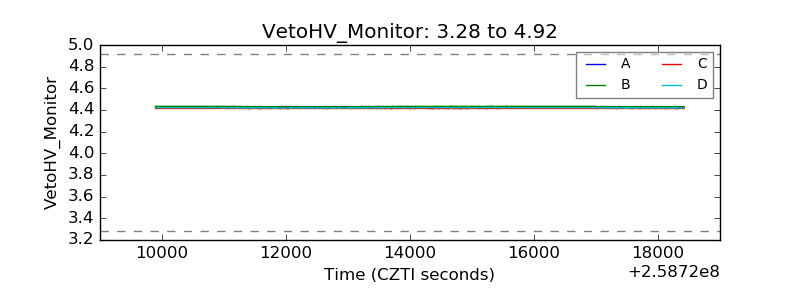 |
| Veto LLD | 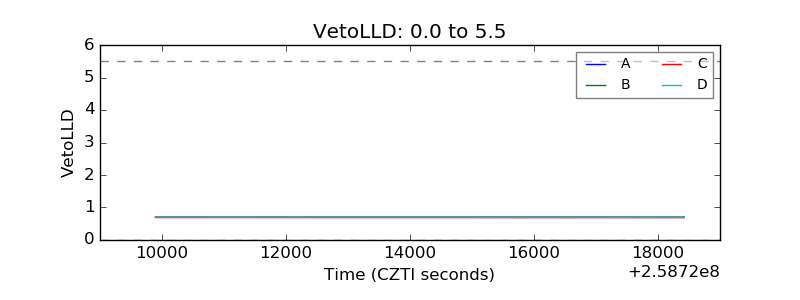 |
| Alpha Counter | 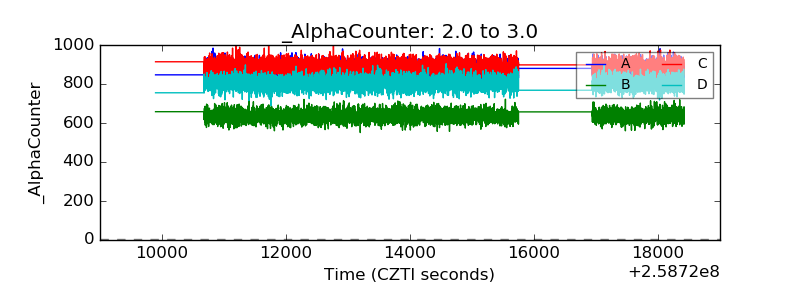 |
| _CPM_Rate | 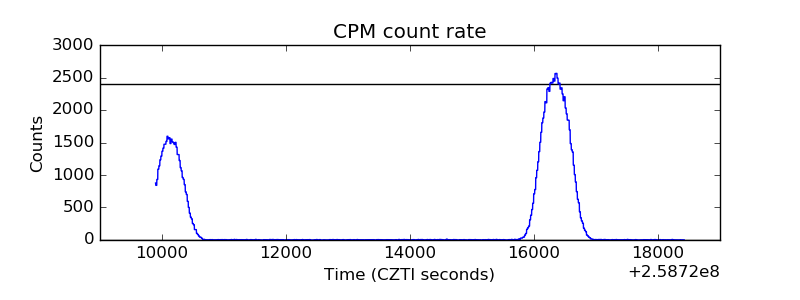 |
| CZT Counter | 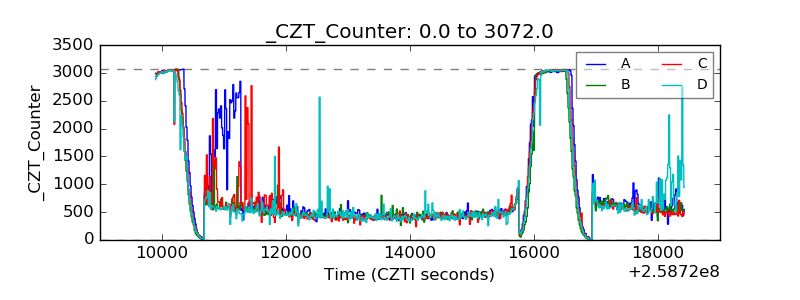 |
| +2.5 Volts monitor | 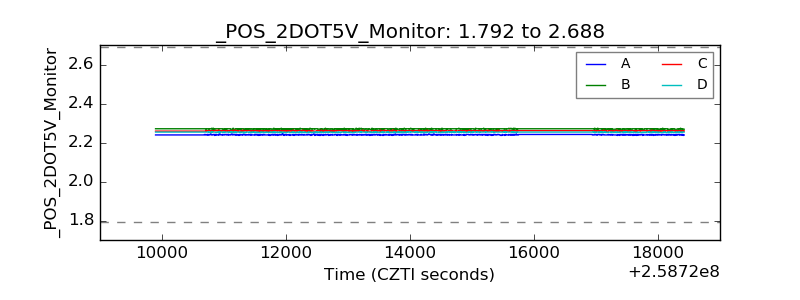 |
| +5 Volts monitor | 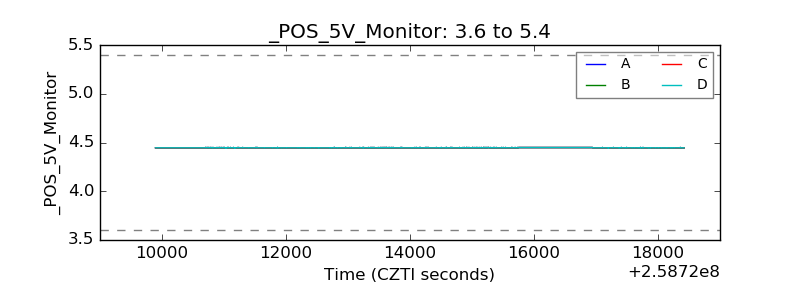 |
| _ROLL_ROT | 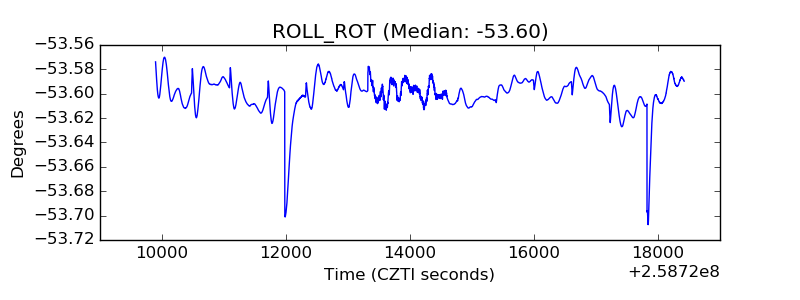 |
| _Roll_DEC |  |
| _Roll_RA | 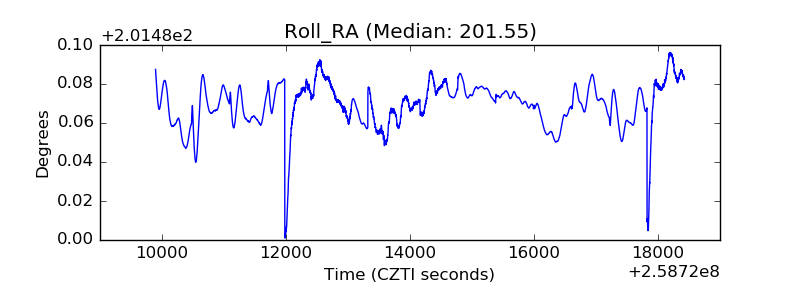 |
| Veto Counter | 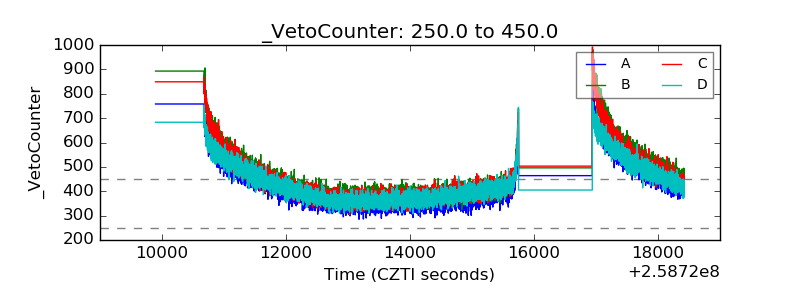 |