| Param | Original file | Final file |
|---|---|---|
| Filename | modeM0/AS1G08_023T01_9000001978_13301cztM0_level2.evt | modeM0/AS1G08_023T01_9000001978_13301cztM0_level2_quad_clean.evt |
| Size (bytes) | 480,720,960 | 116,919,360 |
| Size | 458.5 MB | 111.5 MB |
| Events in quadrant A | 3,552,177 | 778,865 |
| Events in quadrant B | 3,547,267 | 807,380 |
| Events in quadrant C | 3,370,127 | 770,516 |
| Events in quadrant D | 3,638,231 | 721,794 |
| Mode M0 | |||
|---|---|---|---|
| Quadrant | BADHDUFLAG | Total packets | Discarded packets |
| A | 0 | 14893 | 3 |
| B | 0 | 14764 | 2 |
| C | 0 | 14232 | 2 |
| D | 0 | 15162 | 2 |
| Mode SS | |||
|---|---|---|---|
| Quadrant | BADHDUFLAG | Total packets | Discarded packets |
| A | 0 | 136 | 0 |
| B | 0 | 136 | 0 |
| C | 0 | 136 | 0 |
| D | 0 | 136 | 0 |
| Mode M9 | |||
|---|---|---|---|
| Quadrant | BADHDUFLAG | Total packets | Discarded packets |
| A | 0 | 26 | 0 |
| B | 0 | 26 | 0 |
| C | 0 | 26 | 0 |
| D | 0 | 26 | 0 |
| Quadrant | Total seconds | Saturated seconds | Saturation percentage |
|---|---|---|---|
| A | 6638 | 134 | 2.018680% |
| B | 6638 | 148 | 2.229587% |
| C | 6638 | 89 | 1.340765% |
| D | 6638 | 134 | 2.018680% |
Noise dominated data is calculated using 1-second bins in cleaned event files. If a bin has >2000 counts, and if more than 50% of those come from <1% of pixels, then it is considered to be noise-dominated and hence unusable.
| Quadrant | # 1 sec bins | Bins with >0 counts | Bins with >2000 counts | High rate bins dominated by noise | Noise dominated (total time) | Noise dominated (detector-on time) | Marked lightcurve |
|---|---|---|---|---|---|---|---|
| A | 9269 | 6641 | 0 | 0 | 0.00% | 0.00% | 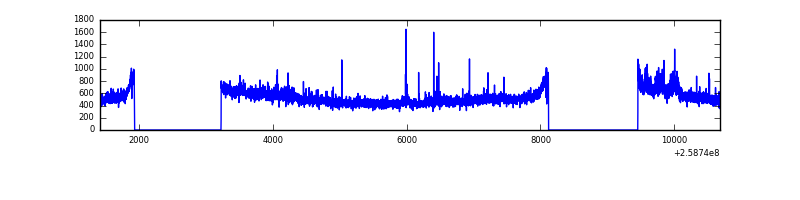 |
| B | 9269 | 6641 | 6 | 6 | 0.06% | 0.09% | 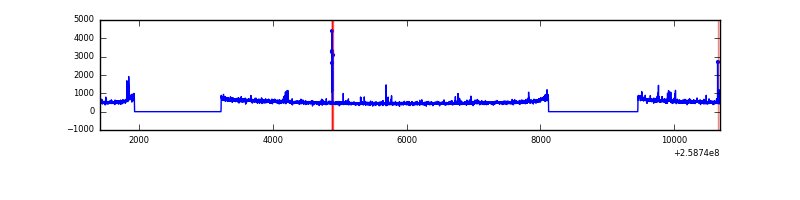 |
| C | 9269 | 6641 | 4 | 4 | 0.04% | 0.06% | 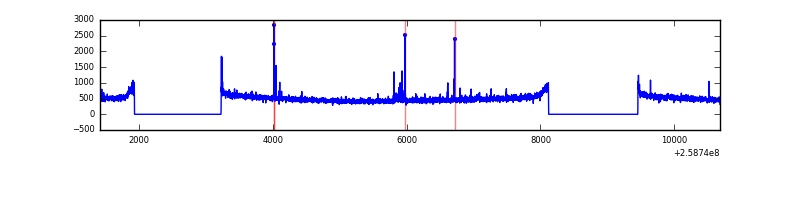 |
| D | 9269 | 6641 | 44 | 44 | 0.47% | 0.66% | 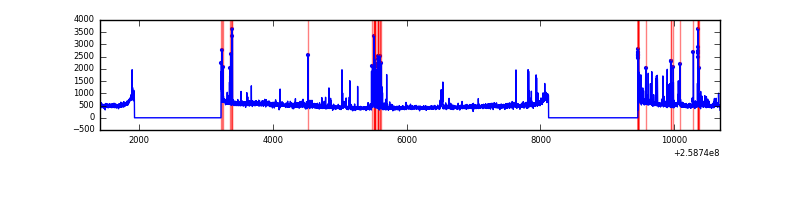 |
Top three noisy pixels from each quadrant. If the there are fewer than three noisy pixels in the level2.evt file, extra rows are filled as -1
| Pixel properties | Quadrant properties | ||||||
|---|---|---|---|---|---|---|---|
| Quadrant | DetID | PixID | Counts | Sigma | Mean | Median | Sigma |
| A | 8 | 15 | 144735 | 824.53 | 871 | 856 | 174.5 |
| A | 1 | 162 | 22223 | 122.45 | 871 | 856 | 174.5 |
| A | 9 | 143 | 18394 | 100.5 | 871 | 856 | 174.5 |
| B | 10 | 245 | 29036 | 171.79 | 880 | 861 | 164.0 |
| B | 0 | 197 | 20927 | 122.35 | 880 | 861 | 164.0 |
| B | 3 | 209 | 20220 | 118.04 | 880 | 861 | 164.0 |
| C | 15 | 208 | 53050 | 271.91 | 844 | 850 | 192.0 |
| C | 3 | 233 | 20318 | 101.41 | 844 | 850 | 192.0 |
| C | 13 | 61 | 6154 | 27.63 | 844 | 850 | 192.0 |
| D | 13 | 249 | 223386 | 1128.83 | 827 | 804 | 197.2 |
| D | 8 | 195 | 128186 | 646.02 | 827 | 804 | 197.2 |
| D | 2 | 136 | 55143 | 275.58 | 827 | 804 | 197.2 |
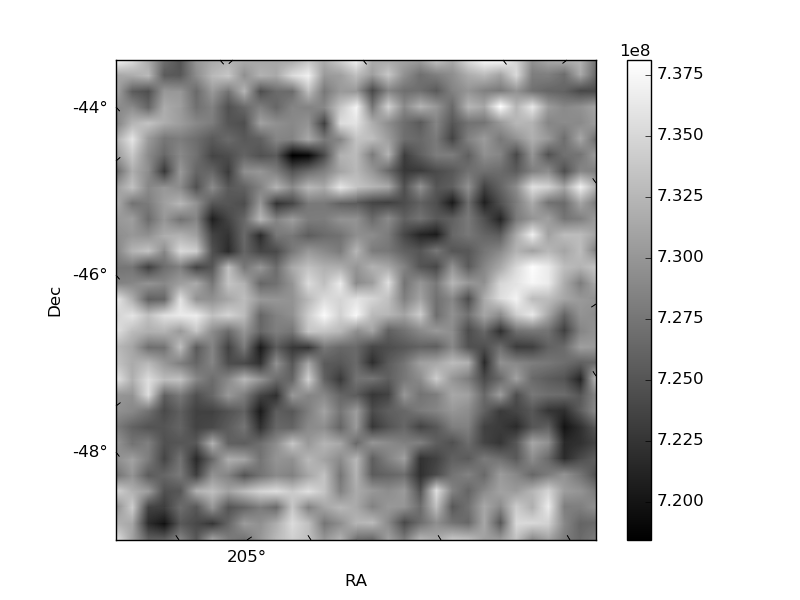
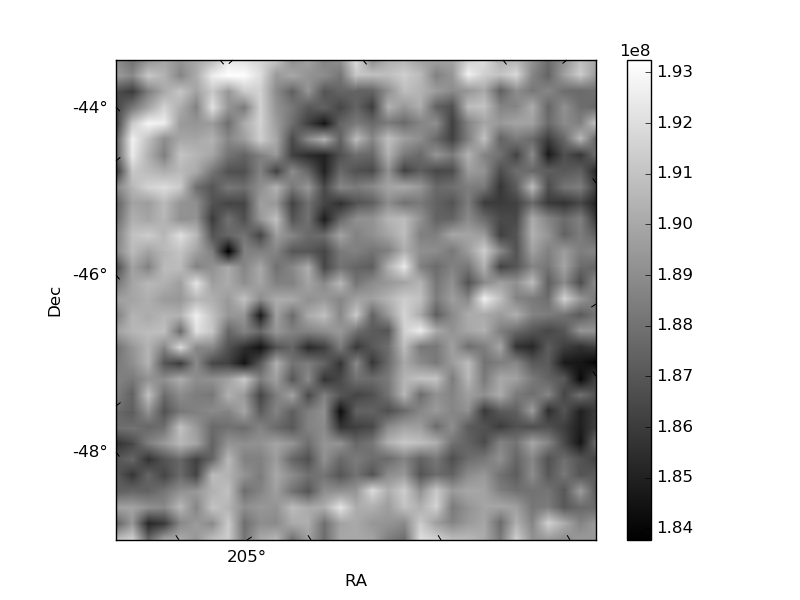
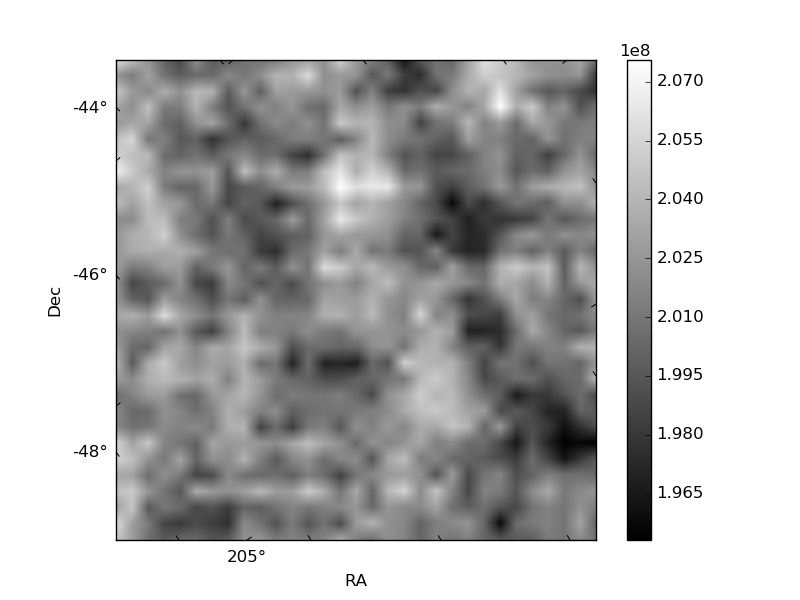
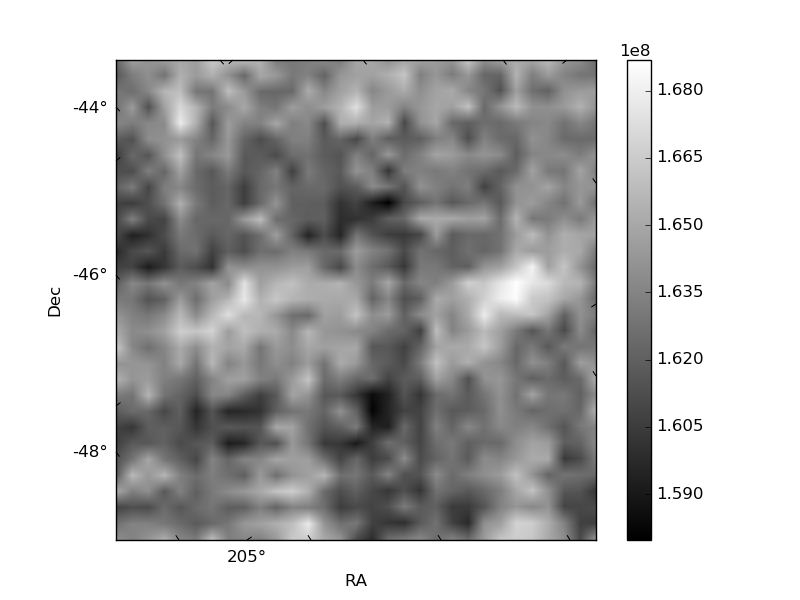
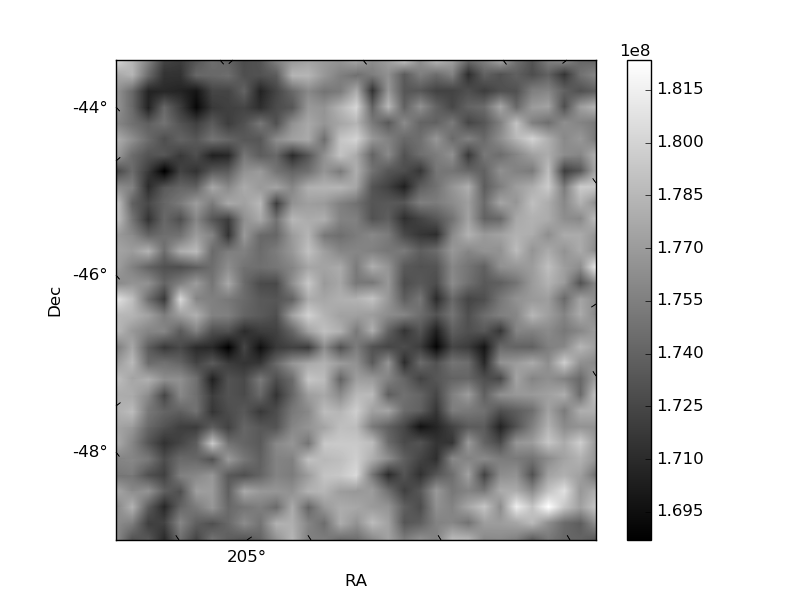
Histogram calculated using DETX and DETY for each event in the final _common_clean file
| Quadrant A | 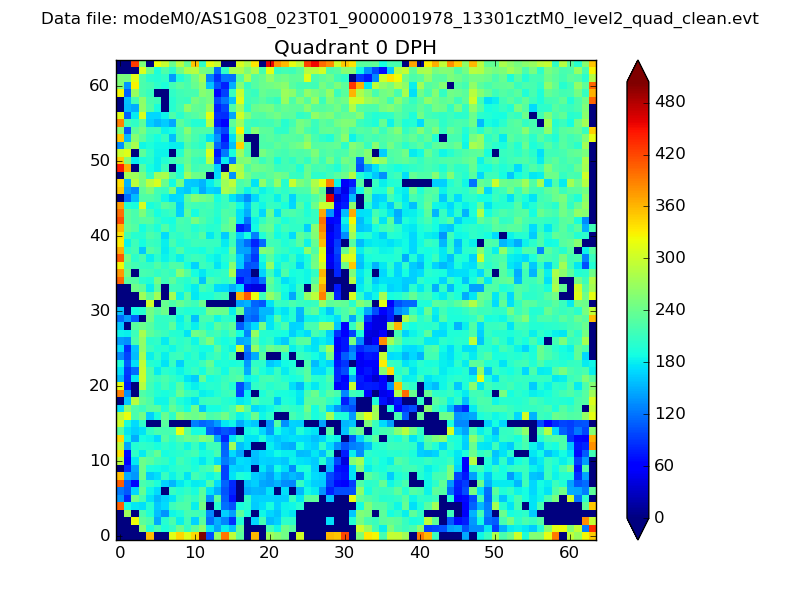 |
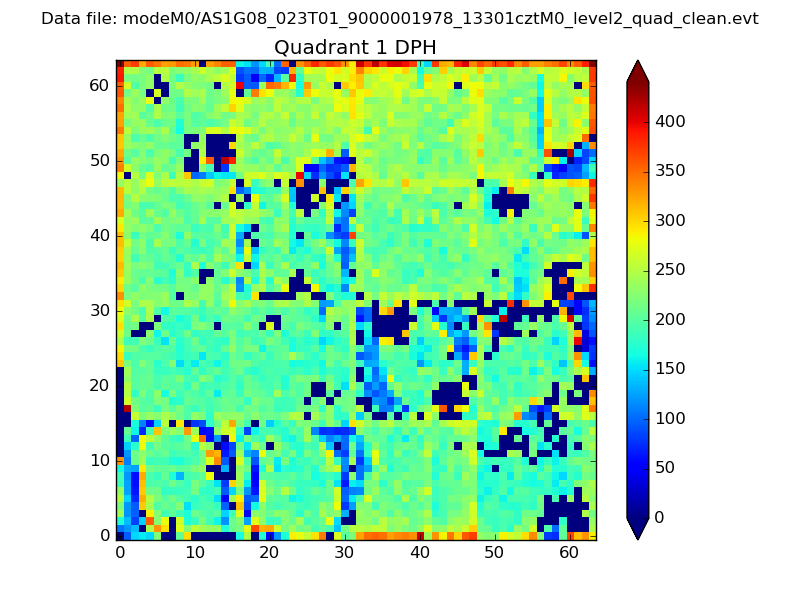 |
Quadrant B |
|---|---|---|---|
| Quadrant D | 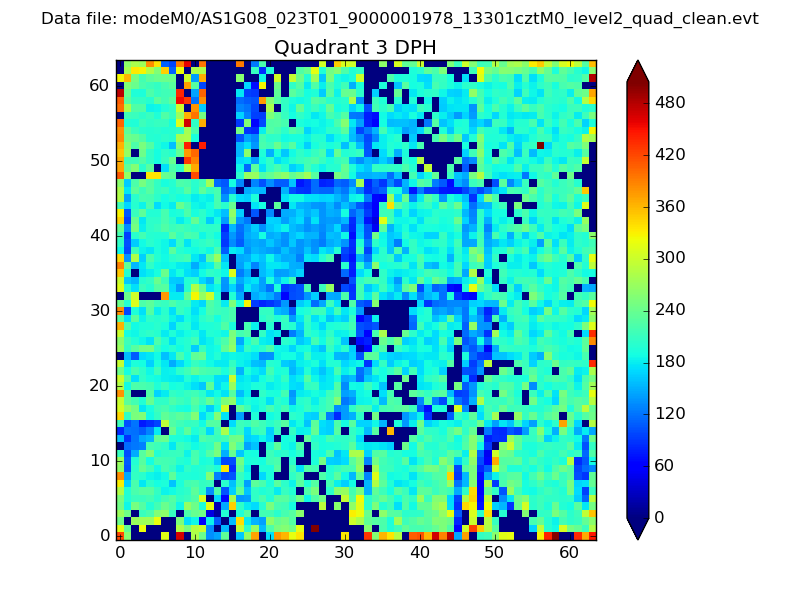 |
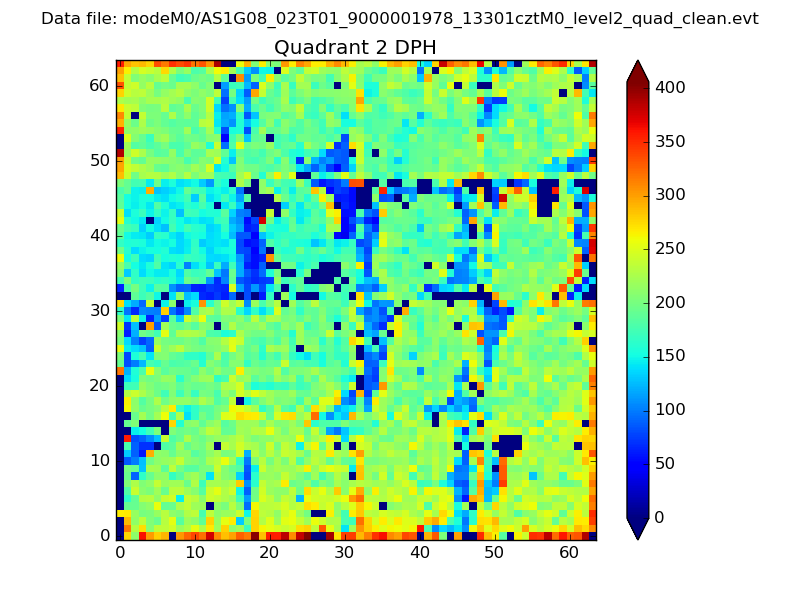 |
Quadrant C |
| Plot type | Count rate plots | Images |
|---|---|---|
| Comparison with Poisson distribution Blue bars denote a histogram of data divided into 1 sec bins. Red curve is a Poisson curve with rate = median count rate of data. |
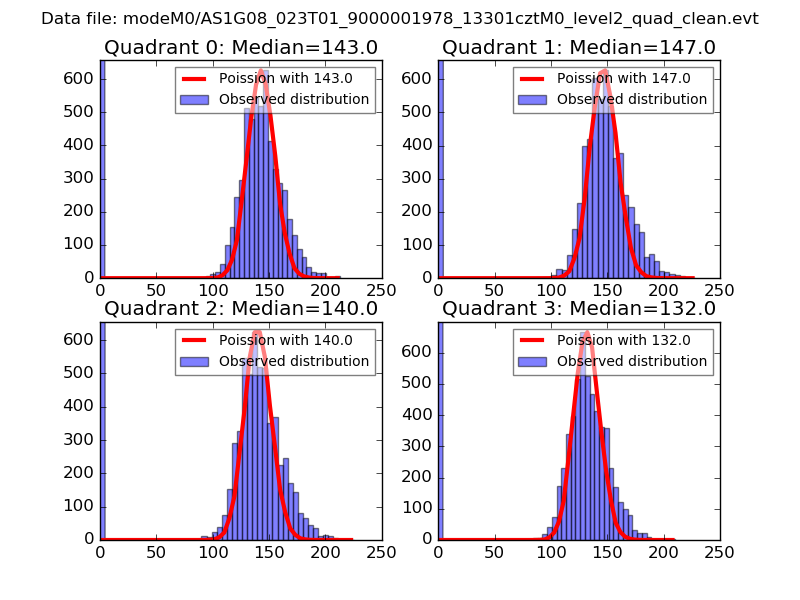 |
 |
| Quadrant-wise count rates Data is divided into 100 sec bins |
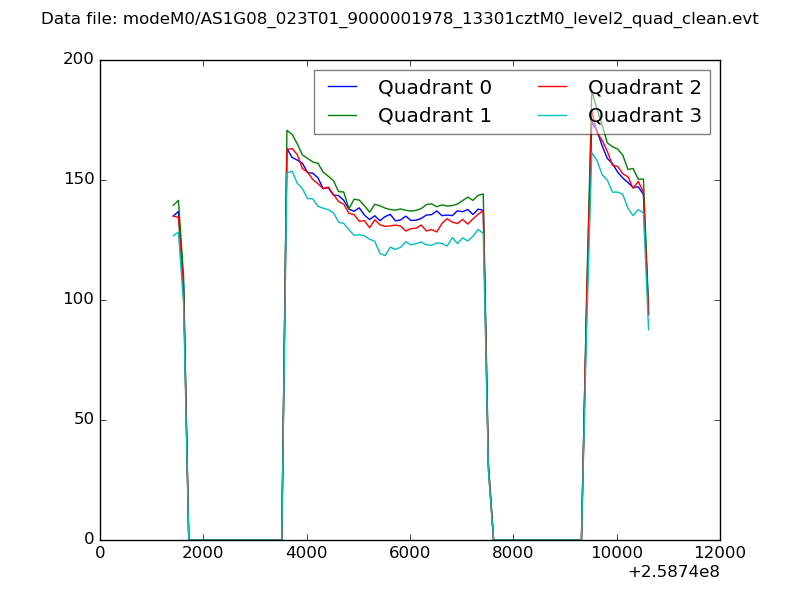 |
|
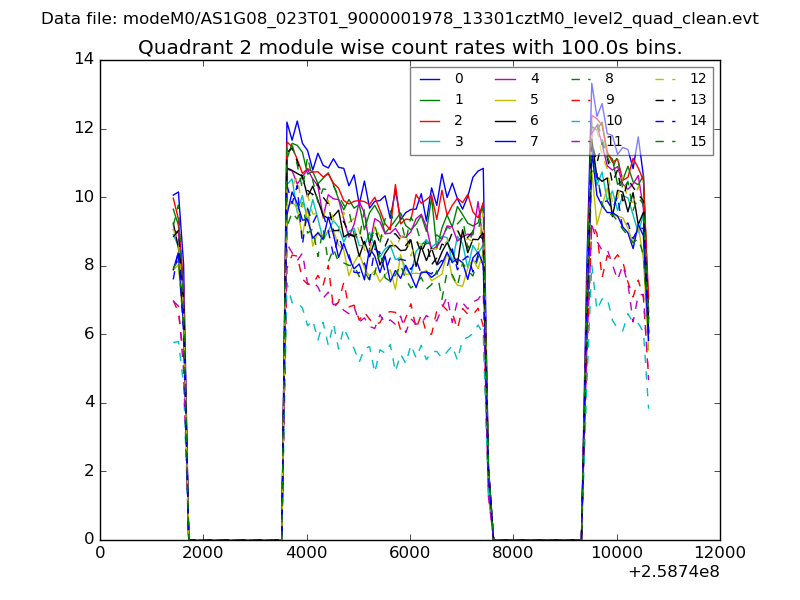
| Module-wise count rates for Quadrant A Data is divided into 100 sec bins |
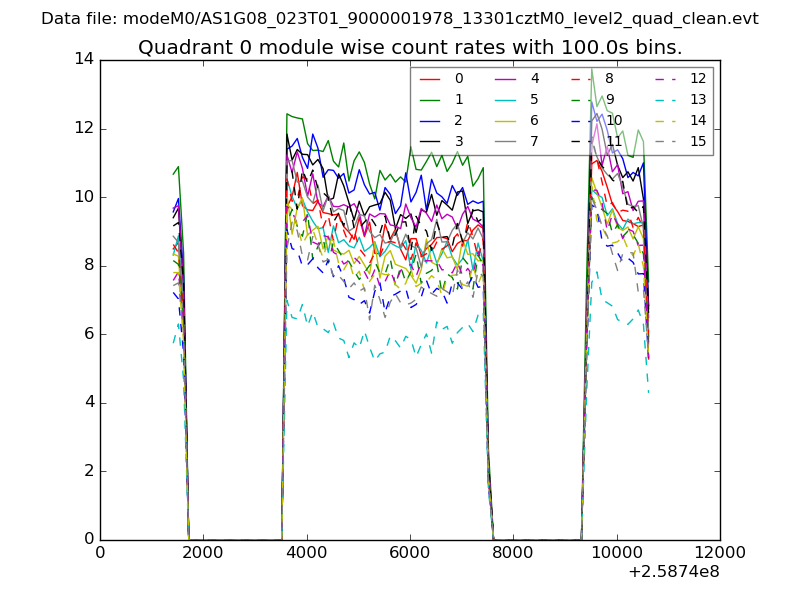 |
 |
| Module-wise count rates for Quadrant B Data is divided into 100 sec bins |
 |
 |
| Module-wise count rates for Quadrant C Data is divided into 100 sec bins |
 |
 |
| Module-wise count rates for Quadrant D Data is divided into 100 sec bins |
 |
 |
| Parameter | Plot |
|---|---|
| CZT HV Monitor | 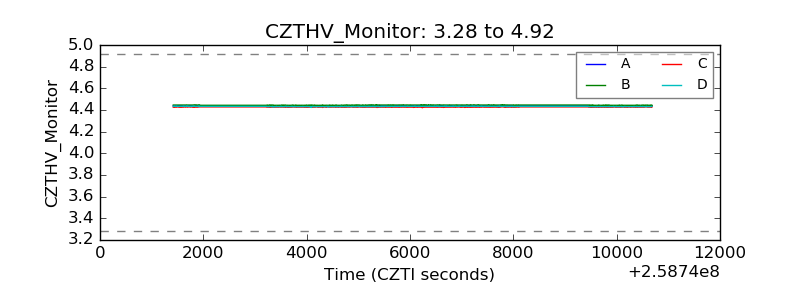 |
| D_VDD | 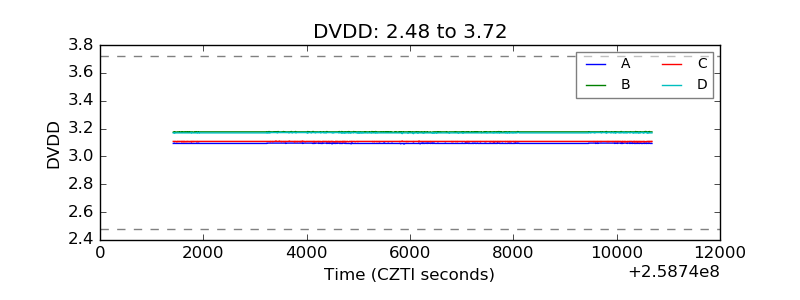 |
| Temperature 1 | 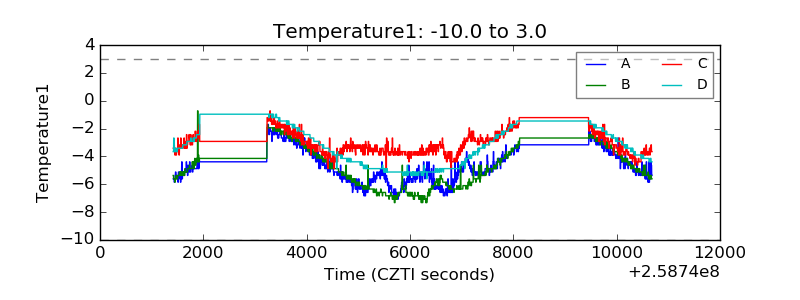 |
| Veto HV Monitor | 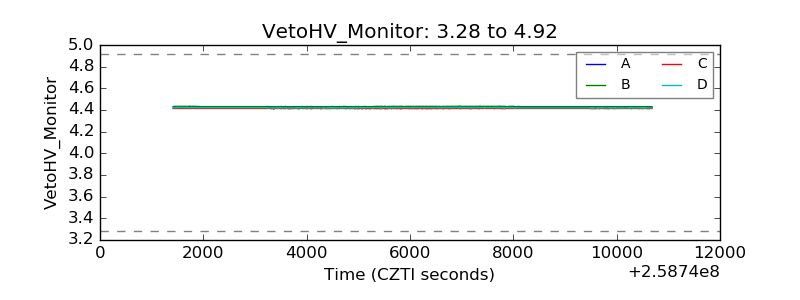 |
| Veto LLD | 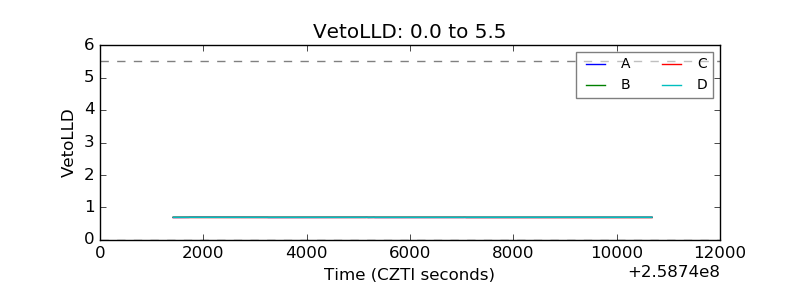 |
| Alpha Counter | 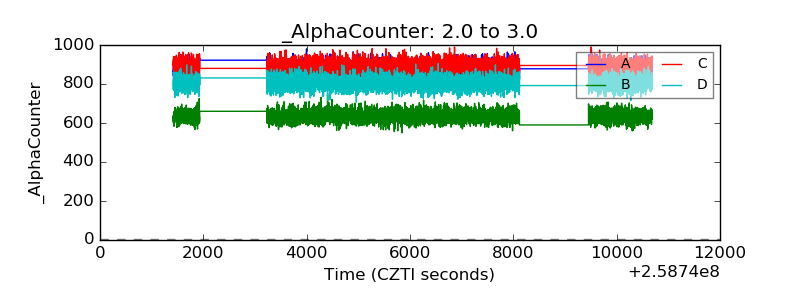 |
| _CPM_Rate | 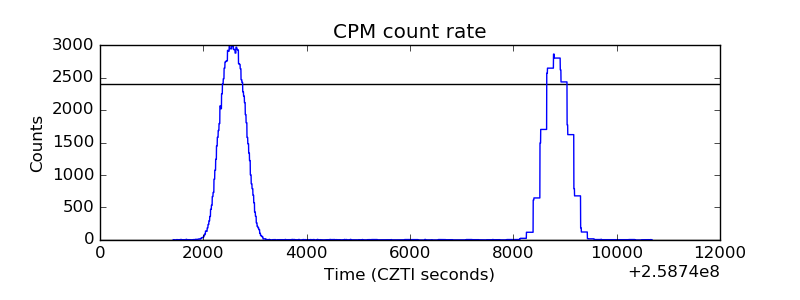 |
| CZT Counter | 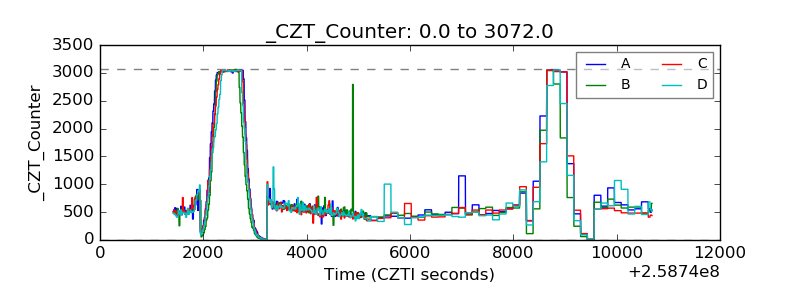 |
| +2.5 Volts monitor |  |
| +5 Volts monitor |  |
| _ROLL_ROT |  |
| _Roll_DEC | 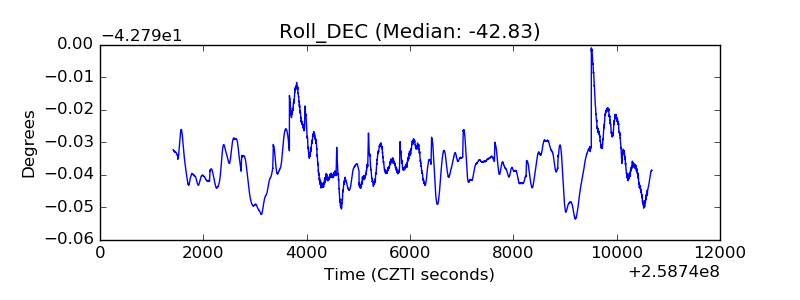 |
| _Roll_RA | 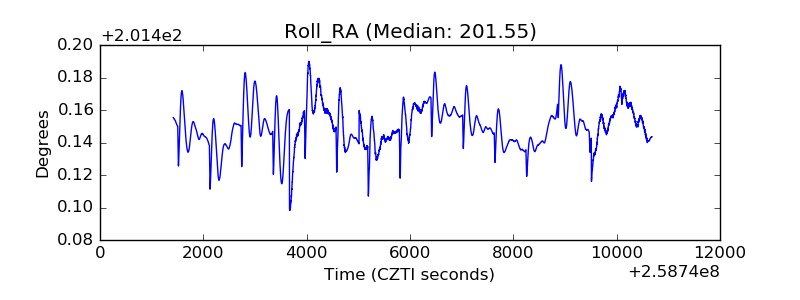 |
| Veto Counter | 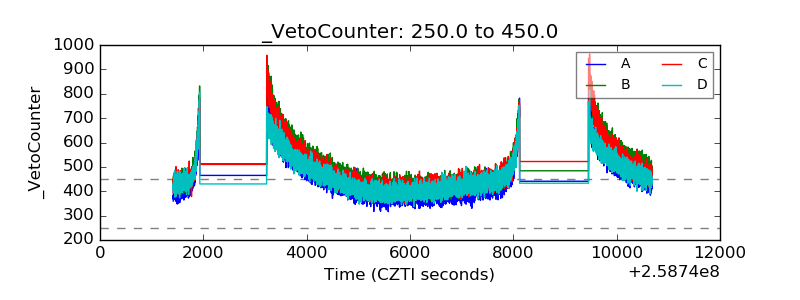 |