| Param | Original file | Final file |
|---|---|---|
| Filename | modeM0/AS1G08_023T01_9000001978_13303cztM0_level2.evt | modeM0/AS1G08_023T01_9000001978_13303cztM0_level2_quad_clean.evt |
| Size (bytes) | 469,975,680 | 102,942,720 |
| Size | 448.2 MB | 98.2 MB |
| Events in quadrant A | 3,184,385 | 674,315 |
| Events in quadrant B | 3,297,095 | 699,777 |
| Events in quadrant C | 3,026,012 | 672,849 |
| Events in quadrant D | 4,286,702 | 619,851 |
| Mode M0 | |||
|---|---|---|---|
| Quadrant | BADHDUFLAG | Total packets | Discarded packets |
| A | 0 | 13677 | 3 |
| B | 0 | 13959 | 2 |
| C | 0 | 13329 | 2 |
| D | 0 | 17281 | 2 |
| Mode SS | |||
|---|---|---|---|
| Quadrant | BADHDUFLAG | Total packets | Discarded packets |
| A | 0 | 130 | 0 |
| B | 0 | 130 | 0 |
| C | 0 | 130 | 0 |
| D | 0 | 130 | 0 |
| Mode M9 | |||
|---|---|---|---|
| Quadrant | BADHDUFLAG | Total packets | Discarded packets |
| A | 0 | 20 | 0 |
| B | 0 | 20 | 0 |
| C | 0 | 20 | 0 |
| D | 0 | 21 | 0 |
| Quadrant | Total seconds | Saturated seconds | Saturation percentage |
|---|---|---|---|
| A | 6467 | 30 | 0.463894% |
| B | 6467 | 61 | 0.943250% |
| C | 6467 | 18 | 0.278336% |
| D | 6467 | 269 | 4.159579% |
Noise dominated data is calculated using 1-second bins in cleaned event files. If a bin has >2000 counts, and if more than 50% of those come from <1% of pixels, then it is considered to be noise-dominated and hence unusable.
| Quadrant | # 1 sec bins | Bins with >0 counts | Bins with >2000 counts | High rate bins dominated by noise | Noise dominated (total time) | Noise dominated (detector-on time) | Marked lightcurve |
|---|---|---|---|---|---|---|---|
| A | 7723 | 6469 | 1 | 1 | 0.01% | 0.02% | 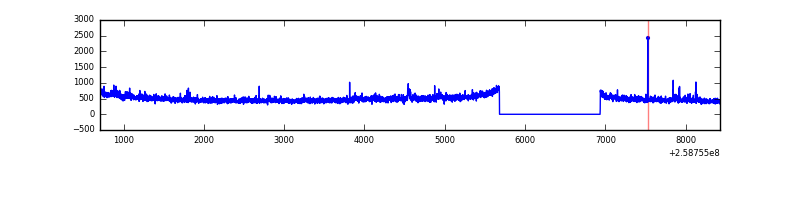 |
| B | 7723 | 6469 | 3 | 3 | 0.04% | 0.05% | 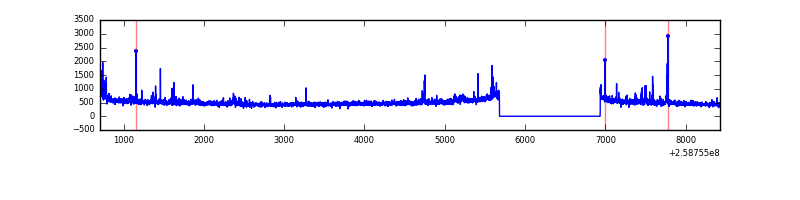 |
| C | 7723 | 6469 | 3 | 3 | 0.04% | 0.05% | 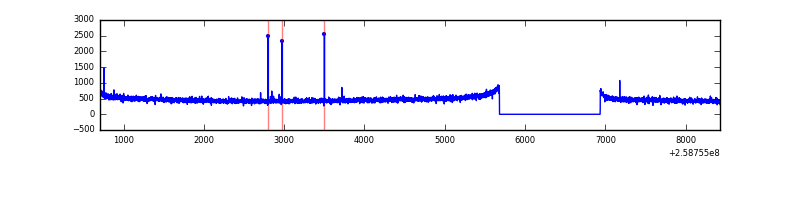 |
| D | 7723 | 6469 | 196 | 196 | 2.54% | 3.03% | 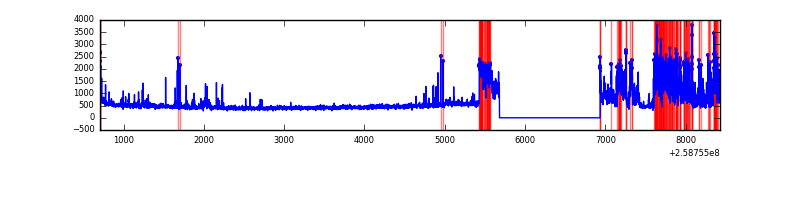 |
Top three noisy pixels from each quadrant. If the there are fewer than three noisy pixels in the level2.evt file, extra rows are filled as -1
| Pixel properties | Quadrant properties | ||||||
|---|---|---|---|---|---|---|---|
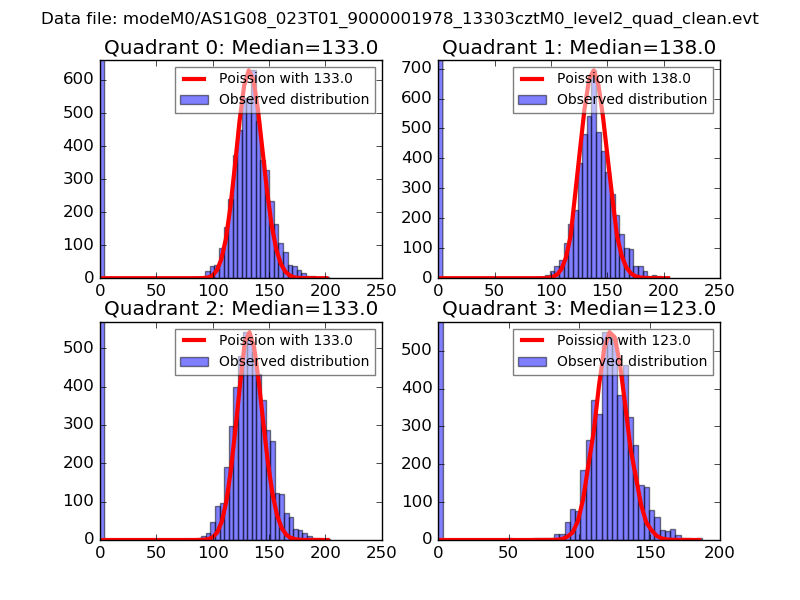
| Quadrant | DetID | PixID | Counts | Sigma | Mean | Median | Sigma |
| A | 8 | 15 | 114693 | 717.54 | 786 | 772 | 158.8 |
| A | 1 | 162 | 22927 | 139.54 | 786 | 772 | 158.8 |
| A | 9 | 143 | 8448 | 48.35 | 786 | 772 | 158.8 |
| B | 3 | 64 | 51943 | 344.27 | 800 | 778 | 148.6 |
| B | 0 | 214 | 25333 | 165.22 | 800 | 778 | 148.6 |
| B | 4 | 142 | 24117 | 157.04 | 800 | 778 | 148.6 |
| C | 14 | 234 | 10577 | 55.32 | 770 | 774 | 177.2 |
| C | 15 | 208 | 6666 | 33.25 | 770 | 774 | 177.2 |
| C | 13 | 61 | 5766 | 28.17 | 770 | 774 | 177.2 |
| D | 1 | 52 | 709563 | 3998.26 | 744 | 722 | 177.3 |
| D | 5 | 222 | 461835 | 2600.94 | 744 | 722 | 177.3 |
| D | 8 | 195 | 116641 | 653.85 | 744 | 722 | 177.3 |
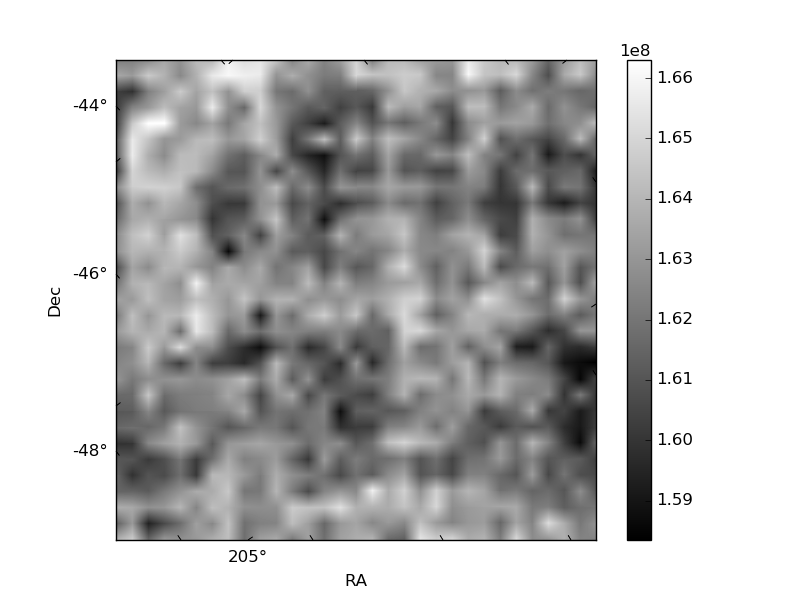
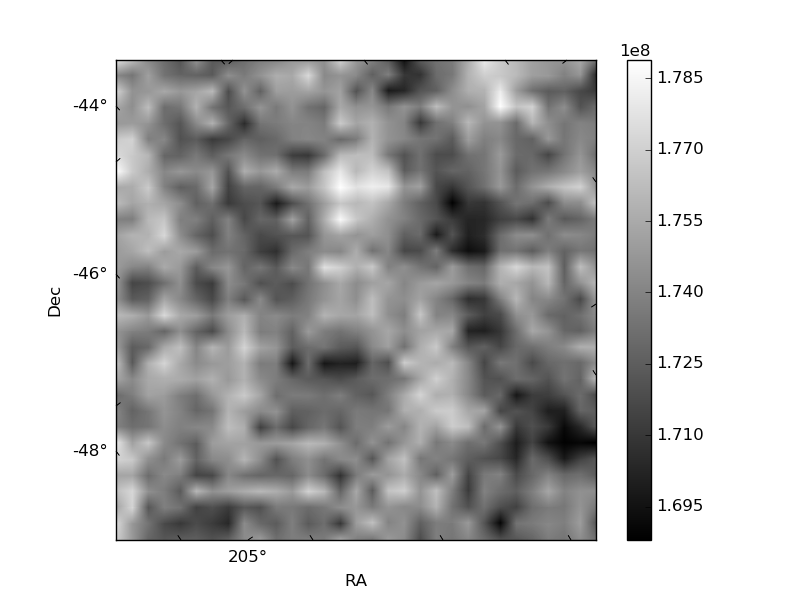
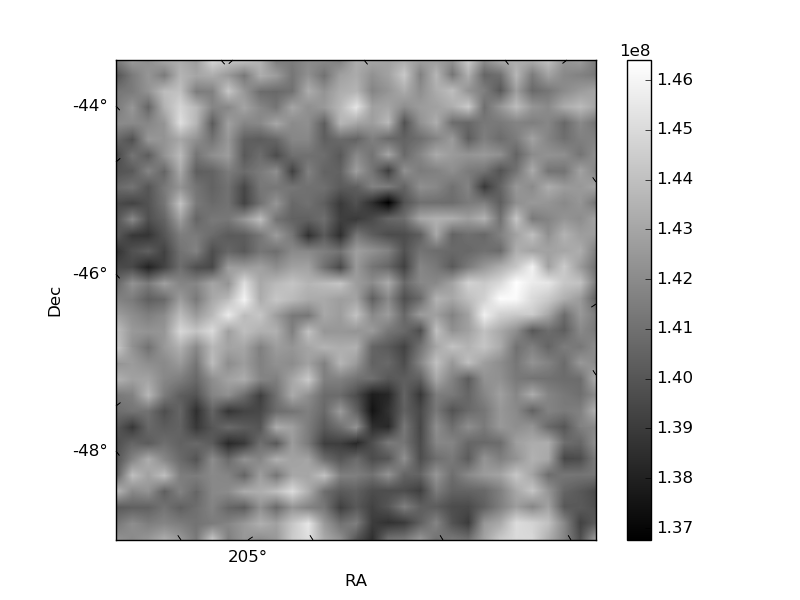
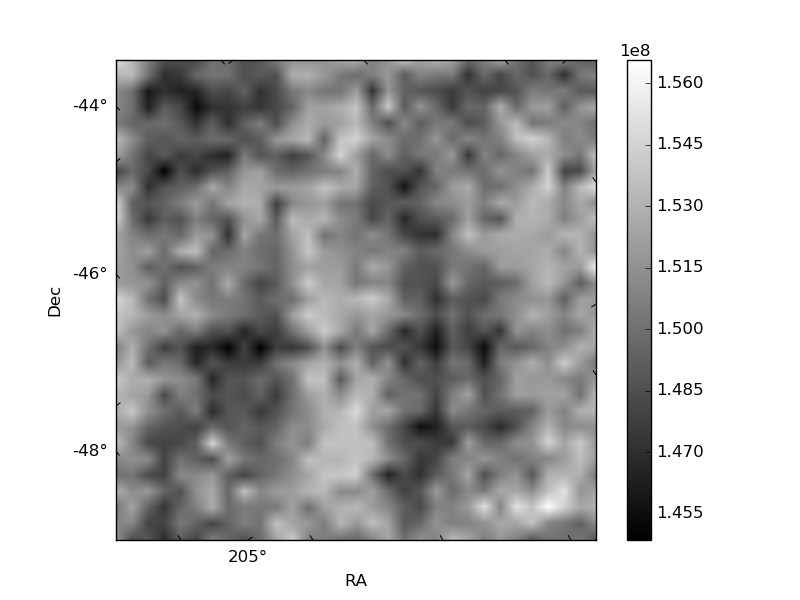
Histogram calculated using DETX and DETY for each event in the final _common_clean file
| Quadrant A | 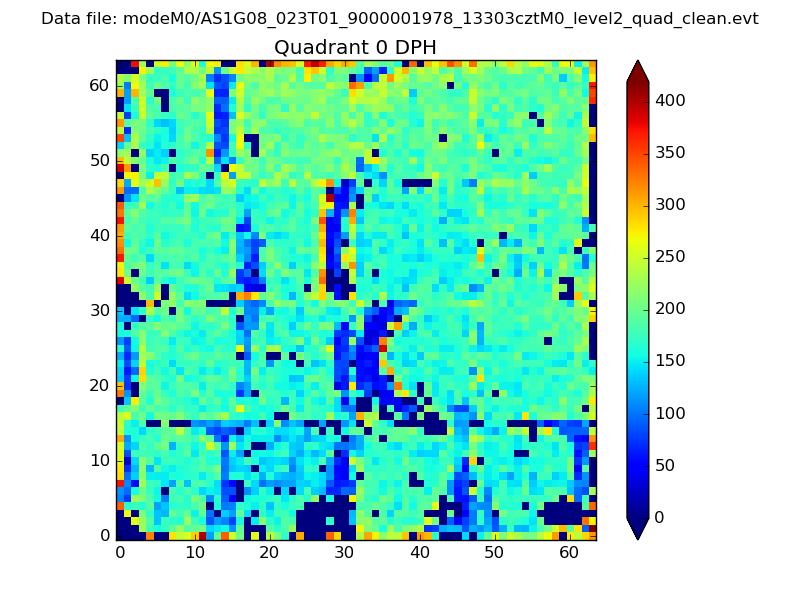 |
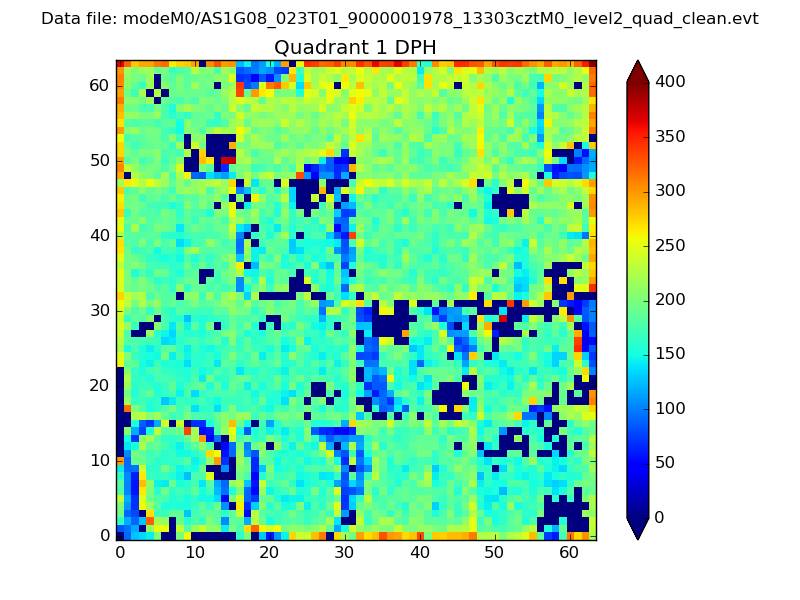 |
Quadrant B |
|---|---|---|---|
| Quadrant D | 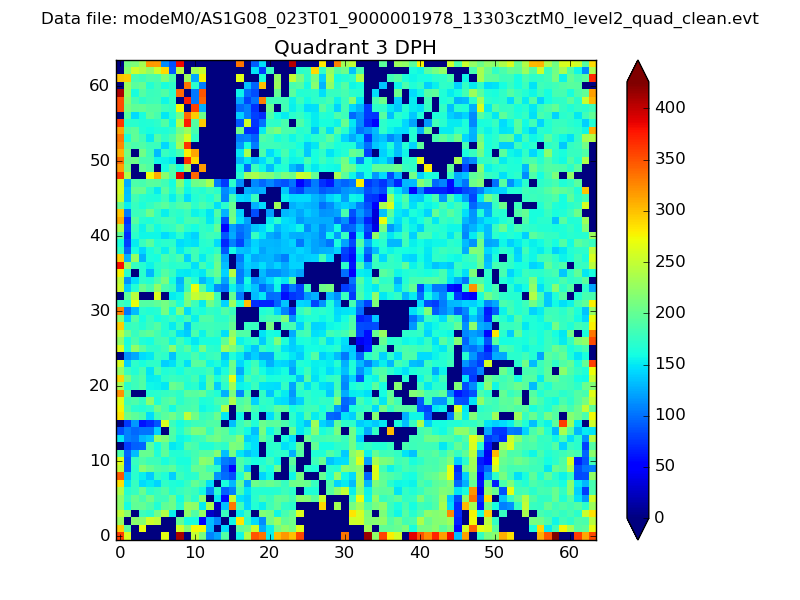 |
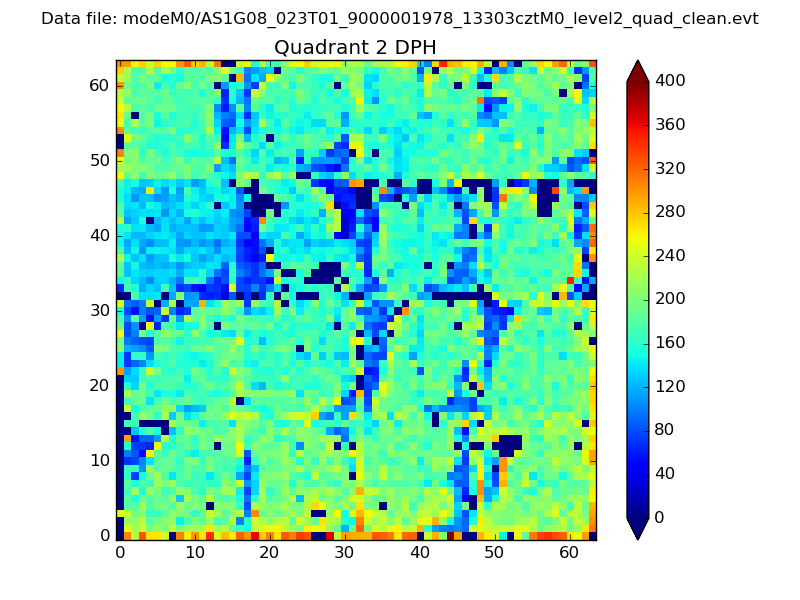 |
Quadrant C |
| Plot type | Count rate plots | Images |
|---|---|---|
| Comparison with Poisson distribution Blue bars denote a histogram of data divided into 1 sec bins. Red curve is a Poisson curve with rate = median count rate of data. |
 |
 |
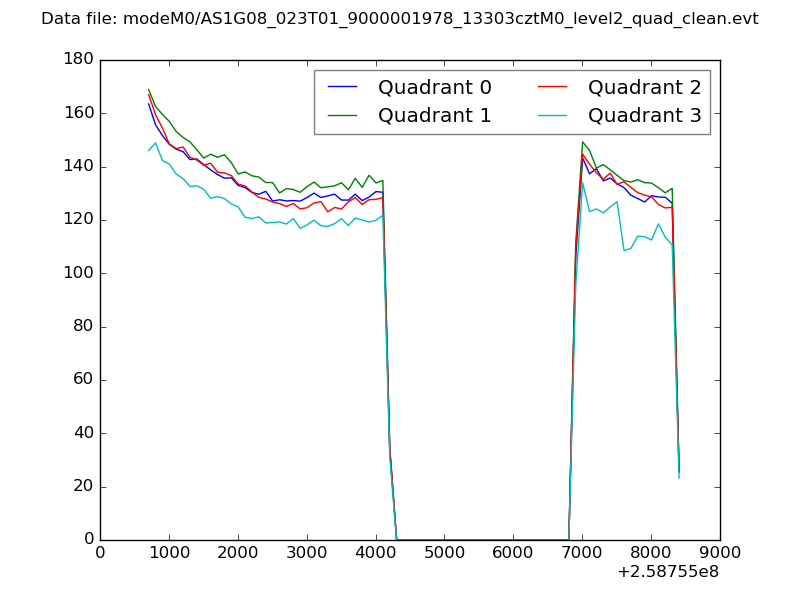
| Quadrant-wise count rates Data is divided into 100 sec bins |
 |
|
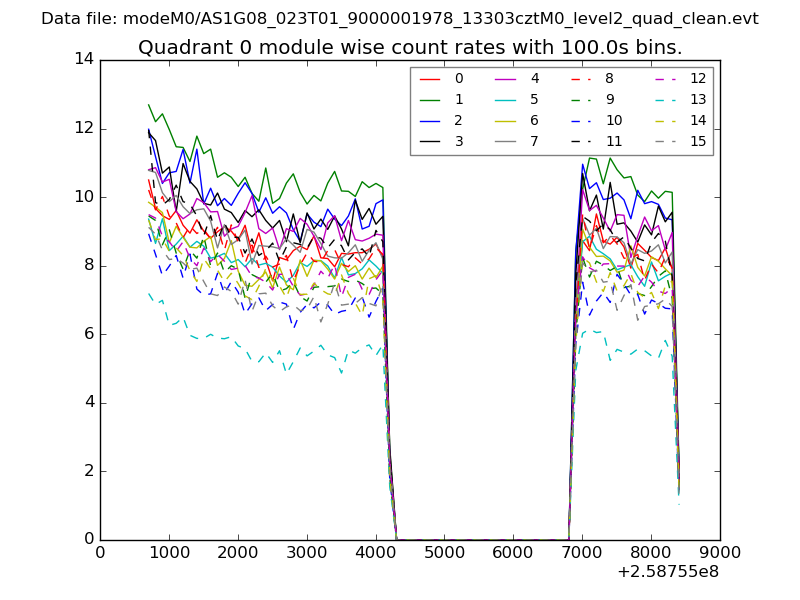
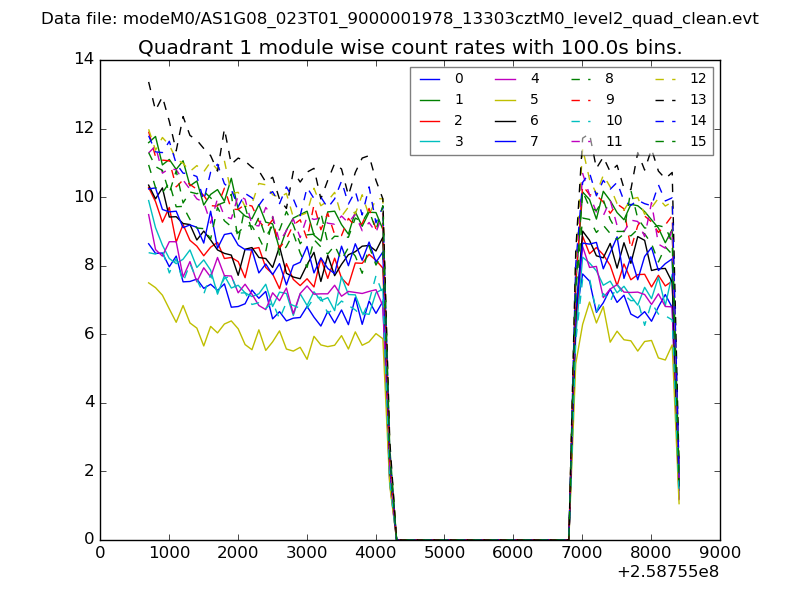
| Module-wise count rates for Quadrant A Data is divided into 100 sec bins |
 |
 |
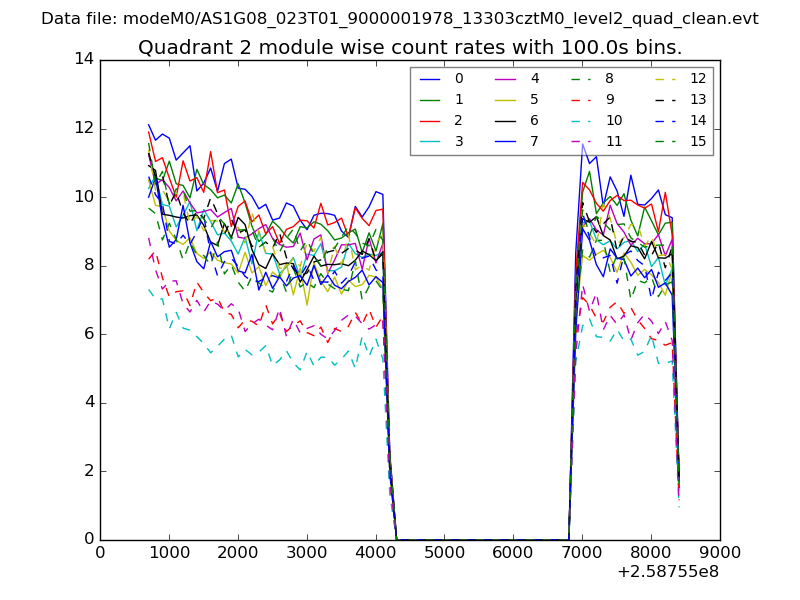
| Module-wise count rates for Quadrant B Data is divided into 100 sec bins |
 |
 |
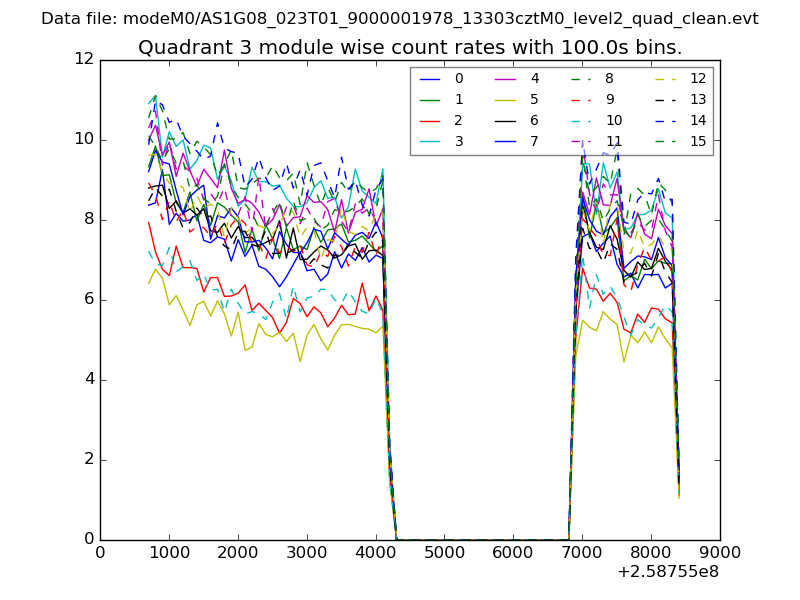
| Module-wise count rates for Quadrant C Data is divided into 100 sec bins |
 |
 |
| Module-wise count rates for Quadrant D Data is divided into 100 sec bins |
 |
 |
| Parameter | Plot |
|---|---|
| CZT HV Monitor |  |
| D_VDD | 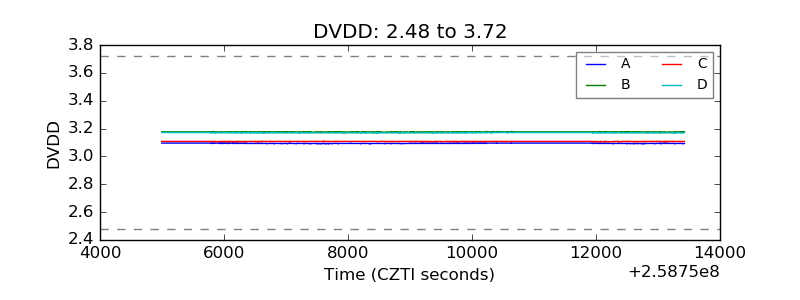 |
| Temperature 1 | 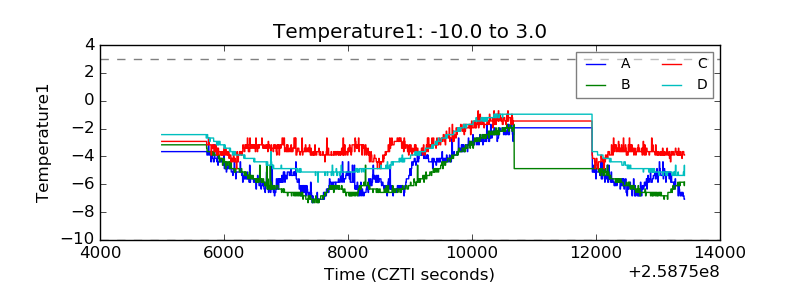 |
| Veto HV Monitor | 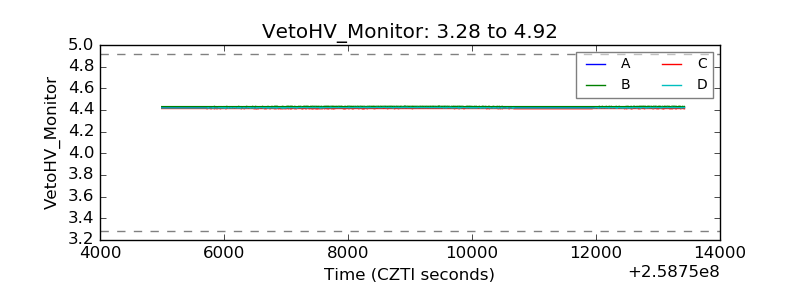 |
| Veto LLD | 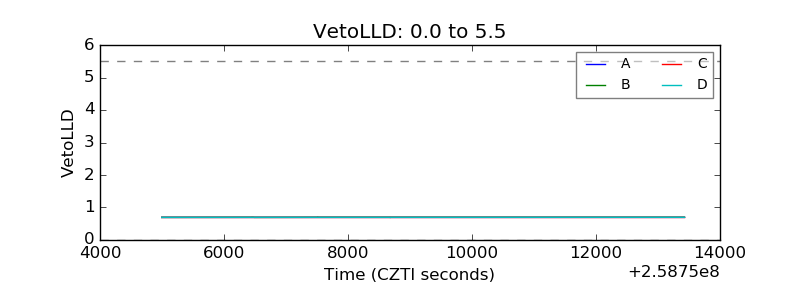 |
| Alpha Counter | 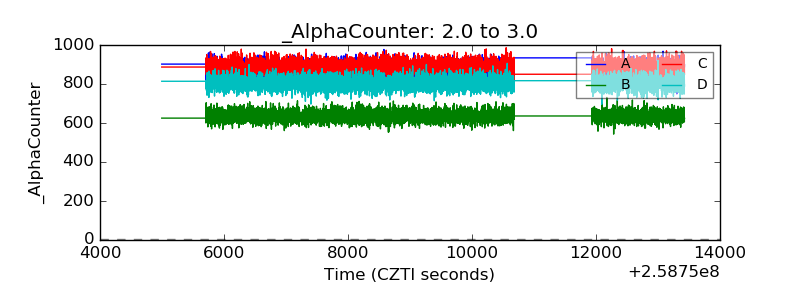 |
| _CPM_Rate | 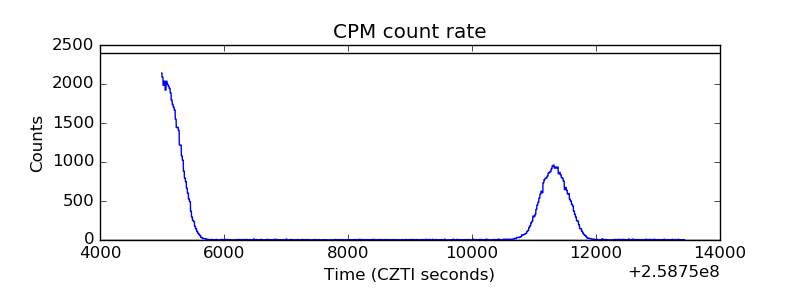 |
| CZT Counter | 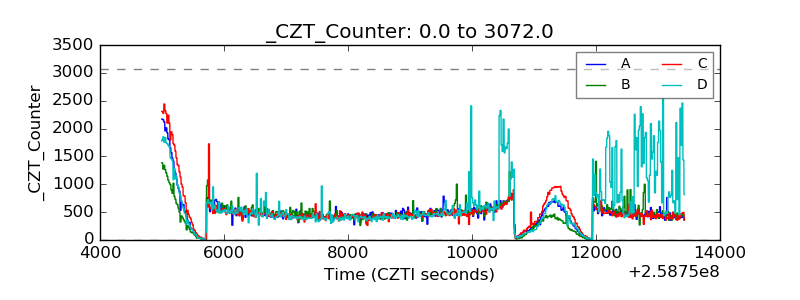 |
| +2.5 Volts monitor |  |
| +5 Volts monitor |  |
| _ROLL_ROT | 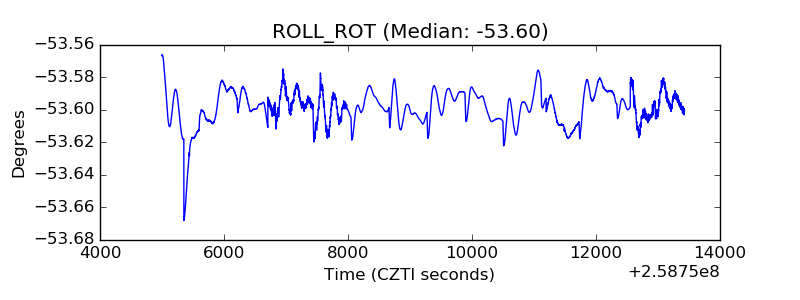 |
| _Roll_DEC | 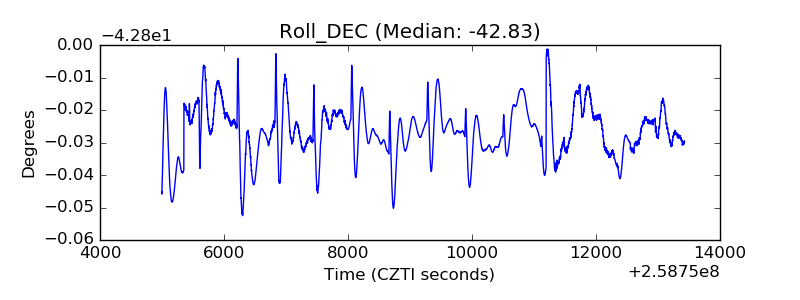 |
| _Roll_RA | 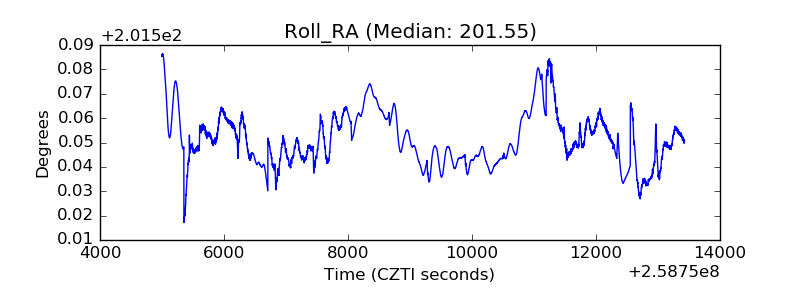 |
| Veto Counter | 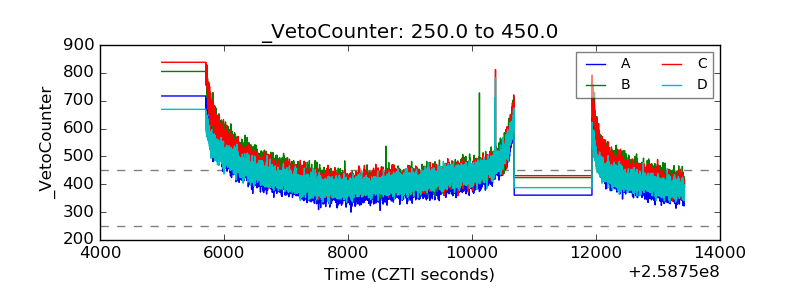 |