| Param | Original file | Final file |
|---|---|---|
| Filename | modeM0/AS1G08_023T01_9000001978_13304cztM0_level2.evt | modeM0/AS1G08_023T01_9000001978_13304cztM0_level2_quad_clean.evt |
| Size (bytes) | 598,199,040 | 96,704,640 |
| Size | 570.5 MB | 92.2 MB |
| Events in quadrant A | 3,276,767 | 625,510 |
| Events in quadrant B | 3,389,221 | 645,792 |
| Events in quadrant C | 3,142,676 | 625,140 |
| Events in quadrant D | 7,841,578 | 552,301 |
| Mode M0 | |||
|---|---|---|---|
| Quadrant | BADHDUFLAG | Total packets | Discarded packets |
| A | 0 | 14391 | 3 |
| B | 0 | 14579 | 2 |
| C | 0 | 14073 | 2 |
| D | 0 | 28204 | 2 |
| Mode SS | |||
|---|---|---|---|
| Quadrant | BADHDUFLAG | Total packets | Discarded packets |
| A | 0 | 142 | 0 |
| B | 0 | 142 | 0 |
| C | 0 | 142 | 0 |
| D | 0 | 142 | 0 |
| Mode M9 | |||
|---|---|---|---|
| Quadrant | BADHDUFLAG | Total packets | Discarded packets |
| A | 0 | 22 | 0 |
| B | 0 | 22 | 0 |
| C | 0 | 22 | 0 |
| D | 0 | 22 | 0 |
| Quadrant | Total seconds | Saturated seconds | Saturation percentage |
|---|---|---|---|
| A | 6881 | 46 | 0.668507% |
| B | 6881 | 65 | 0.944630% |
| C | 6881 | 15 | 0.217992% |
| D | 6881 | 1194 | 17.352129% |
Noise dominated data is calculated using 1-second bins in cleaned event files. If a bin has >2000 counts, and if more than 50% of those come from <1% of pixels, then it is considered to be noise-dominated and hence unusable.
| Quadrant | # 1 sec bins | Bins with >0 counts | Bins with >2000 counts | High rate bins dominated by noise | Noise dominated (total time) | Noise dominated (detector-on time) | Marked lightcurve |
|---|---|---|---|---|---|---|---|
| A | 9082 | 6884 | 6 | 6 | 0.07% | 0.09% | 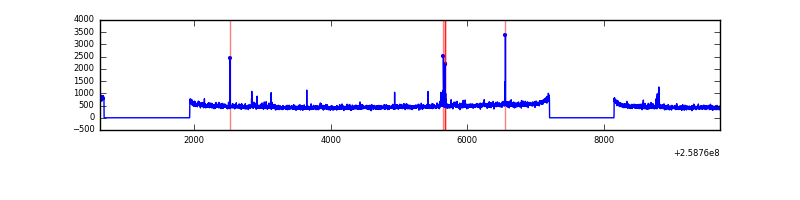 |
| B | 9082 | 6884 | 3 | 3 | 0.03% | 0.04% | 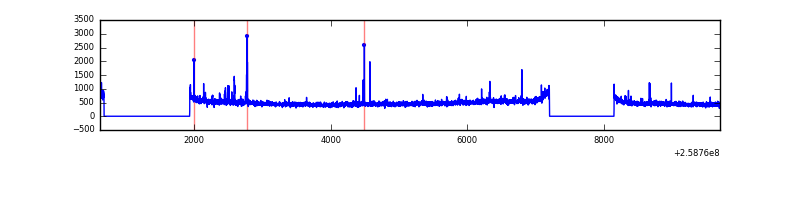 |
| C | 9082 | 6884 | 0 | 0 | 0.00% | 0.00% | 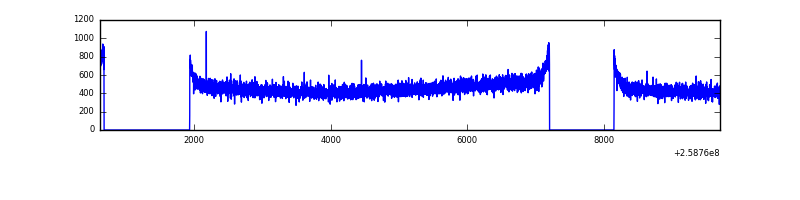 |
| D | 9082 | 6884 | 924 | 924 | 10.17% | 13.42% | 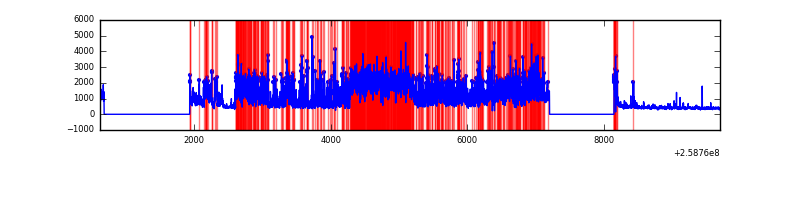 |
Top three noisy pixels from each quadrant. If the there are fewer than three noisy pixels in the level2.evt file, extra rows are filled as -1
| Pixel properties | Quadrant properties | ||||||
|---|---|---|---|---|---|---|---|
| Quadrant | DetID | PixID | Counts | Sigma | Mean | Median | Sigma |
| A | 9 | 143 | 51716 | 306.87 | 818 | 800 | 165.9 |
| A | 8 | 15 | 38093 | 224.77 | 818 | 800 | 165.9 |
| A | 1 | 162 | 19356 | 111.84 | 818 | 800 | 165.9 |
| B | 3 | 64 | 48865 | 306.27 | 829 | 806 | 156.9 |
| B | 4 | 142 | 20185 | 123.5 | 829 | 806 | 156.9 |
| B | 0 | 244 | 19144 | 116.86 | 829 | 806 | 156.9 |
| C | 13 | 61 | 5853 | 27.1 | 804 | 809 | 186.1 |
| C | 8 | 222 | 4426 | 19.43 | 804 | 809 | 186.1 |
| C | 3 | 233 | 2988 | 11.71 | 804 | 809 | 186.1 |
| D | 1 | 52 | 3496846 | 19391.82 | 751 | 730 | 180.3 |
| D | 5 | 222 | 1276962 | 7078.84 | 751 | 730 | 180.3 |
| D | 13 | 249 | 67949 | 372.84 | 751 | 730 | 180.3 |
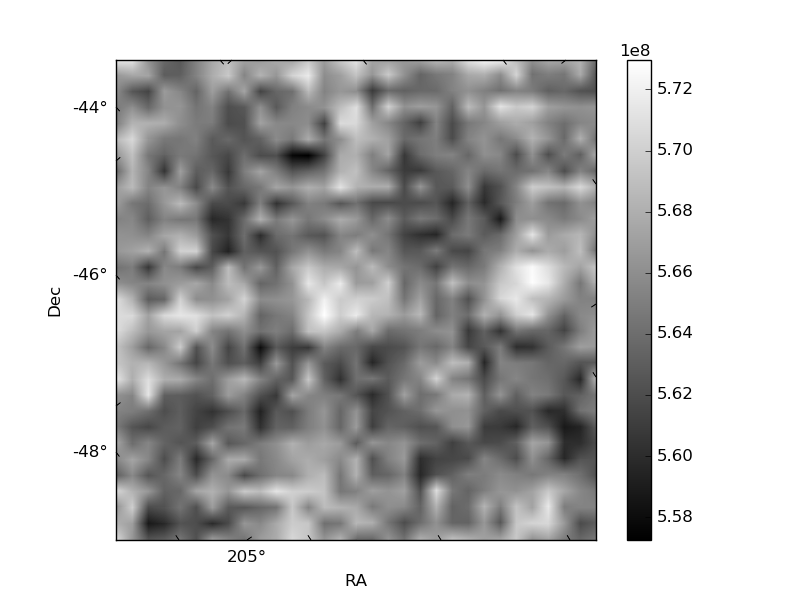
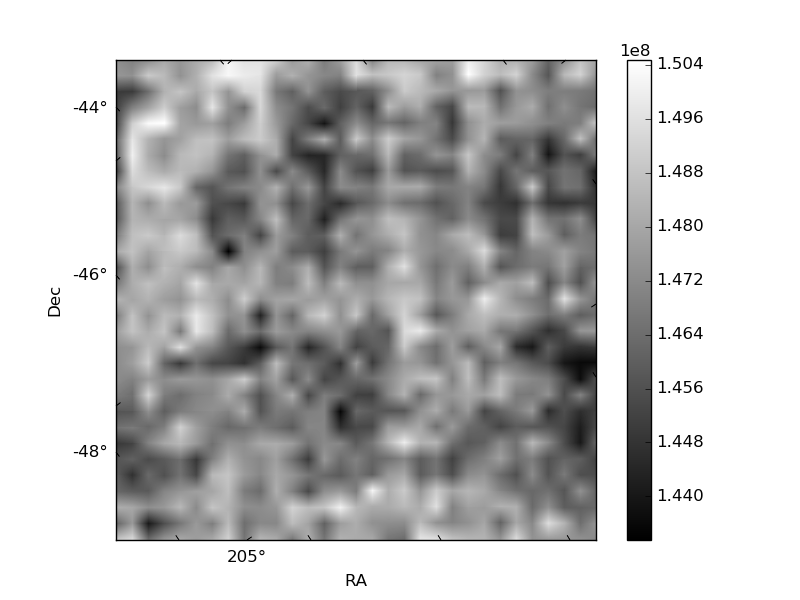
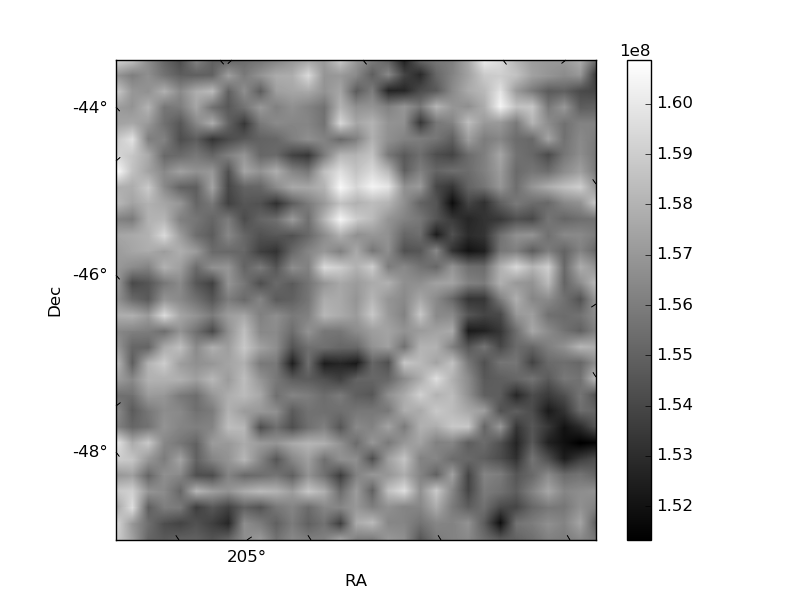
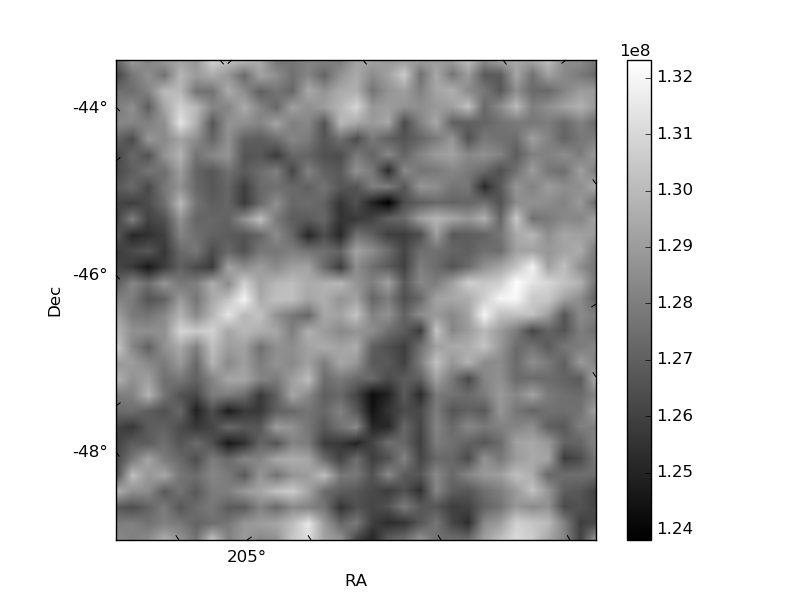
Histogram calculated using DETX and DETY for each event in the final _common_clean file
| Quadrant A | 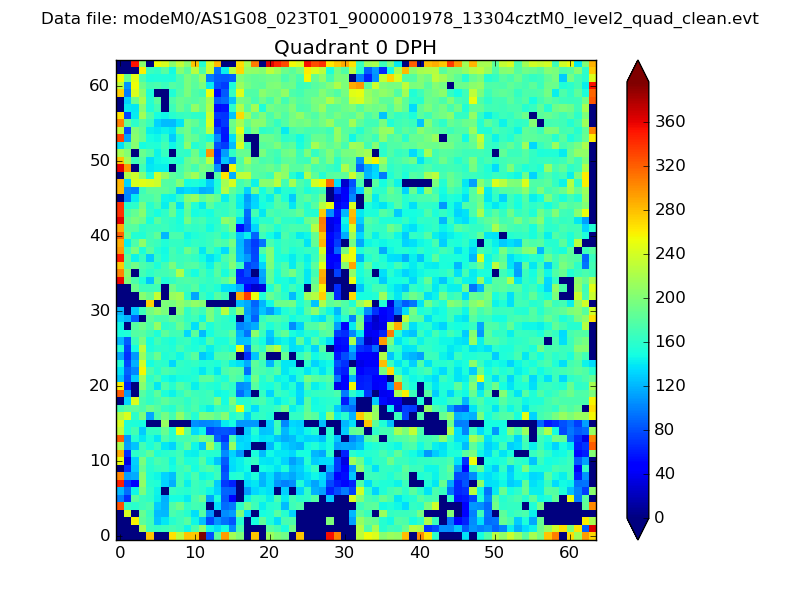 |
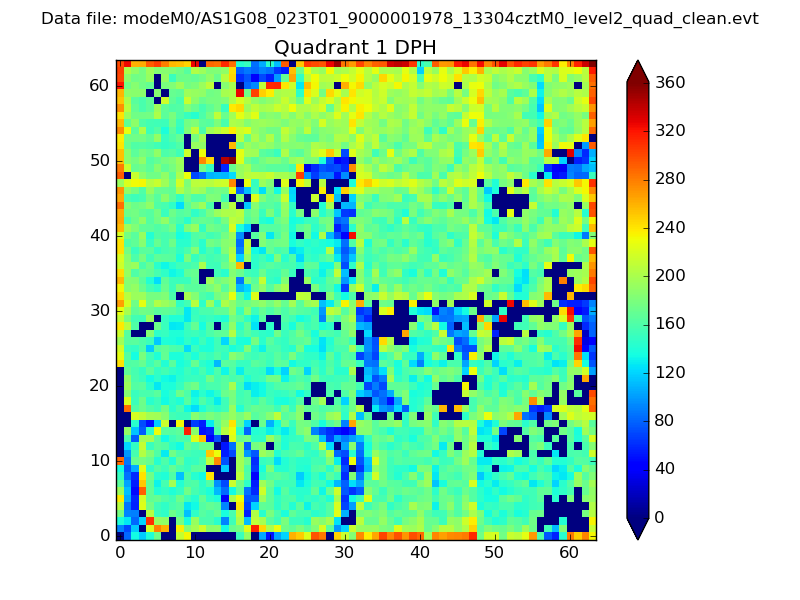 |
Quadrant B |
|---|---|---|---|
| Quadrant D | 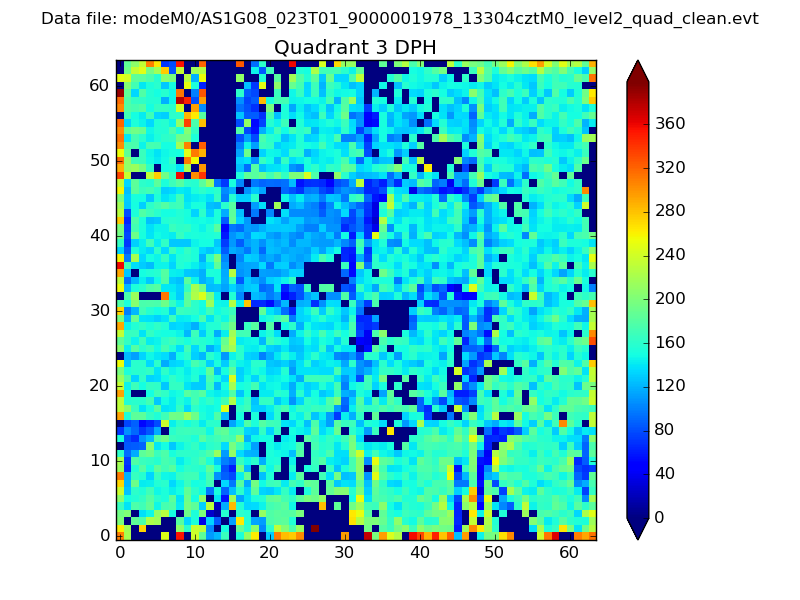 |
 |
Quadrant C |
| Plot type | Count rate plots | Images |
|---|---|---|
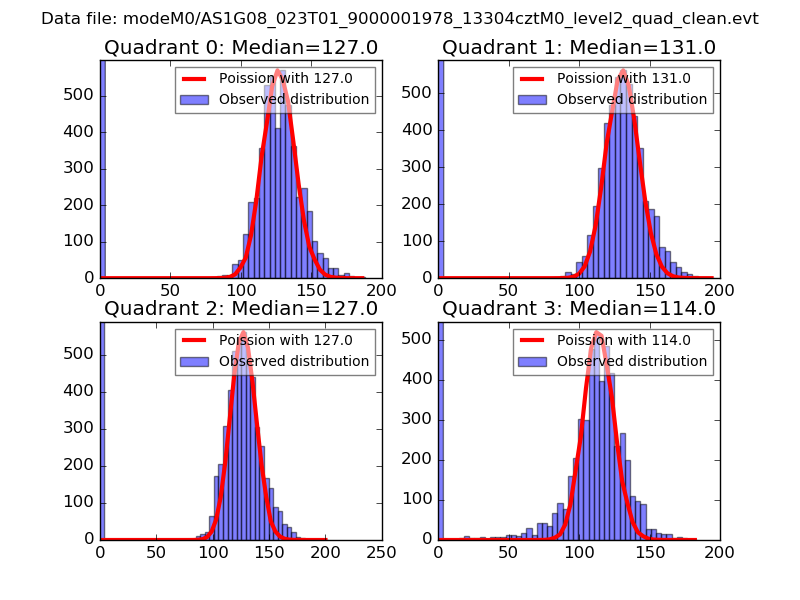
| Comparison with Poisson distribution Blue bars denote a histogram of data divided into 1 sec bins. Red curve is a Poisson curve with rate = median count rate of data. |
 |
 |
| Quadrant-wise count rates Data is divided into 100 sec bins |
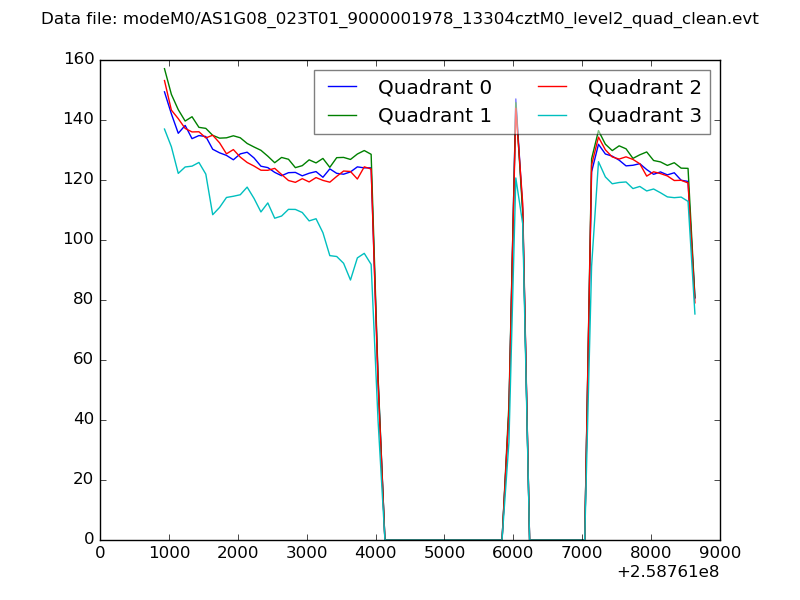 |
|
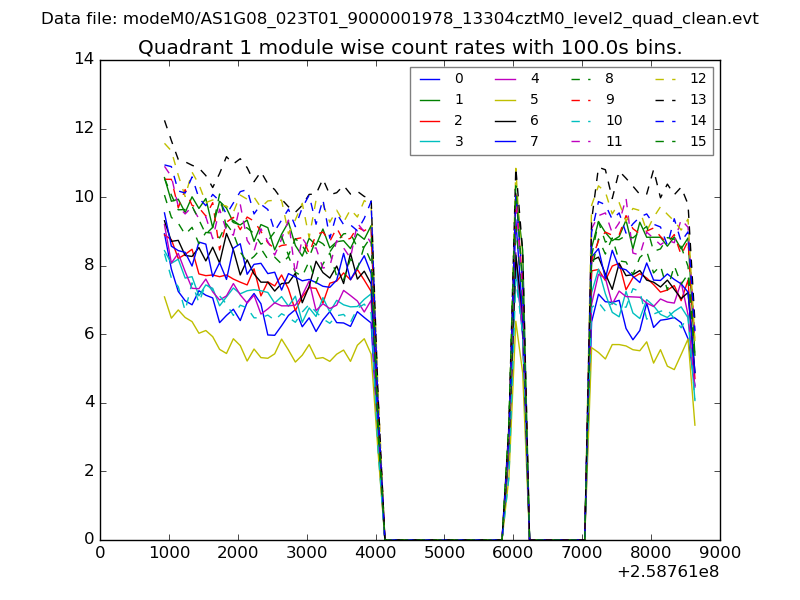
| Module-wise count rates for Quadrant A Data is divided into 100 sec bins |
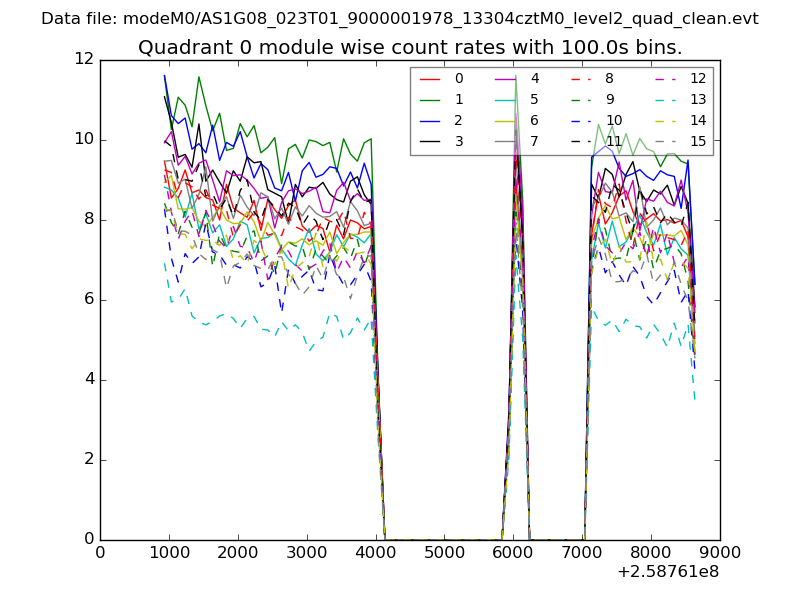 |
 |
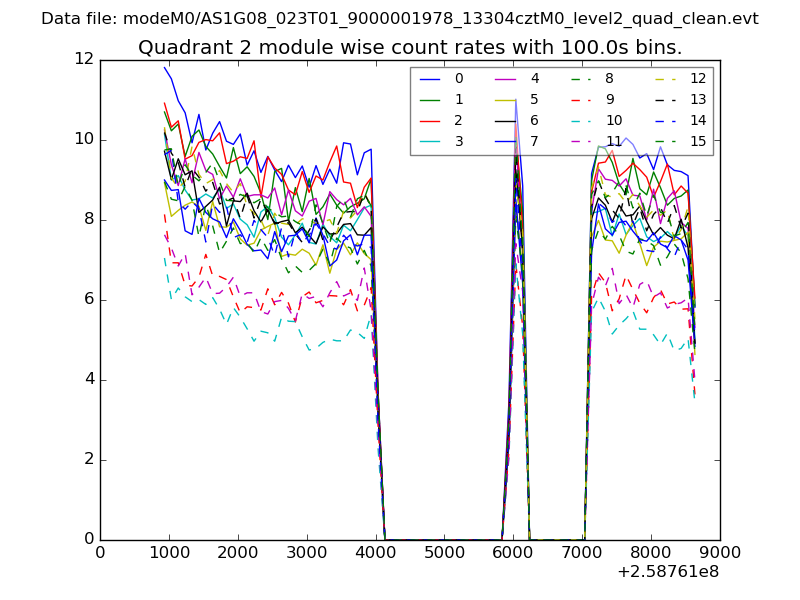
| Module-wise count rates for Quadrant B Data is divided into 100 sec bins |
 |
 |
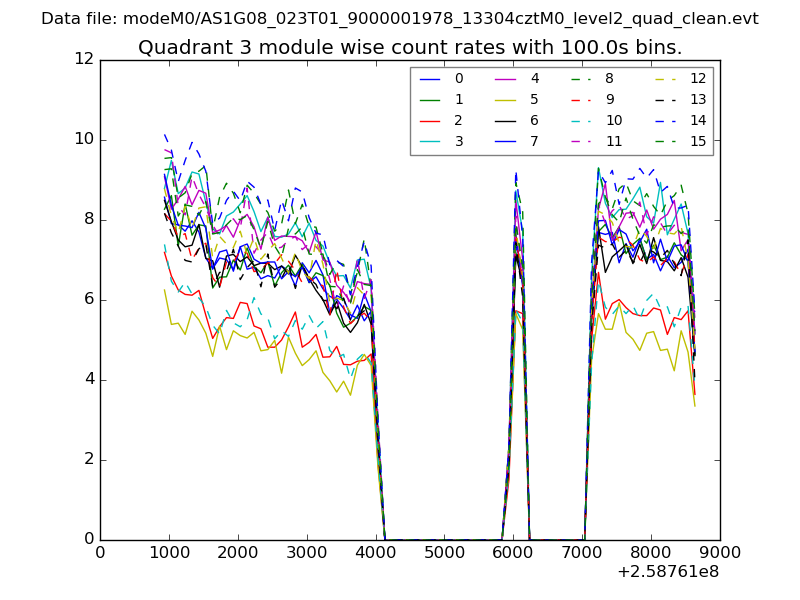
| Module-wise count rates for Quadrant C Data is divided into 100 sec bins |
 |
 |
| Module-wise count rates for Quadrant D Data is divided into 100 sec bins |
 |
 |
| Parameter | Plot |
|---|---|
| CZT HV Monitor | 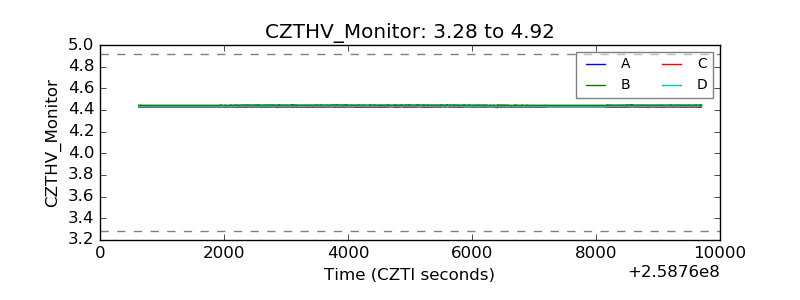 |
| D_VDD | 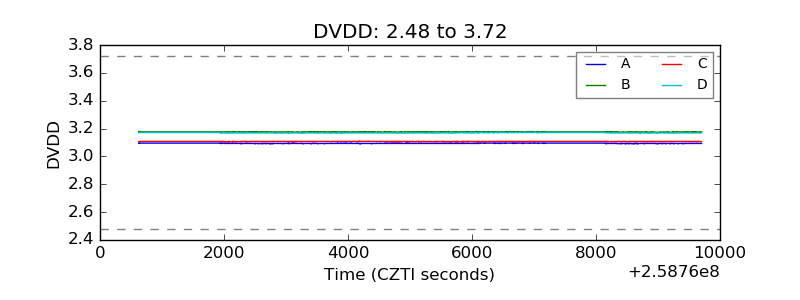 |
| Temperature 1 | 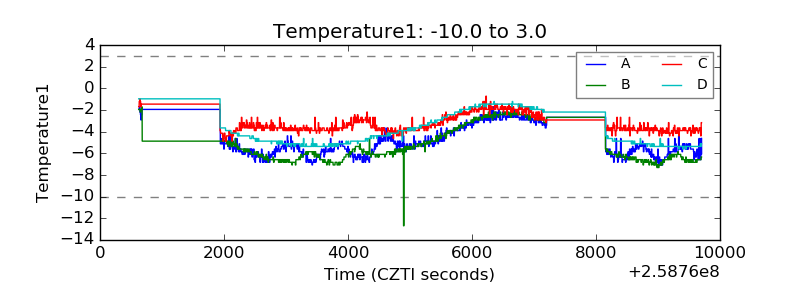 |
| Veto HV Monitor | 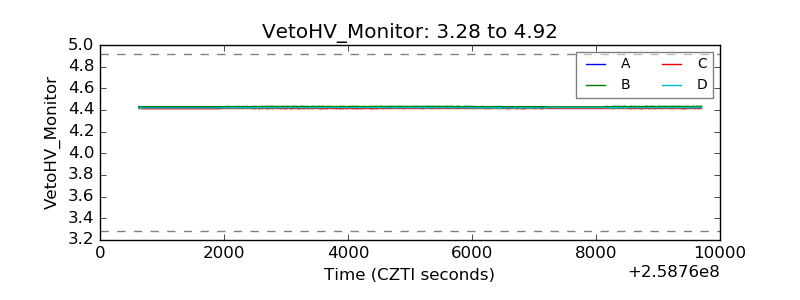 |
| Veto LLD | 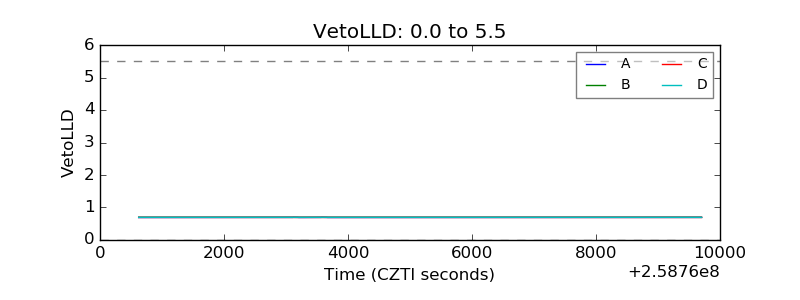 |
| Alpha Counter | 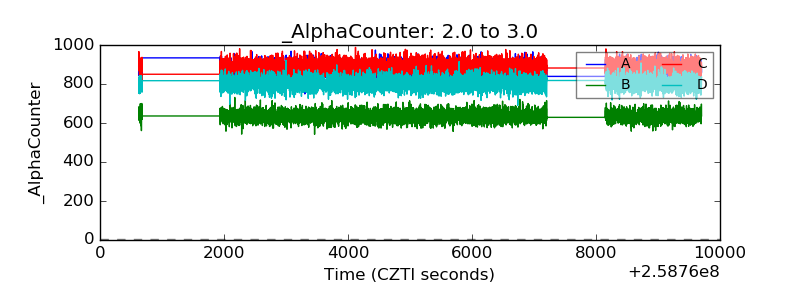 |
| _CPM_Rate | 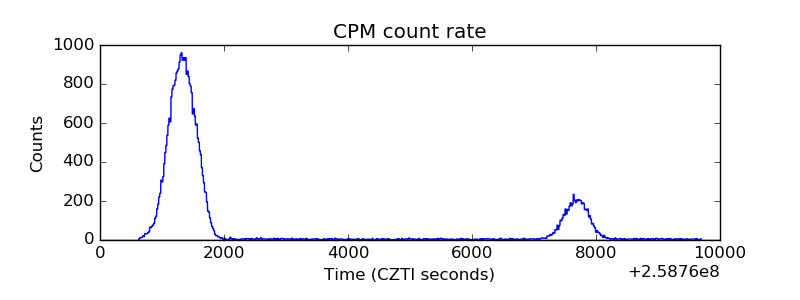 |
| CZT Counter | 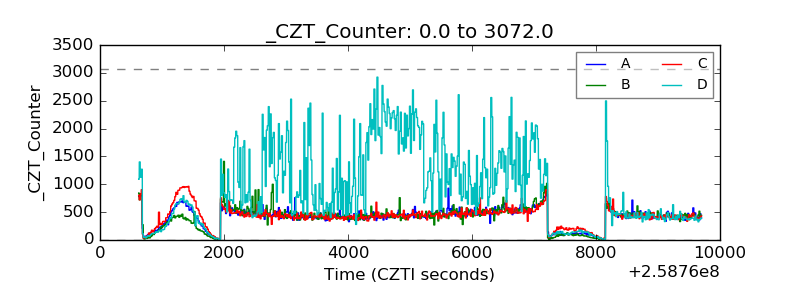 |
| +2.5 Volts monitor |  |
| +5 Volts monitor | 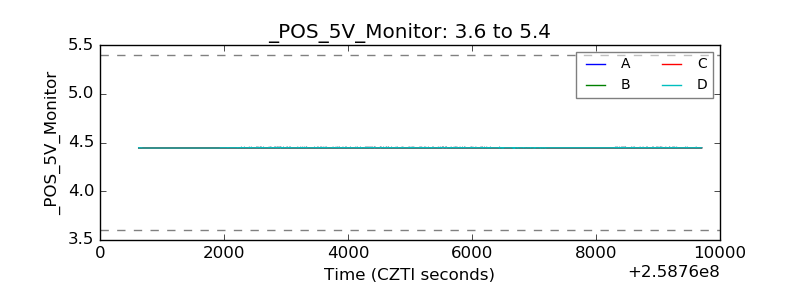 |
| _ROLL_ROT | 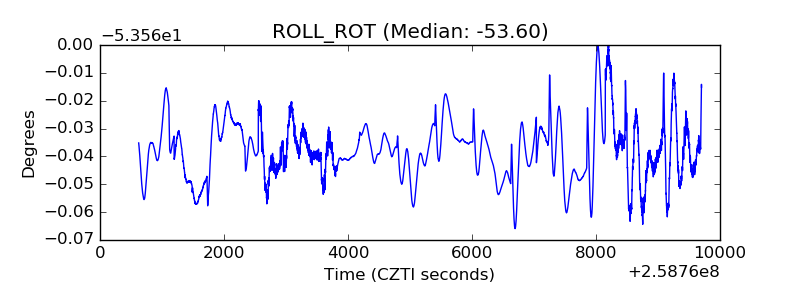 |
| _Roll_DEC | 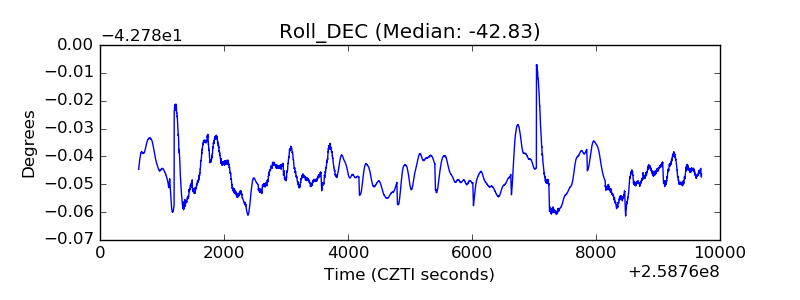 |
| _Roll_RA | 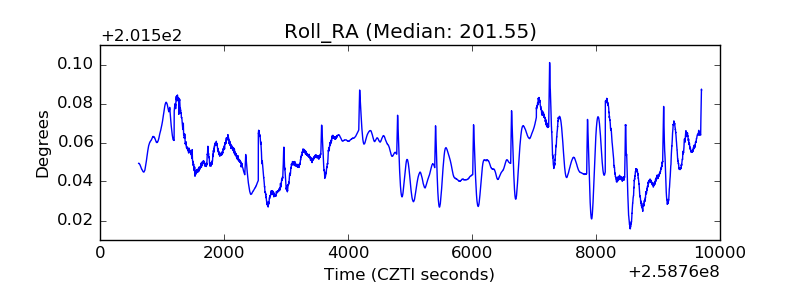 |
| Veto Counter | 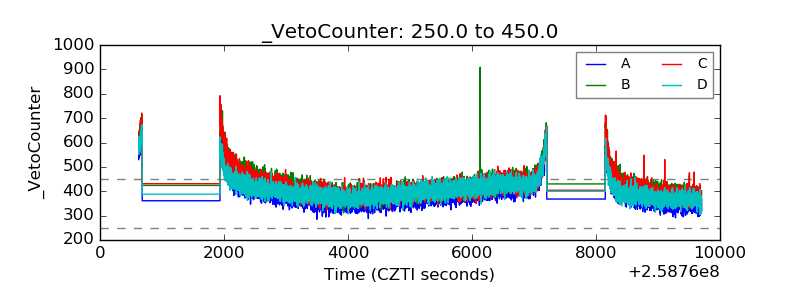 |