| Param | Original file | Final file |
|---|---|---|
| Filename | modeM0/AS1G08_023T01_9000001978_13306cztM0_level2.evt | modeM0/AS1G08_023T01_9000001978_13306cztM0_level2_quad_clean.evt |
| Size (bytes) | 594,236,160 | 133,079,040 |
| Size | 566.7 MB | 126.9 MB |
| Events in quadrant A | 4,161,280 | 861,830 |
| Events in quadrant B | 4,429,167 | 882,666 |
| Events in quadrant C | 4,090,247 | 858,898 |
| Events in quadrant D | 4,716,381 | 814,035 |
| Mode M0 | |||
|---|---|---|---|
| Quadrant | BADHDUFLAG | Total packets | Discarded packets |
| A | 0 | 18368 | 2 |
| B | 0 | 19062 | 1 |
| C | 0 | 18288 | 1 |
| D | 0 | 20220 | 1 |
| Mode SS | |||
|---|---|---|---|
| Quadrant | BADHDUFLAG | Total packets | Discarded packets |
| A | 0 | 180 | 0 |
| B | 0 | 180 | 0 |
| C | 0 | 180 | 0 |
| D | 0 | 180 | 0 |
| Mode M9 | |||
|---|---|---|---|
| Quadrant | BADHDUFLAG | Total packets | Discarded packets |
| A | 0 | 4 | 0 |
| B | 0 | 4 | 0 |
| C | 0 | 4 | 0 |
| D | 0 | 4 | 0 |
| Quadrant | Total seconds | Saturated seconds | Saturation percentage |
|---|---|---|---|
| A | 8825 | 128 | 1.450425% |
| B | 8825 | 267 | 3.025496% |
| C | 8825 | 186 | 2.107649% |
| D | 8825 | 222 | 2.515581% |
Noise dominated data is calculated using 1-second bins in cleaned event files. If a bin has >2000 counts, and if more than 50% of those come from <1% of pixels, then it is considered to be noise-dominated and hence unusable.
| Quadrant | # 1 sec bins | Bins with >0 counts | Bins with >2000 counts | High rate bins dominated by noise | Noise dominated (total time) | Noise dominated (detector-on time) | Marked lightcurve |
|---|---|---|---|---|---|---|---|
| A | 9236 | 8827 | 0 | 0 | 0.00% | 0.00% | 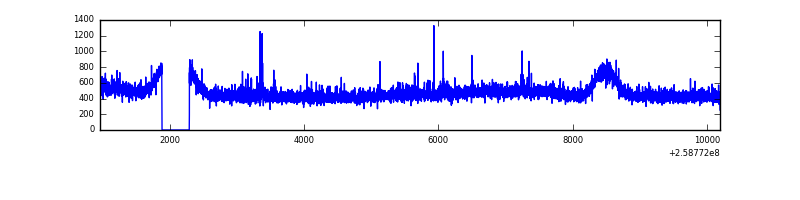 |
| B | 9236 | 8827 | 21 | 21 | 0.23% | 0.24% | 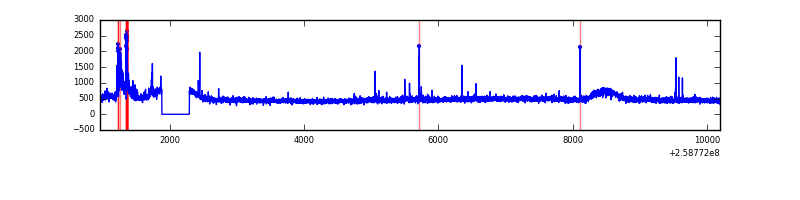 |
| C | 9236 | 8827 | 0 | 0 | 0.00% | 0.00% | 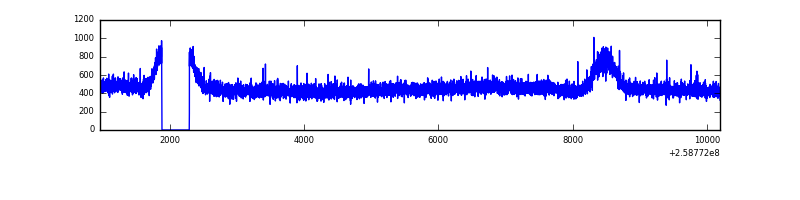 |
| D | 9236 | 8827 | 78 | 78 | 0.84% | 0.88% | 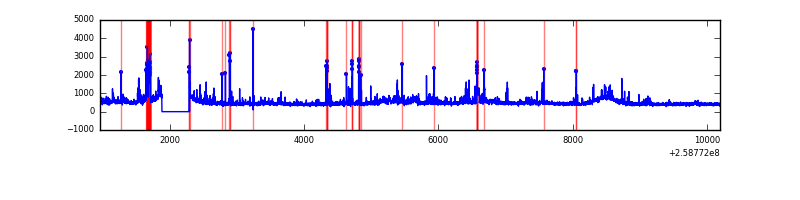 |
Top three noisy pixels from each quadrant. If the there are fewer than three noisy pixels in the level2.evt file, extra rows are filled as -1
| Pixel properties | Quadrant properties | ||||||
|---|---|---|---|---|---|---|---|
| Quadrant | DetID | PixID | Counts | Sigma | Mean | Median | Sigma |
| A | 1 | 162 | 40087 | 180.92 | 1062 | 1036 | 215.9 |
| A | 1 | 178 | 13807 | 59.17 | 1062 | 1036 | 215.9 |
| A | 1 | 161 | 12771 | 54.37 | 1062 | 1036 | 215.9 |
| B | 3 | 64 | 197620 | 961.67 | 1070 | 1040 | 204.4 |
| B | 0 | 214 | 24666 | 115.58 | 1070 | 1040 | 204.4 |
| B | 12 | 111 | 24322 | 113.9 | 1070 | 1040 | 204.4 |
| C | 13 | 61 | 7681 | 27.4 | 1046 | 1049 | 242.0 |
| C | 8 | 222 | 4153 | 12.82 | 1046 | 1049 | 242.0 |
| C | 14 | 234 | 3352 | 9.51 | 1046 | 1049 | 242.0 |
| D | 1 | 52 | 314490 | 1276.35 | 1024 | 995 | 245.6 |
| D | 13 | 249 | 277778 | 1126.89 | 1024 | 995 | 245.6 |
| D | 2 | 136 | 72385 | 290.66 | 1024 | 995 | 245.6 |
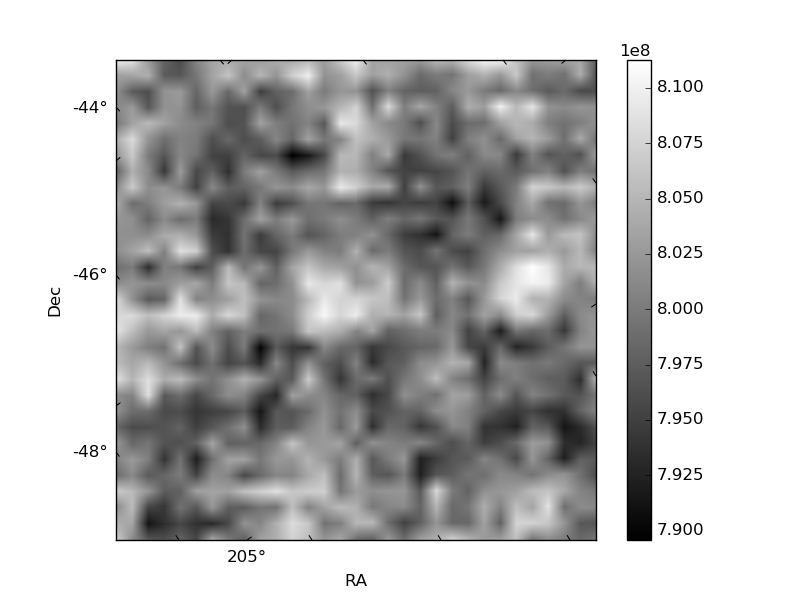
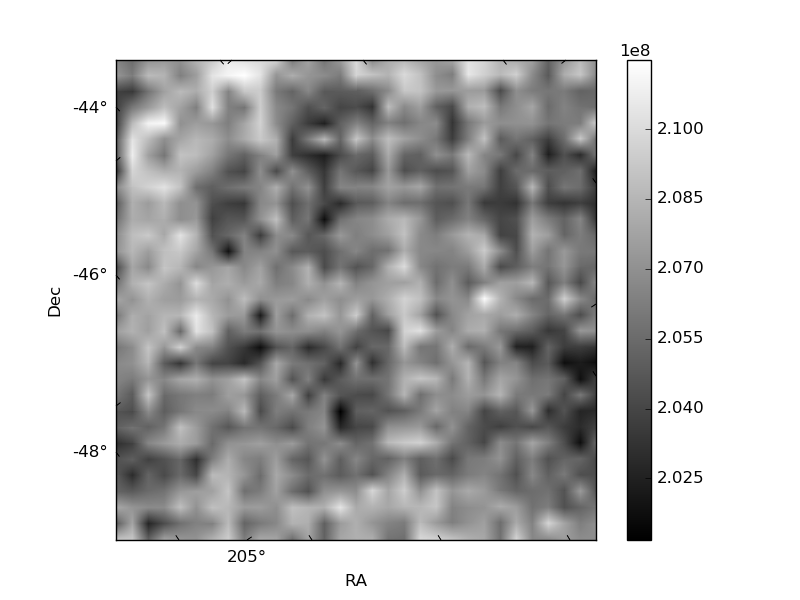
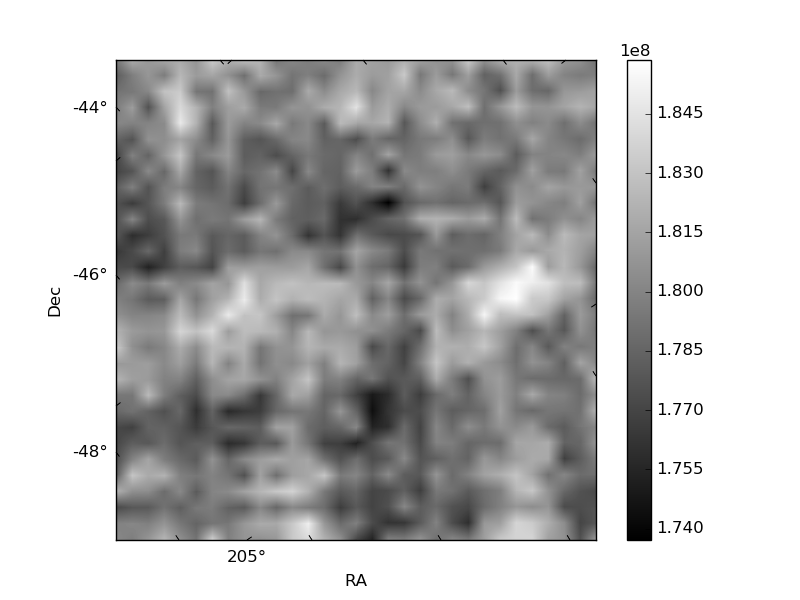
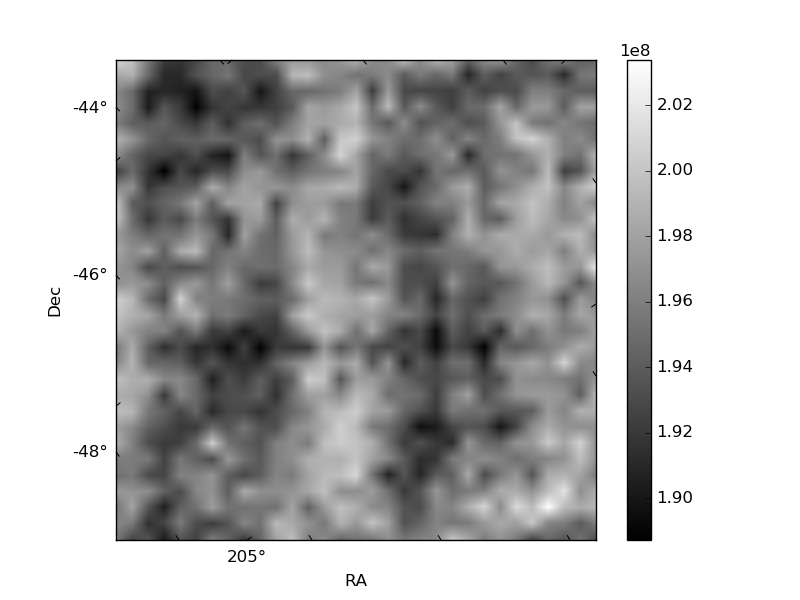
Histogram calculated using DETX and DETY for each event in the final _common_clean file
| Quadrant A | 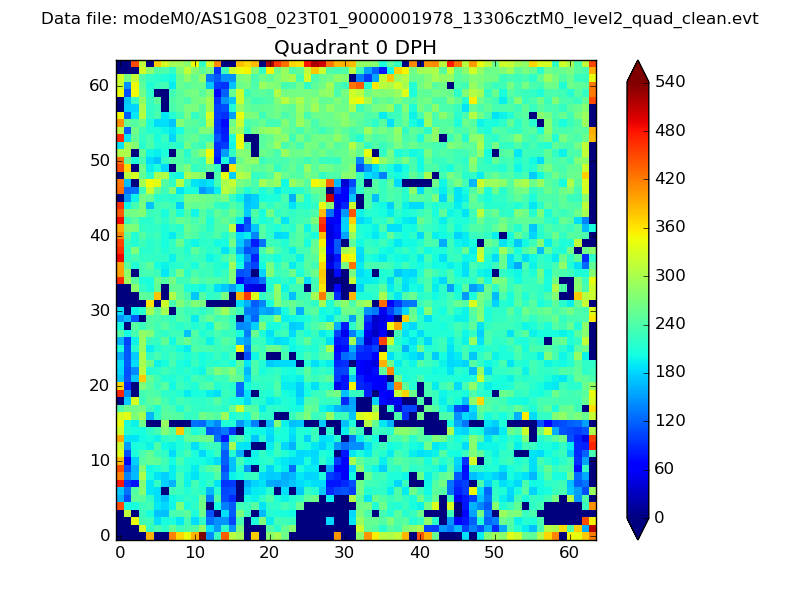 |
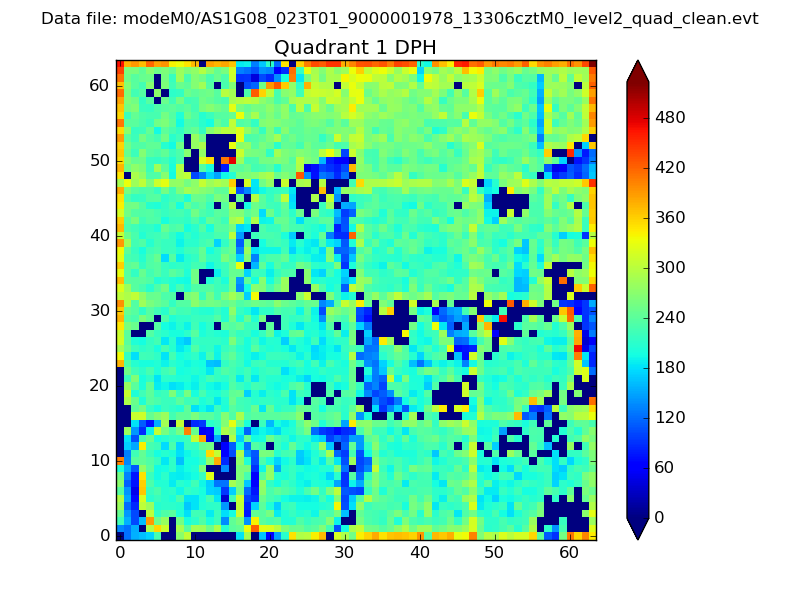 |
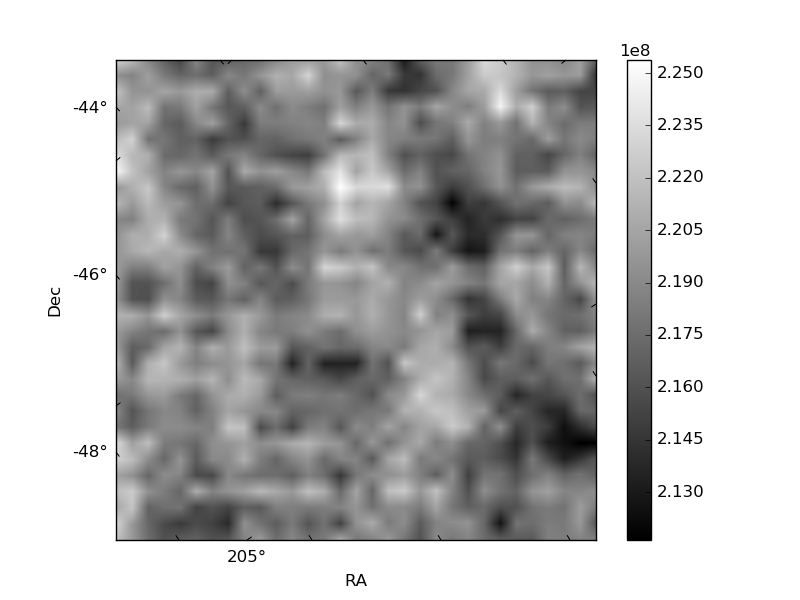
Quadrant B |
|---|---|---|---|
| Quadrant D | 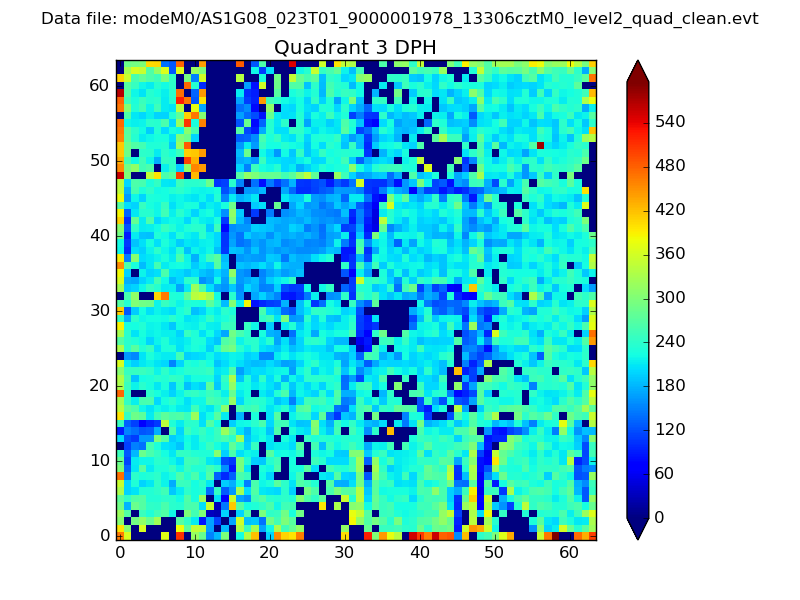 |
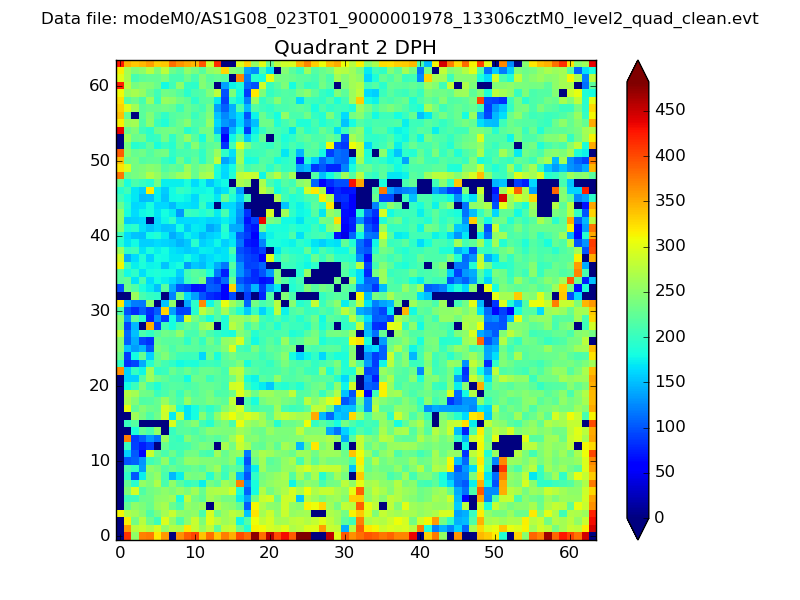 |
Quadrant C |
| Plot type | Count rate plots | Images |
|---|---|---|
| Comparison with Poisson distribution Blue bars denote a histogram of data divided into 1 sec bins. Red curve is a Poisson curve with rate = median count rate of data. |
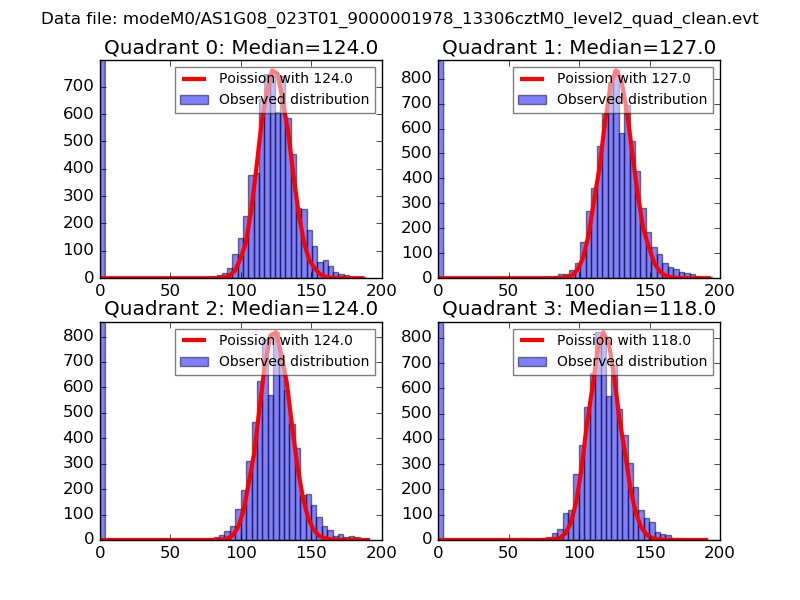 |
 |
| Quadrant-wise count rates Data is divided into 100 sec bins |
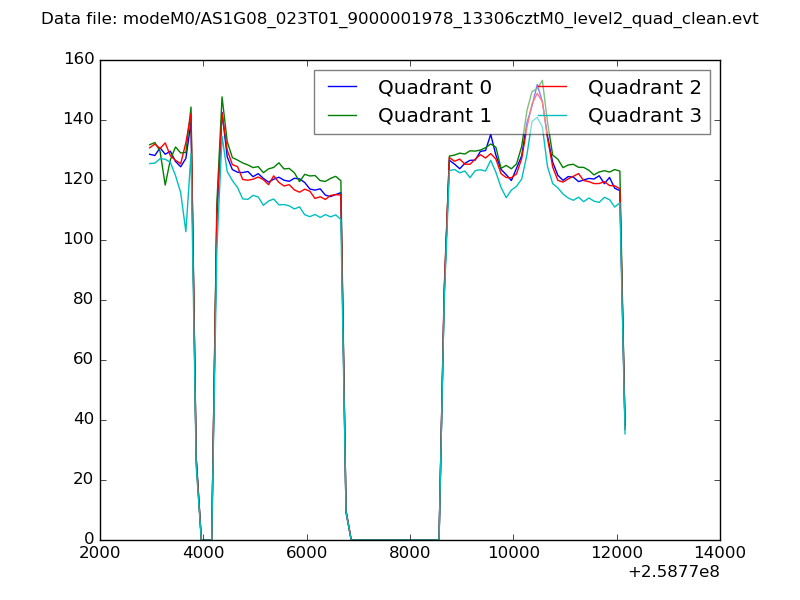 |
|
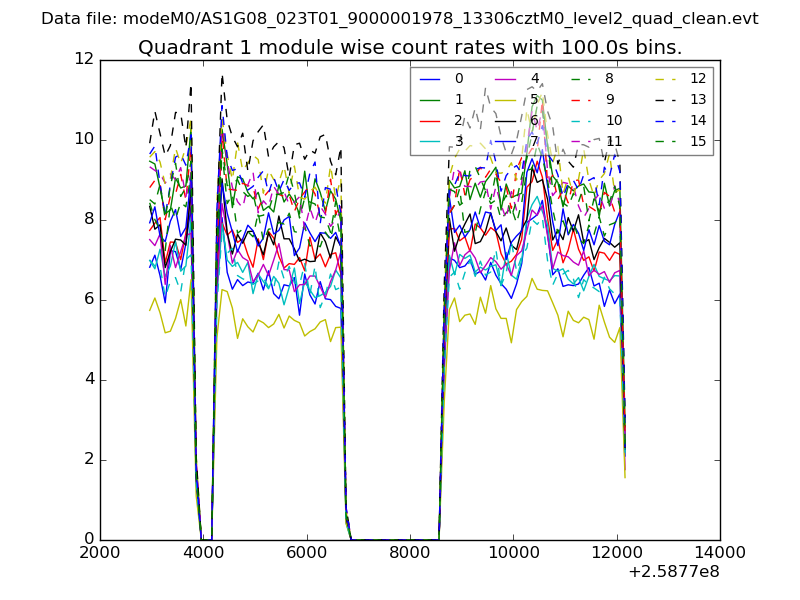
| Module-wise count rates for Quadrant A Data is divided into 100 sec bins |
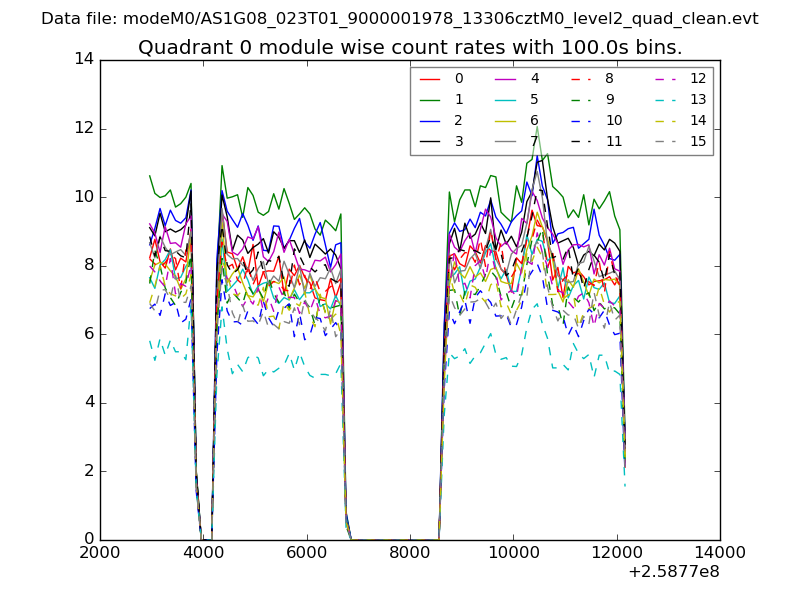 |
 |
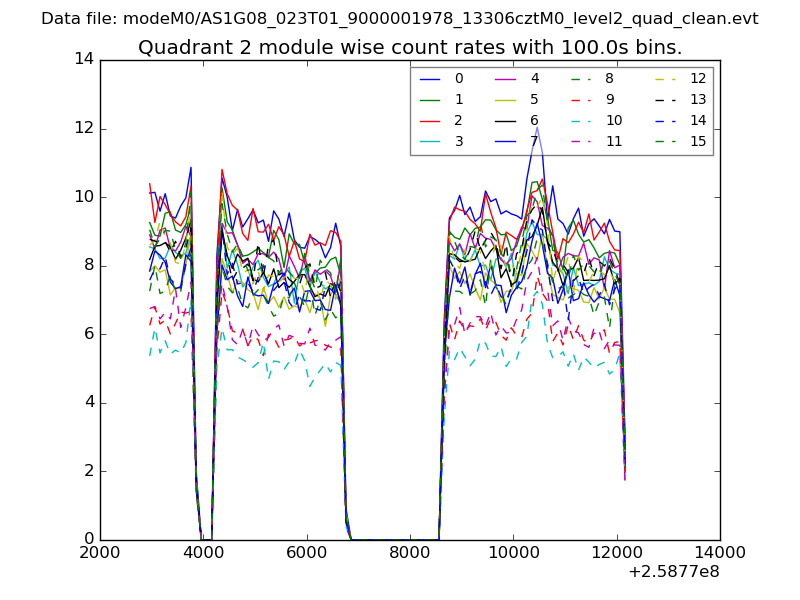
| Module-wise count rates for Quadrant B Data is divided into 100 sec bins |
 |
 |
| Module-wise count rates for Quadrant C Data is divided into 100 sec bins |
 |
 |
| Module-wise count rates for Quadrant D Data is divided into 100 sec bins |
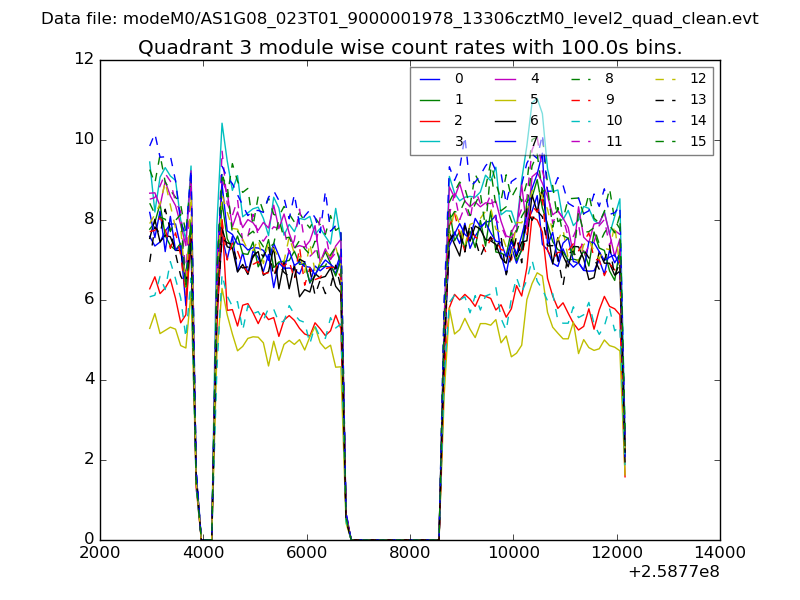 |
 |
| Parameter | Plot |
|---|---|
| CZT HV Monitor | 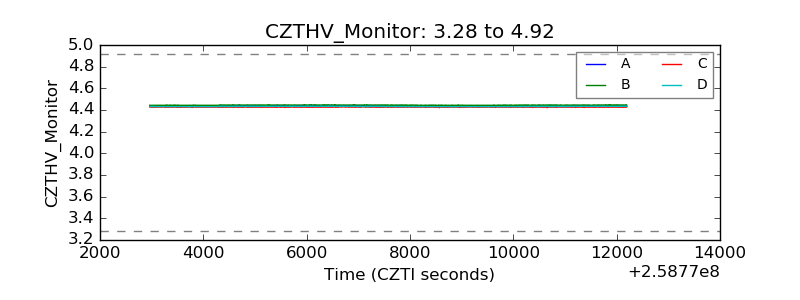 |
| D_VDD | 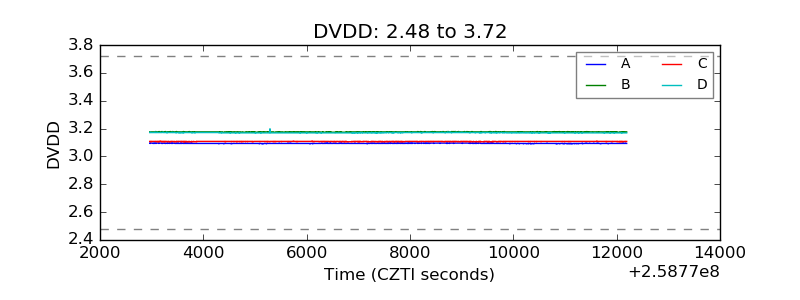 |
| Temperature 1 | 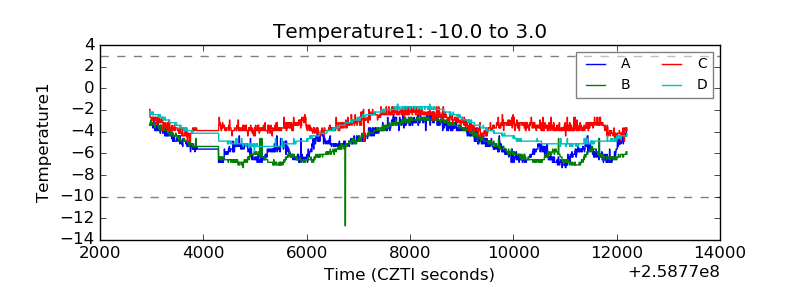 |
| Veto HV Monitor | 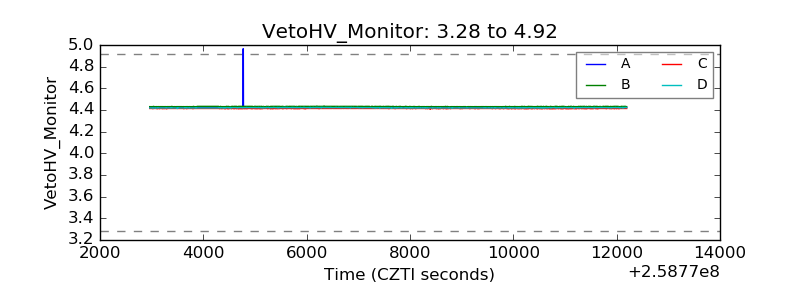 |
| Veto LLD | 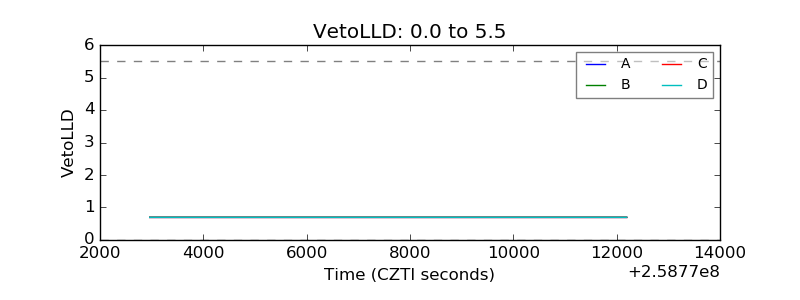 |
| Alpha Counter | 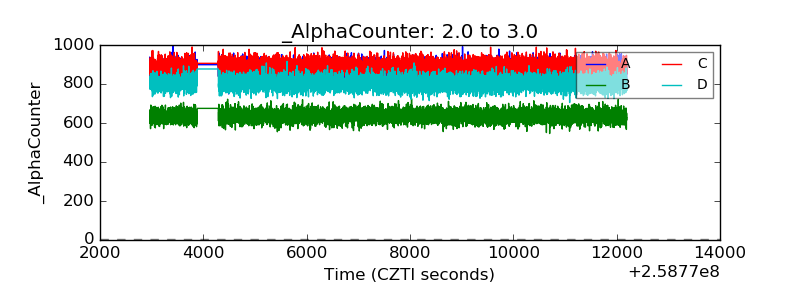 |
| _CPM_Rate | 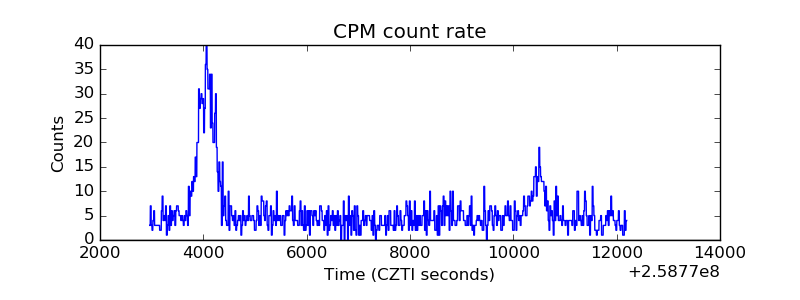 |
| CZT Counter | 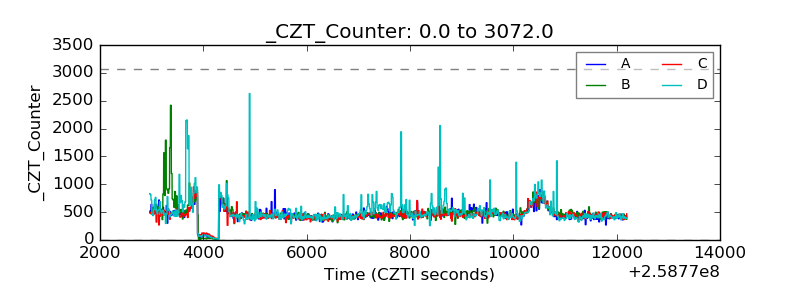 |
| +2.5 Volts monitor | 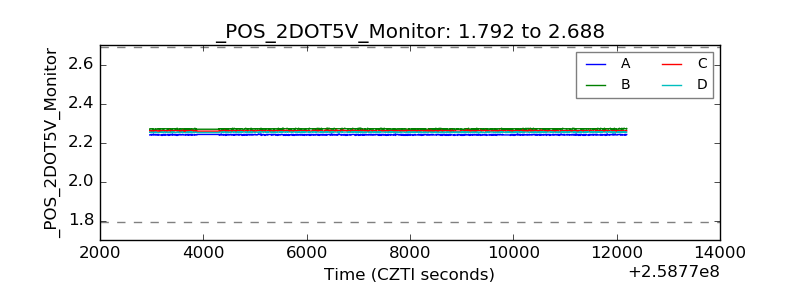 |
| +5 Volts monitor | 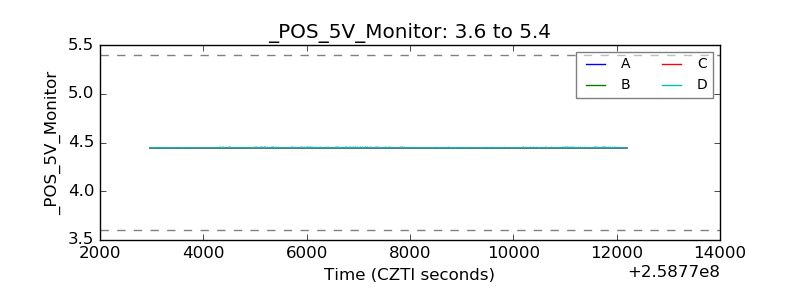 |
| _ROLL_ROT |  |
| _Roll_DEC | 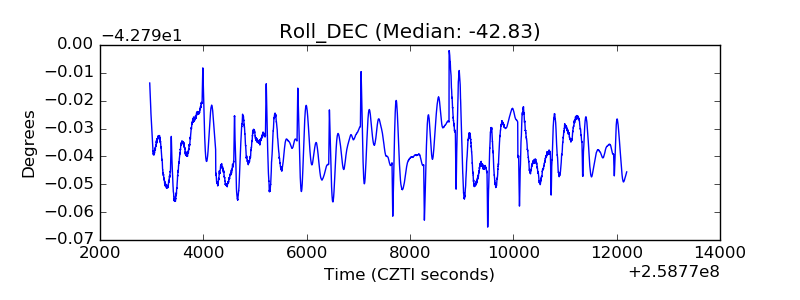 |
| _Roll_RA | 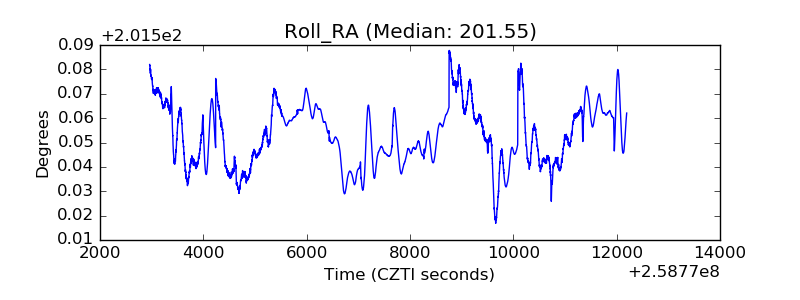 |
| Veto Counter | 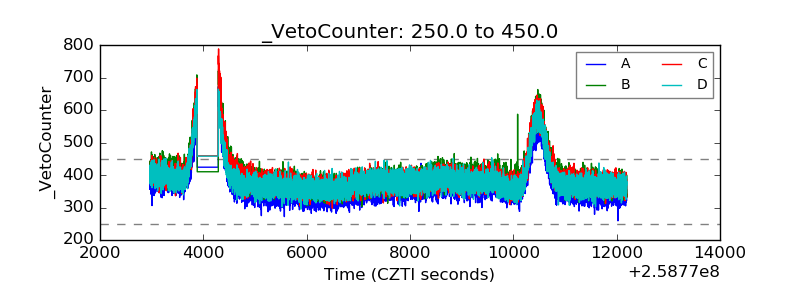 |