| Param | Original file | Final file |
|---|---|---|
| Filename | modeM0/AS1G08_023T01_9000001978_13307cztM0_level2.evt | modeM0/AS1G08_023T01_9000001978_13307cztM0_level2_quad_clean.evt |
| Size (bytes) | 558,213,120 | 120,677,760 |
| Size | 532.4 MB | 115.1 MB |
| Events in quadrant A | 3,926,860 | 776,791 |
| Events in quadrant B | 4,800,810 | 789,063 |
| Events in quadrant C | 3,819,413 | 775,738 |
| Events in quadrant D | 3,799,307 | 741,151 |
| Mode M0 | |||
|---|---|---|---|
| Quadrant | BADHDUFLAG | Total packets | Discarded packets |
| A | 0 | 17273 | 2 |
| B | 0 | 19842 | 1 |
| C | 0 | 17114 | 1 |
| D | 0 | 17317 | 1 |
| Mode SS | |||
|---|---|---|---|
| Quadrant | BADHDUFLAG | Total packets | Discarded packets |
| A | 0 | 168 | 0 |
| B | 0 | 168 | 0 |
| C | 0 | 168 | 0 |
| D | 0 | 168 | 0 |
| Mode M9 | |||
|---|---|---|---|
| Quadrant | BADHDUFLAG | Total packets | Discarded packets |
| A | 0 | 2 | 0 |
| B | 0 | 2 | 0 |
| C | 0 | 2 | 0 |
| D | 0 | 2 | 0 |
| Quadrant | Total seconds | Saturated seconds | Saturation percentage |
|---|---|---|---|
| A | 8229 | 222 | 2.697776% |
| B | 8229 | 563 | 6.841658% |
| C | 8229 | 245 | 2.977275% |
| D | 8229 | 202 | 2.454733% |
Noise dominated data is calculated using 1-second bins in cleaned event files. If a bin has >2000 counts, and if more than 50% of those come from <1% of pixels, then it is considered to be noise-dominated and hence unusable.
| Quadrant | # 1 sec bins | Bins with >0 counts | Bins with >2000 counts | High rate bins dominated by noise | Noise dominated (total time) | Noise dominated (detector-on time) | Marked lightcurve |
|---|---|---|---|---|---|---|---|
| A | 8389 | 8232 | 0 | 0 | 0.00% | 0.00% | 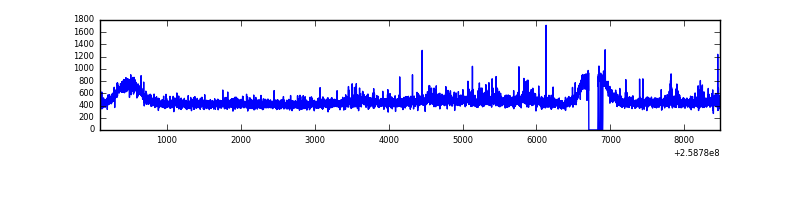 |
| B | 8389 | 8232 | 130 | 130 | 1.55% | 1.58% | 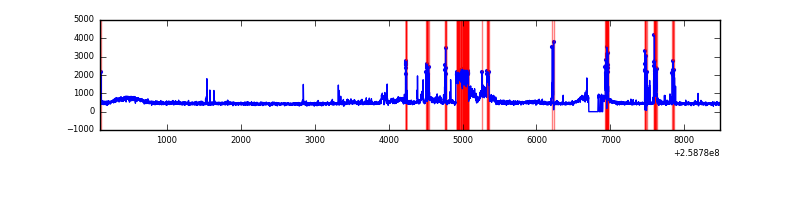 |
| C | 8389 | 8232 | 0 | 0 | 0.00% | 0.00% | 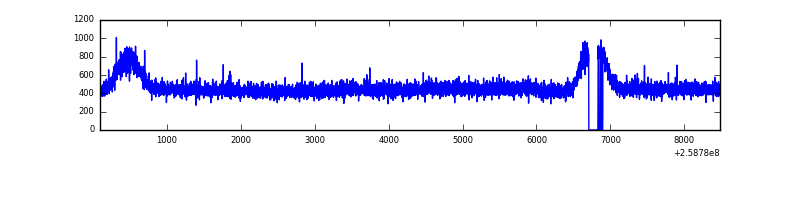 |
| D | 8389 | 8232 | 4 | 4 | 0.05% | 0.05% | 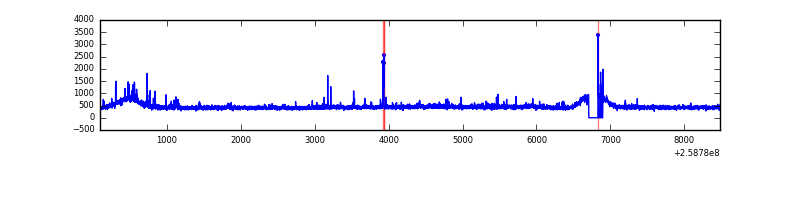 |
Top three noisy pixels from each quadrant. If the there are fewer than three noisy pixels in the level2.evt file, extra rows are filled as -1
| Pixel properties | Quadrant properties | ||||||
|---|---|---|---|---|---|---|---|
| Quadrant | DetID | PixID | Counts | Sigma | Mean | Median | Sigma |
| A | 1 | 162 | 60499 | 292.09 | 989 | 962 | 203.8 |
| A | 1 | 178 | 21761 | 102.04 | 989 | 962 | 203.8 |
| A | 1 | 161 | 19908 | 92.95 | 989 | 962 | 203.8 |
| B | 3 | 64 | 796434 | 4196.06 | 984 | 956 | 189.6 |
| B | 4 | 142 | 99782 | 521.3 | 984 | 956 | 189.6 |
| B | 3 | 209 | 23299 | 117.86 | 984 | 956 | 189.6 |
| C | 13 | 61 | 7128 | 27.11 | 977 | 979 | 226.8 |
| C | 8 | 222 | 5665 | 20.66 | 977 | 979 | 226.8 |
| C | 14 | 234 | 3251 | 10.02 | 977 | 979 | 226.8 |
| D | 2 | 136 | 44755 | 187.61 | 962 | 931 | 233.6 |
| D | 5 | 222 | 36067 | 150.42 | 962 | 931 | 233.6 |
| D | 8 | 195 | 35877 | 149.61 | 962 | 931 | 233.6 |
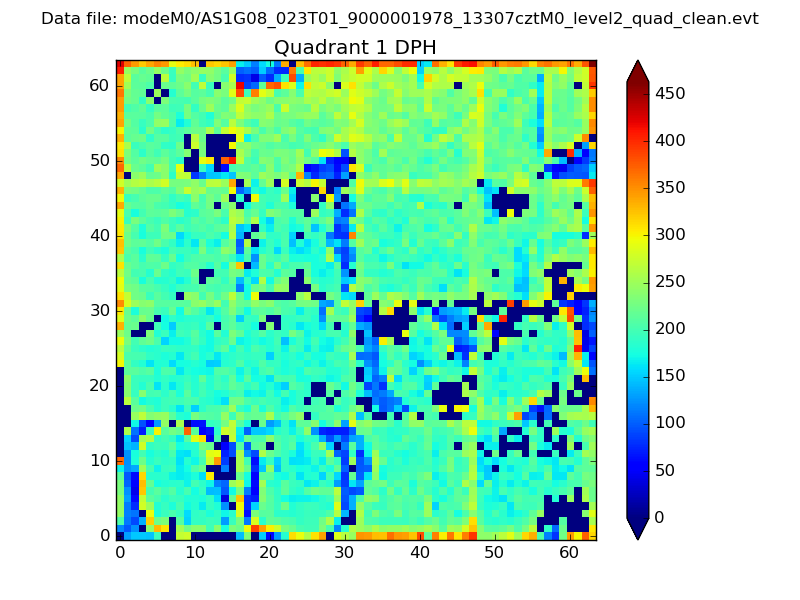
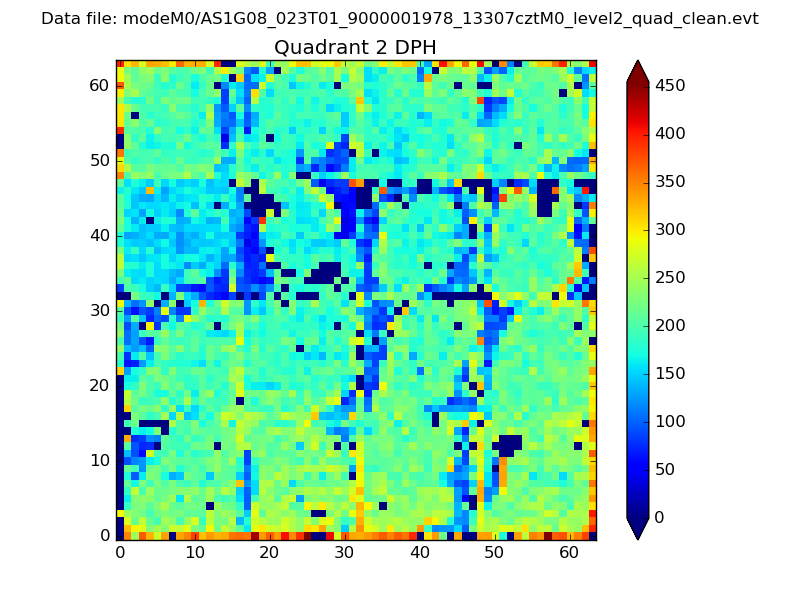
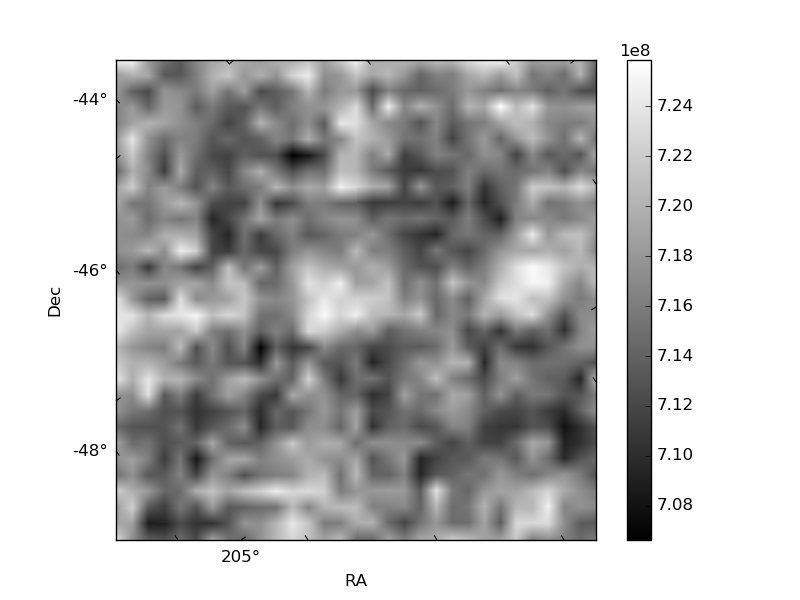
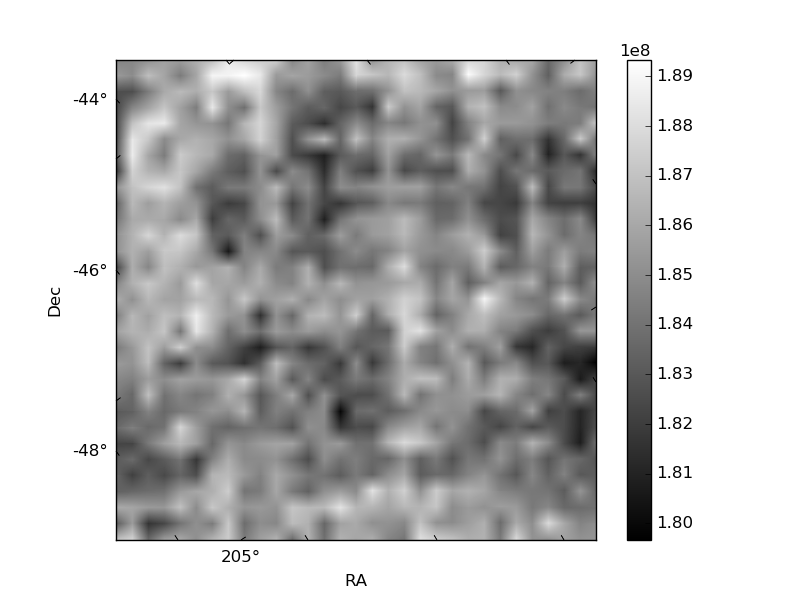
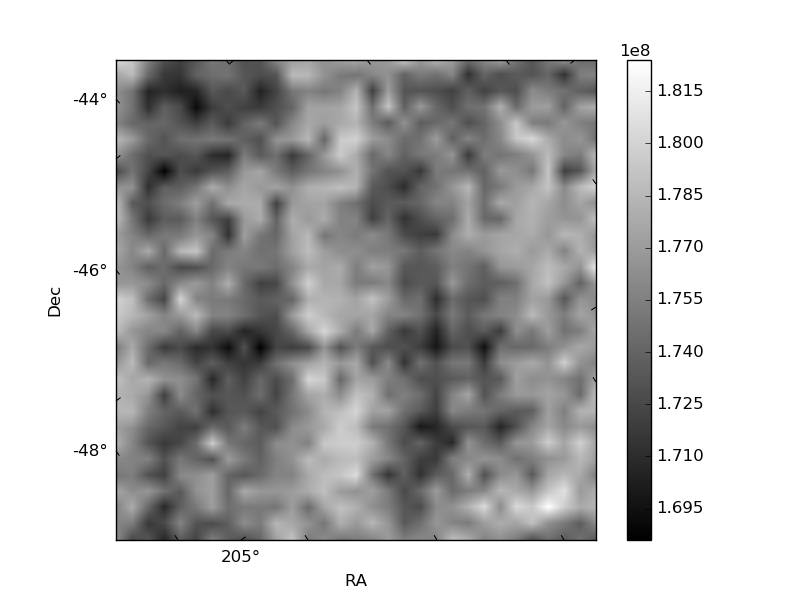
Histogram calculated using DETX and DETY for each event in the final _common_clean file
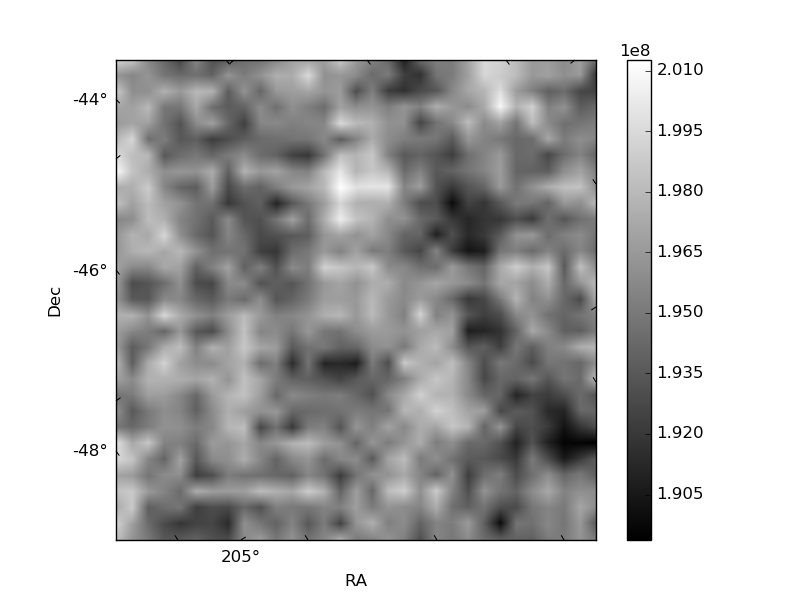
| Quadrant A |  |
 |
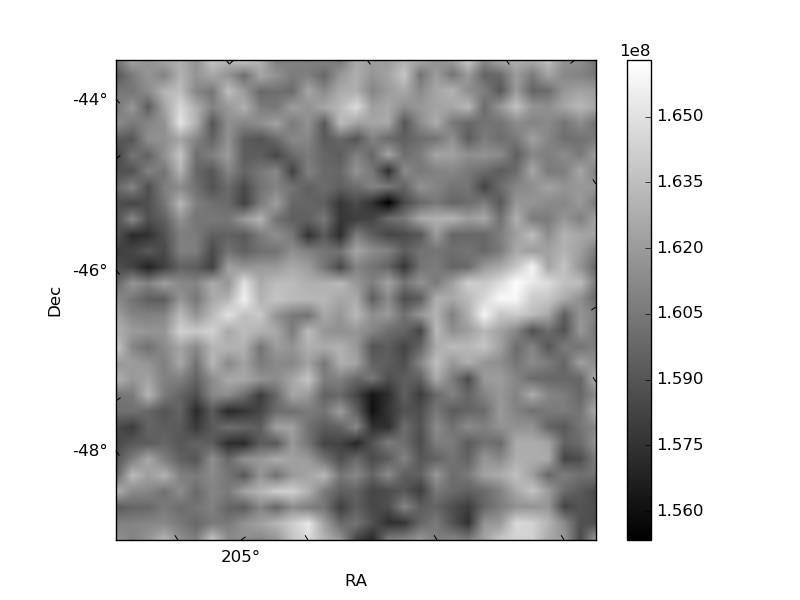
Quadrant B |
|---|---|---|---|
| Quadrant D | 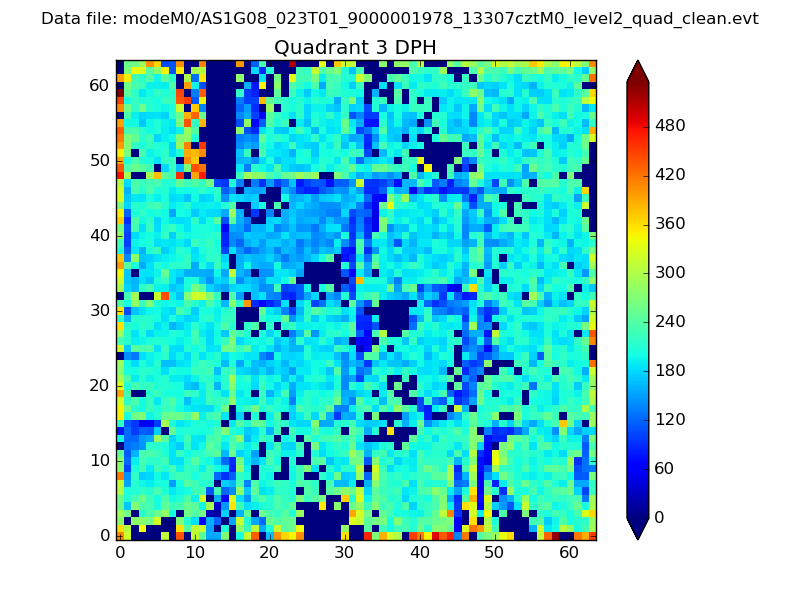 |
 |
Quadrant C |
| Plot type | Count rate plots | Images |
|---|---|---|
| Comparison with Poisson distribution Blue bars denote a histogram of data divided into 1 sec bins. Red curve is a Poisson curve with rate = median count rate of data. |
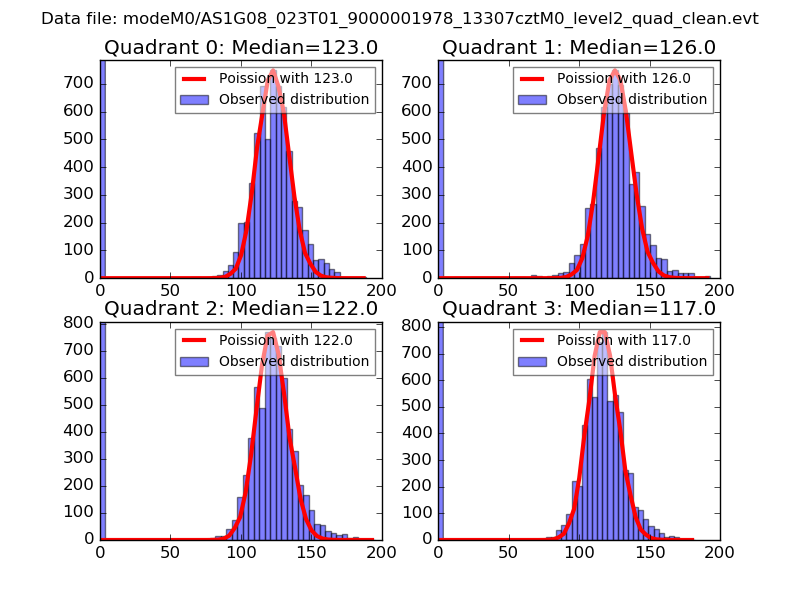 |
 |
| Quadrant-wise count rates Data is divided into 100 sec bins |
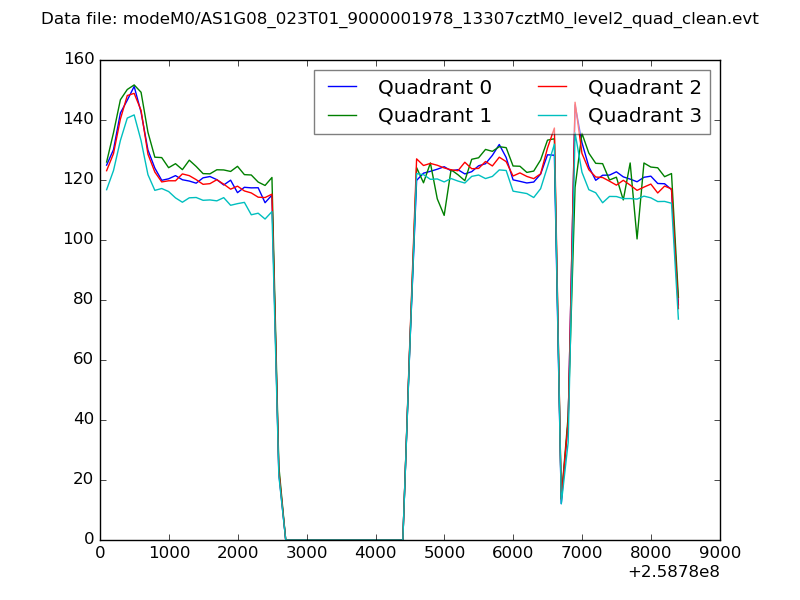 |
|
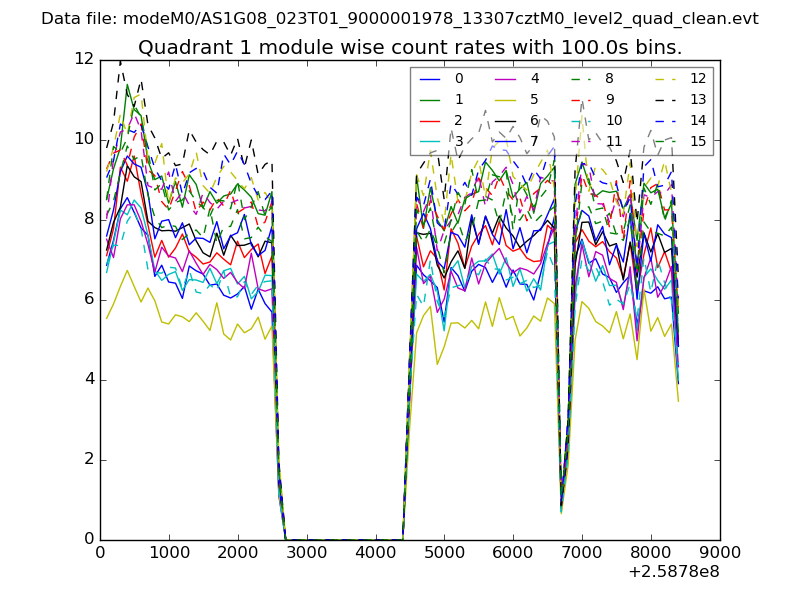
| Module-wise count rates for Quadrant A Data is divided into 100 sec bins |
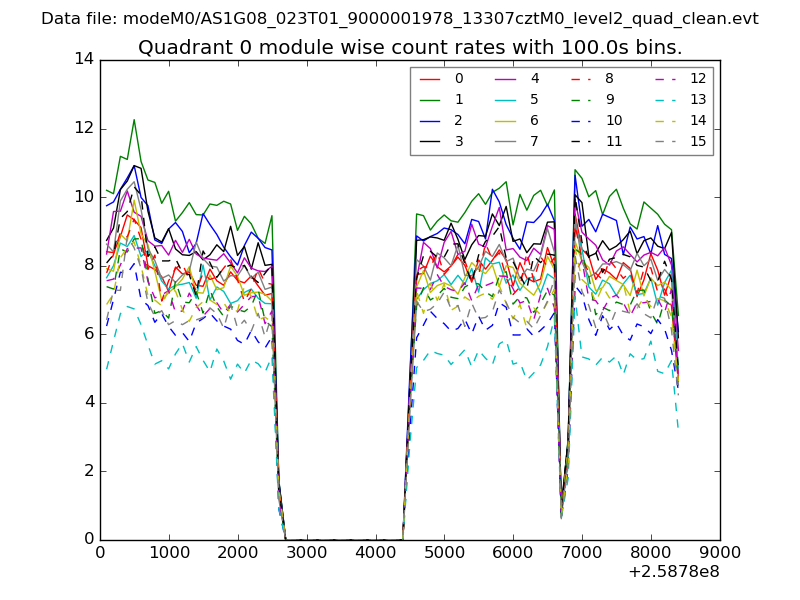 |
 |
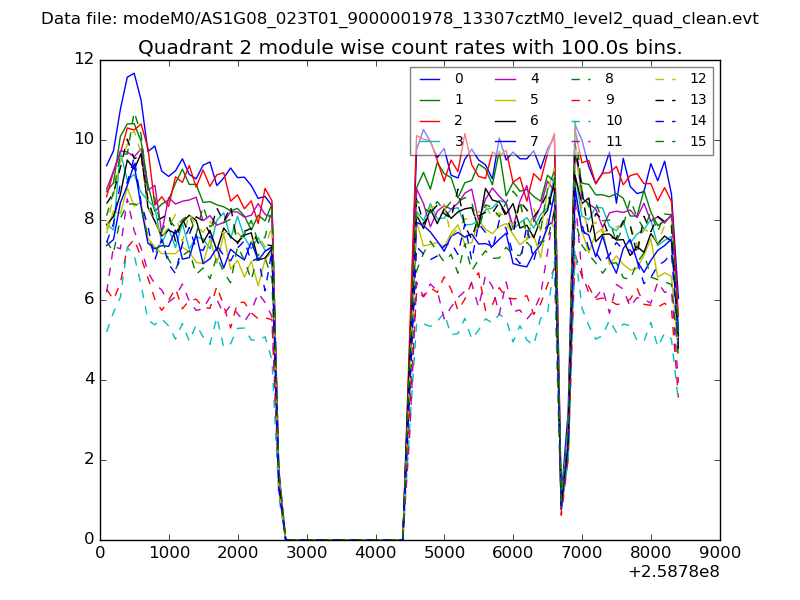
| Module-wise count rates for Quadrant B Data is divided into 100 sec bins |
 |
 |
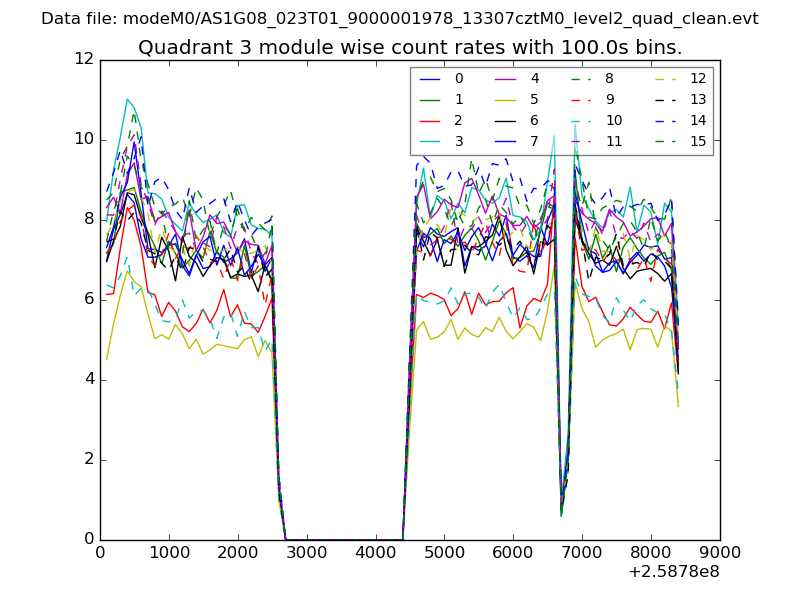
| Module-wise count rates for Quadrant C Data is divided into 100 sec bins |
 |
 |
| Module-wise count rates for Quadrant D Data is divided into 100 sec bins |
 |
 |
| Parameter | Plot |
|---|---|
| CZT HV Monitor | 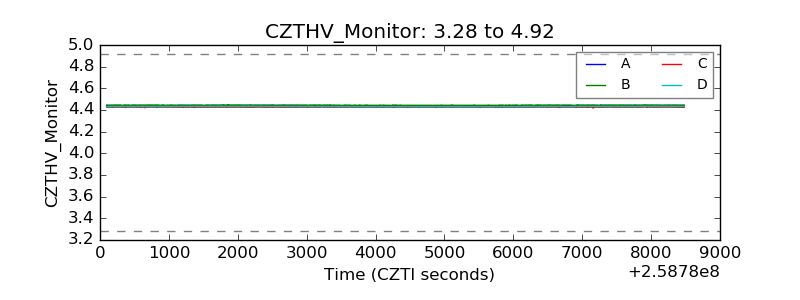 |
| D_VDD | 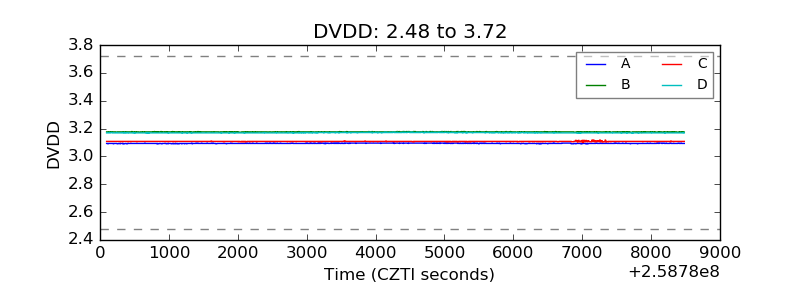 |
| Temperature 1 | 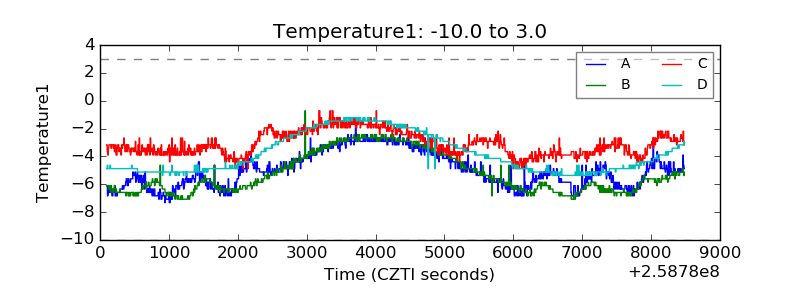 |
| Veto HV Monitor |  |
| Veto LLD | 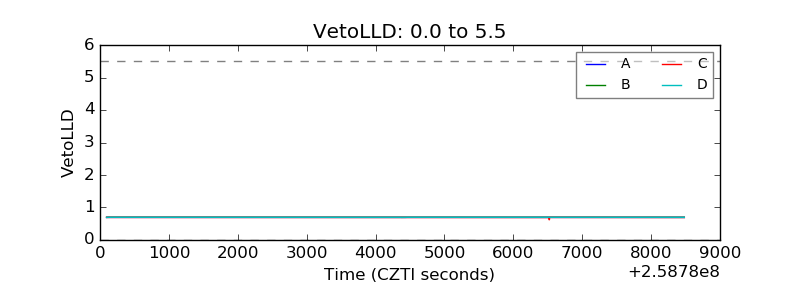 |
| Alpha Counter | 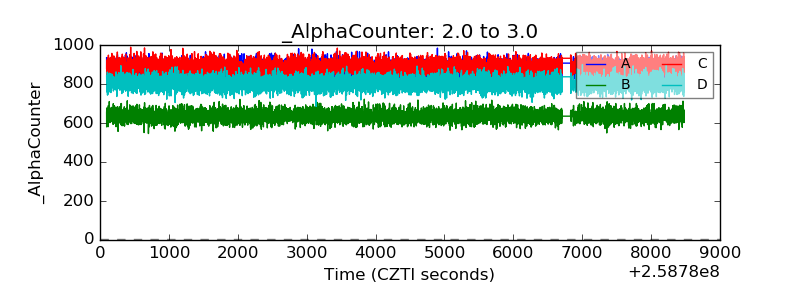 |
| _CPM_Rate |  |
| CZT Counter | 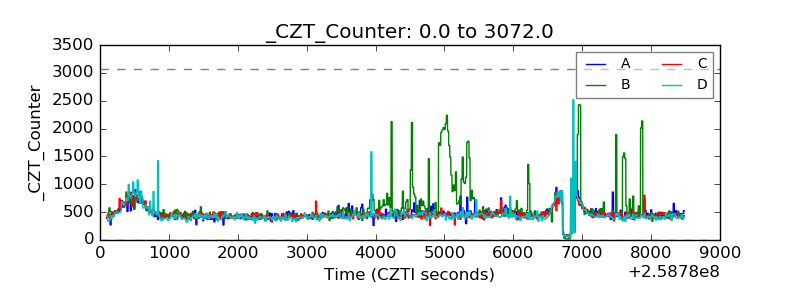 |
| +2.5 Volts monitor |  |
| +5 Volts monitor | 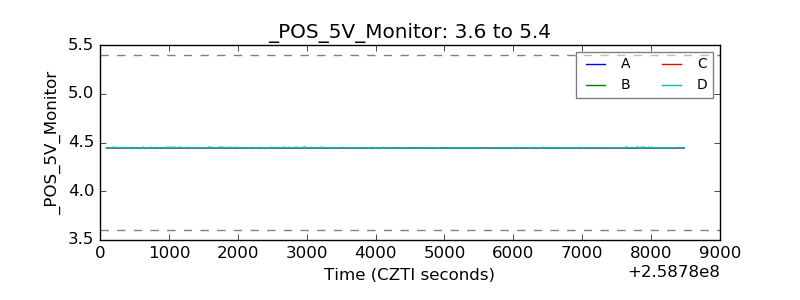 |
| _ROLL_ROT | 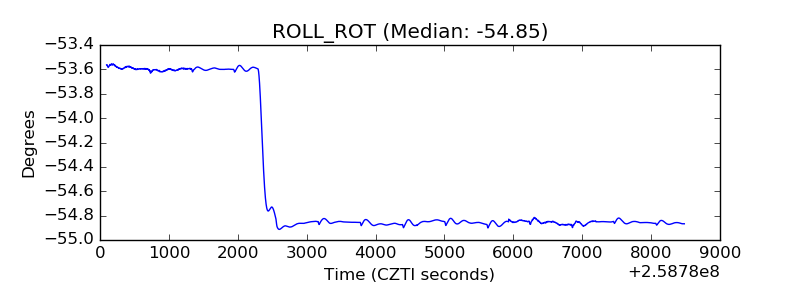 |
| _Roll_DEC | 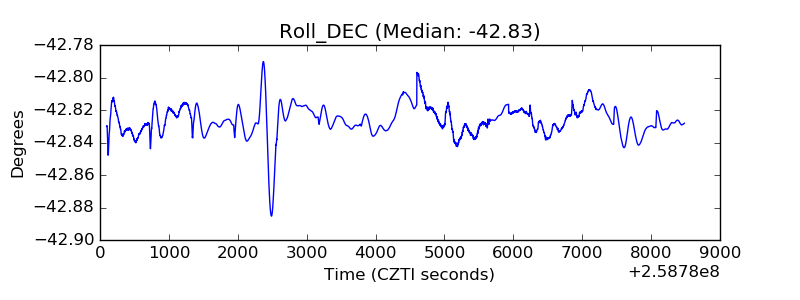 |
| _Roll_RA | 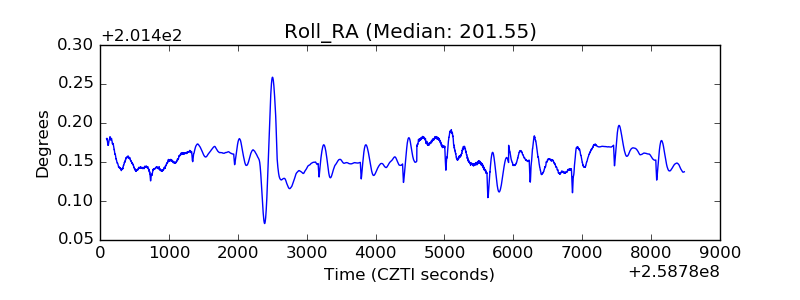 |
| Veto Counter | 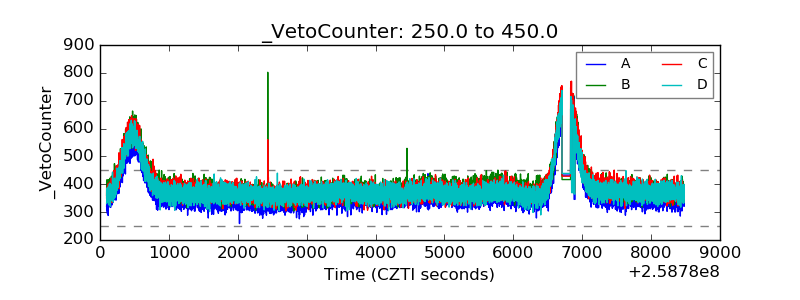 |