| Param | Original file | Final file |
|---|---|---|
| Filename | modeM0/AS1G08_023T01_9000001978_13313cztM0_level2.evt | modeM0/AS1G08_023T01_9000001978_13313cztM0_level2_quad_clean.evt |
| Size (bytes) | 1,735,467,840 | 328,429,440 |
| Size | 1.6 GB | 313.2 MB |
| Events in quadrant A | 13,232,378 | 2,043,488 |
| Events in quadrant B | 13,170,013 | 2,086,722 |
| Events in quadrant C | 11,719,005 | 2,055,390 |
| Events in quadrant D | 12,666,977 | 1,960,354 |
| Mode M0 | |||
|---|---|---|---|
| Quadrant | BADHDUFLAG | Total packets | Discarded packets |
| A | 0 | 57034 | 4 |
| B | 0 | 56279 | 4 |
| C | 0 | 53347 | 4 |
| D | 0 | 56111 | 4 |
| Mode SS | |||
|---|---|---|---|
| Quadrant | BADHDUFLAG | Total packets | Discarded packets |
| A | 0 | 534 | 0 |
| B | 0 | 534 | 0 |
| C | 0 | 534 | 0 |
| D | 0 | 534 | 0 |
| Mode M9 | |||
|---|---|---|---|
| Quadrant | BADHDUFLAG | Total packets | Discarded packets |
| A | 0 | 27 | 0 |
| B | 0 | 27 | 0 |
| C | 0 | 27 | 0 |
| D | 0 | 27 | 0 |
| Quadrant | Total seconds | Saturated seconds | Saturation percentage |
|---|---|---|---|
| A | 26183 | 427 | 1.630829% |
| B | 26183 | 423 | 1.615552% |
| C | 26183 | 225 | 0.859336% |
| D | 26183 | 388 | 1.481878% |
Noise dominated data is calculated using 1-second bins in cleaned event files. If a bin has >2000 counts, and if more than 50% of those come from <1% of pixels, then it is considered to be noise-dominated and hence unusable.
| Quadrant | # 1 sec bins | Bins with >0 counts | Bins with >2000 counts | High rate bins dominated by noise | Noise dominated (total time) | Noise dominated (detector-on time) | Marked lightcurve |
|---|---|---|---|---|---|---|---|
| A | 28974 | 26188 | 163 | 163 | 0.56% | 0.62% | 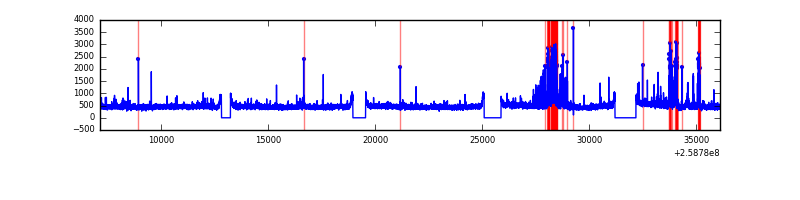 |
| B | 28974 | 26188 | 105 | 105 | 0.36% | 0.40% | 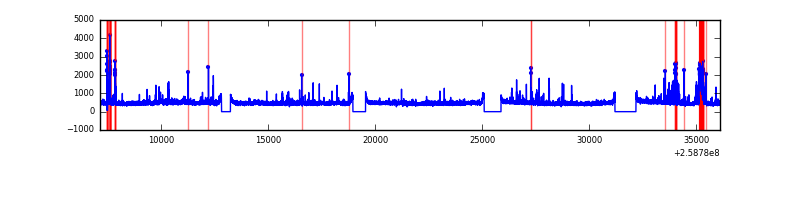 |
| C | 28974 | 26188 | 3 | 3 | 0.01% | 0.01% | 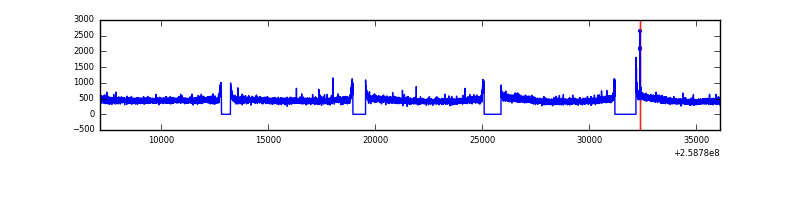 |
| D | 28974 | 26188 | 149 | 149 | 0.51% | 0.57% | 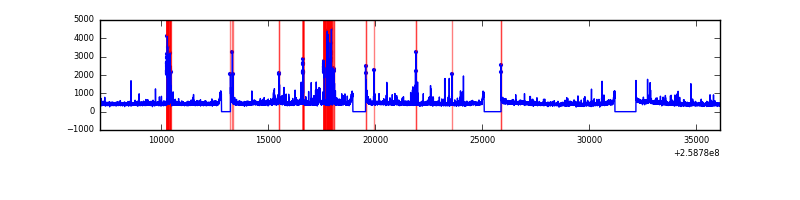 |
Top three noisy pixels from each quadrant. If the there are fewer than three noisy pixels in the level2.evt file, extra rows are filled as -1
| Pixel properties | Quadrant properties | ||||||
|---|---|---|---|---|---|---|---|
| Quadrant | DetID | PixID | Counts | Sigma | Mean | Median | Sigma |
| A | 8 | 15 | 1233517 | 1992.01 | 3053 | 2983 | 617.7 |
| A | 1 | 162 | 107948 | 169.92 | 3053 | 2983 | 617.7 |
| A | 9 | 143 | 62835 | 96.89 | 3053 | 2983 | 617.7 |
| B | 3 | 64 | 699969 | 1211.59 | 3068 | 2994 | 575.3 |
| B | 0 | 197 | 151713 | 258.52 | 3068 | 2994 | 575.3 |
| B | 0 | 230 | 98915 | 166.74 | 3068 | 2994 | 575.3 |
| C | 6 | 96 | 30382 | 39.7 | 2991 | 3007 | 689.6 |
| C | 13 | 61 | 21908 | 27.41 | 2991 | 3007 | 689.6 |
| C | 8 | 128 | 14008 | 15.95 | 2991 | 3007 | 689.6 |
| D | 8 | 195 | 544090 | 760.25 | 2961 | 2870 | 711.9 |
| D | 13 | 122 | 357066 | 497.54 | 2961 | 2870 | 711.9 |
| D | 5 | 222 | 331067 | 461.02 | 2961 | 2870 | 711.9 |
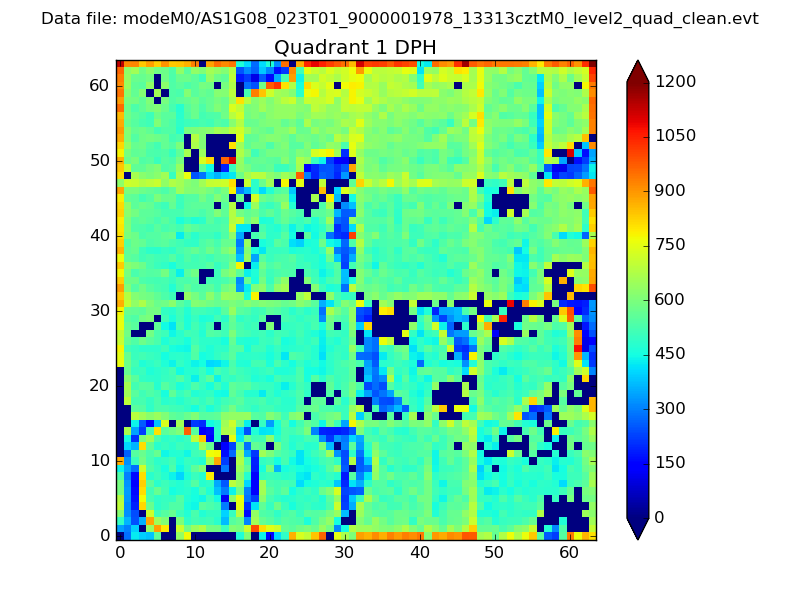
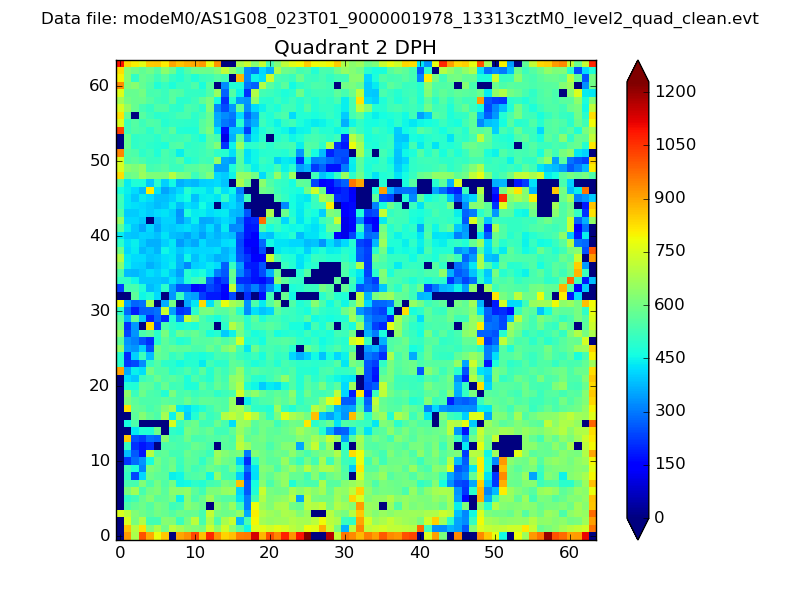
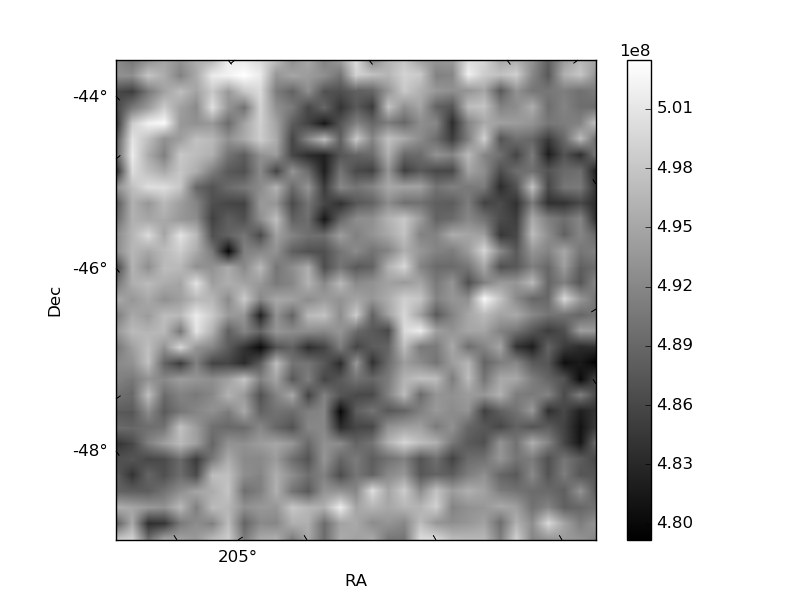
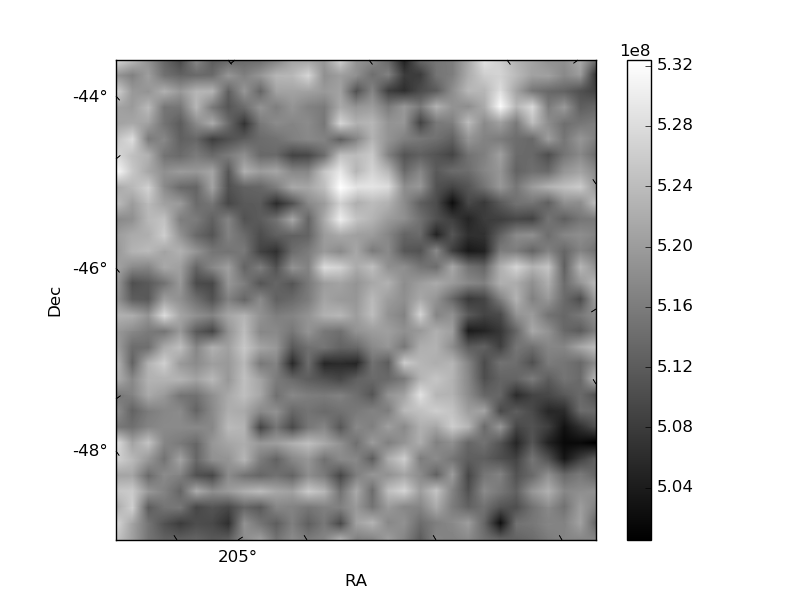
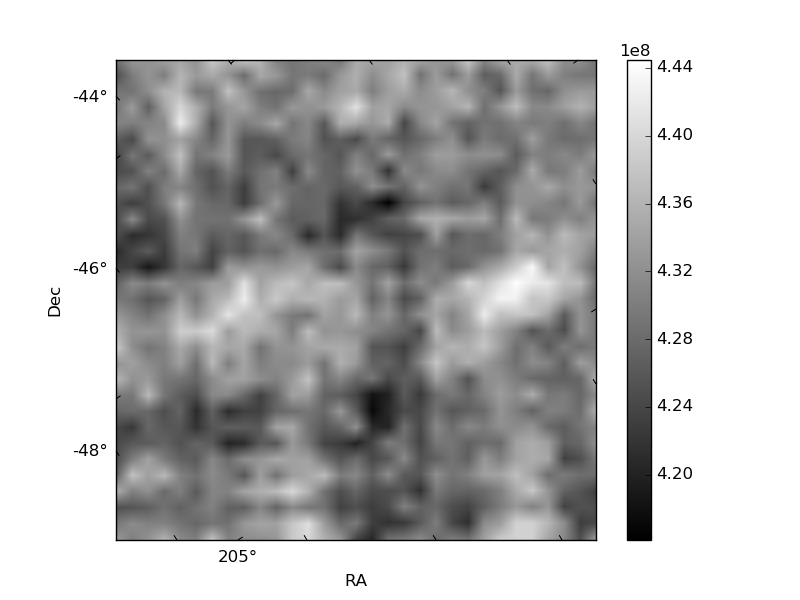
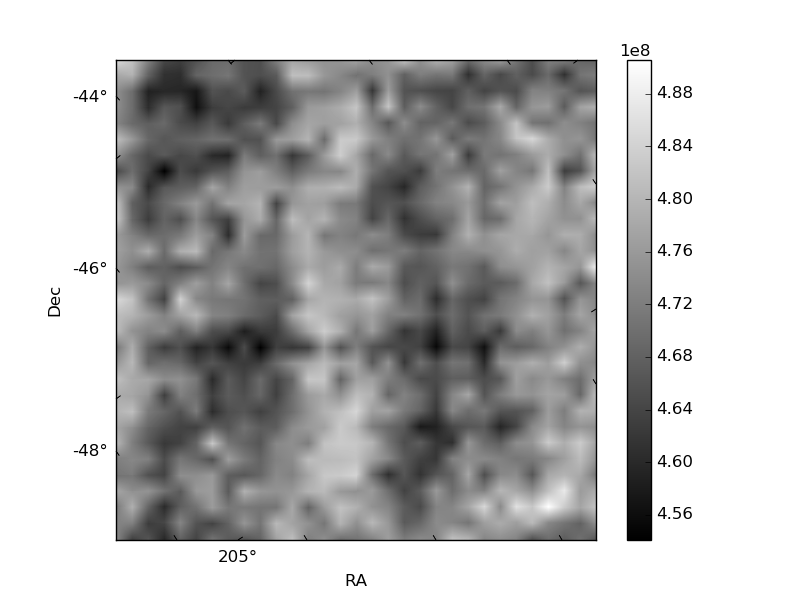
Histogram calculated using DETX and DETY for each event in the final _common_clean file
| Quadrant A |  |
 |
Quadrant B |
|---|---|---|---|
| Quadrant D |  |
 |
Quadrant C |
| Plot type | Count rate plots | Images |
|---|---|---|
| Comparison with Poisson distribution Blue bars denote a histogram of data divided into 1 sec bins. Red curve is a Poisson curve with rate = median count rate of data. |
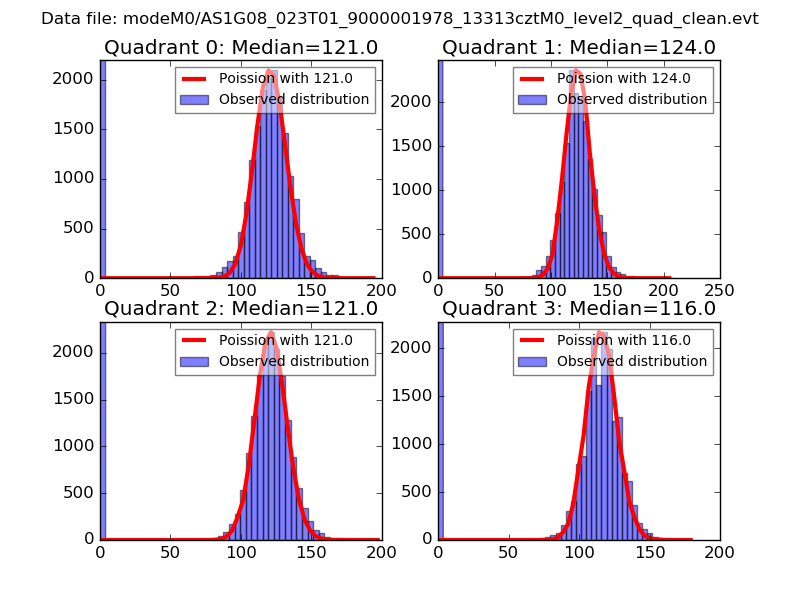 |
 |
| Quadrant-wise count rates Data is divided into 100 sec bins |
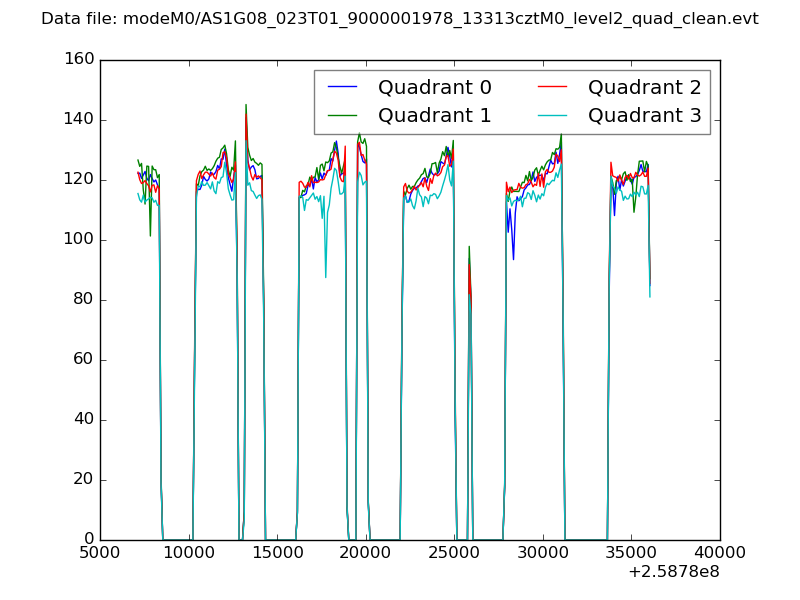 |
|
| Module-wise count rates for Quadrant A Data is divided into 100 sec bins |
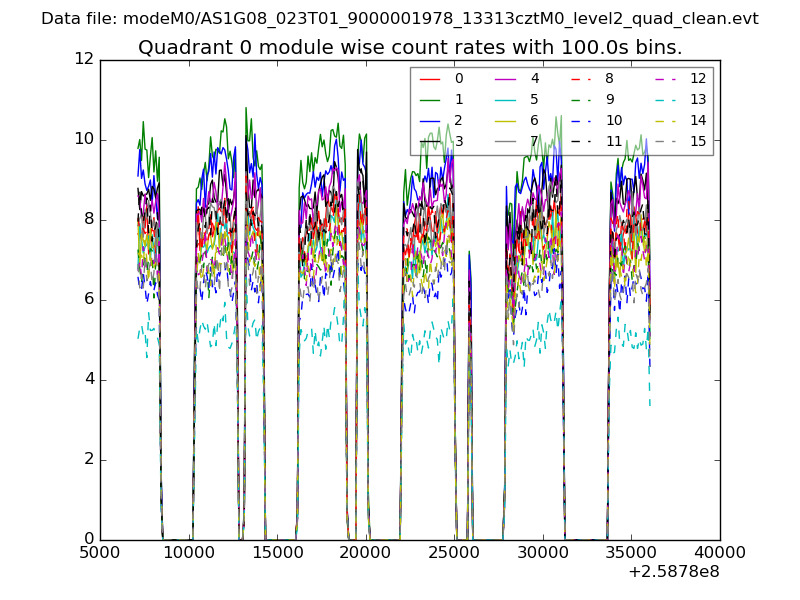 |
 |
| Module-wise count rates for Quadrant B Data is divided into 100 sec bins |
 |
 |
| Module-wise count rates for Quadrant C Data is divided into 100 sec bins |
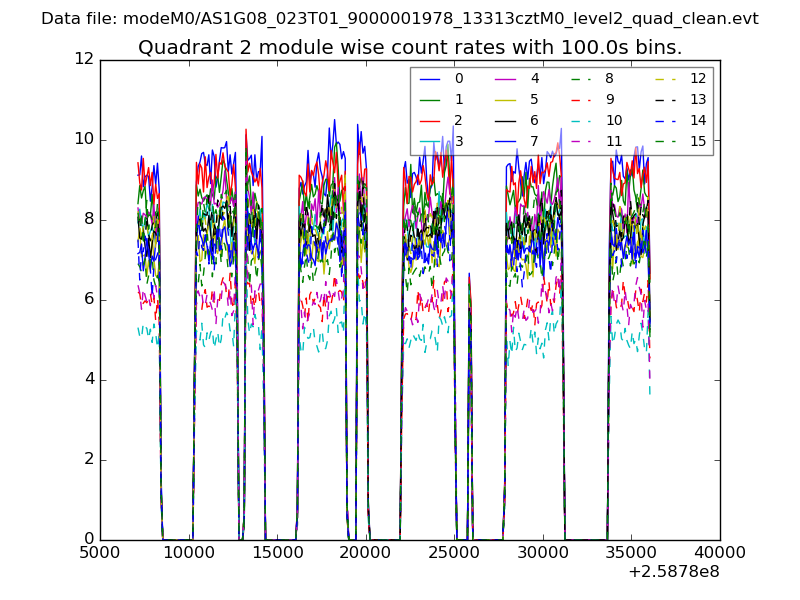 |
 |
| Module-wise count rates for Quadrant D Data is divided into 100 sec bins |
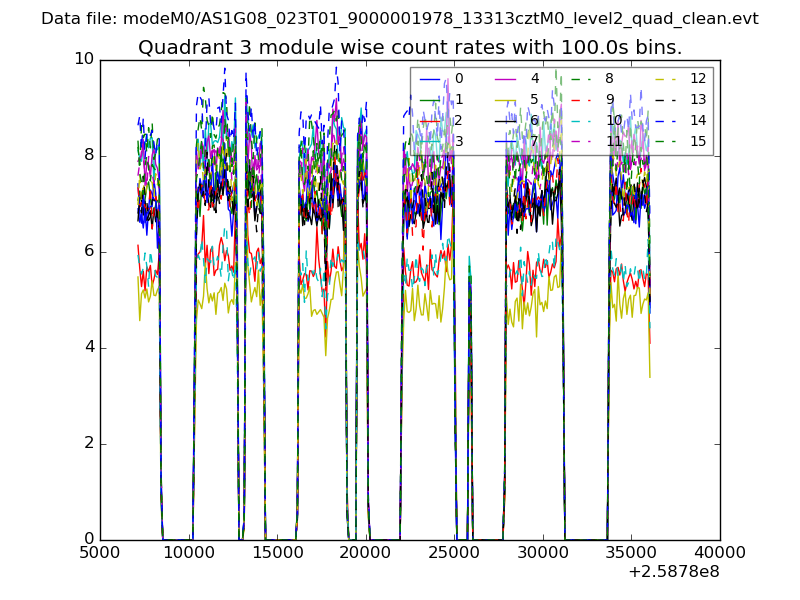 |
 |
| Parameter | Plot |
|---|---|
| CZT HV Monitor | 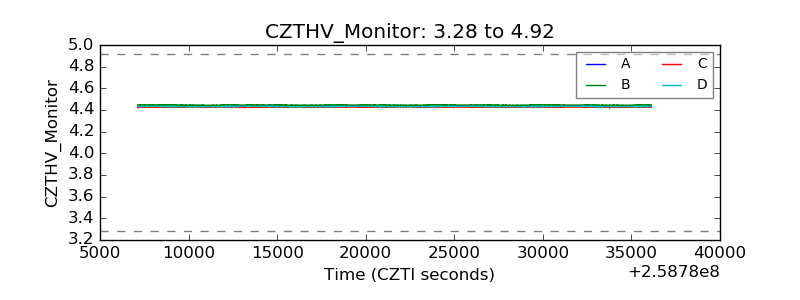 |
| D_VDD | 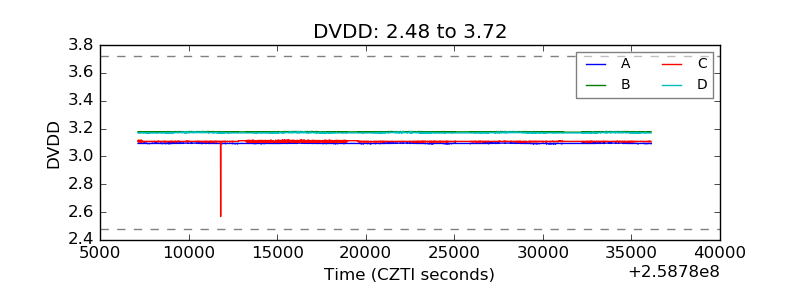 |
| Temperature 1 | 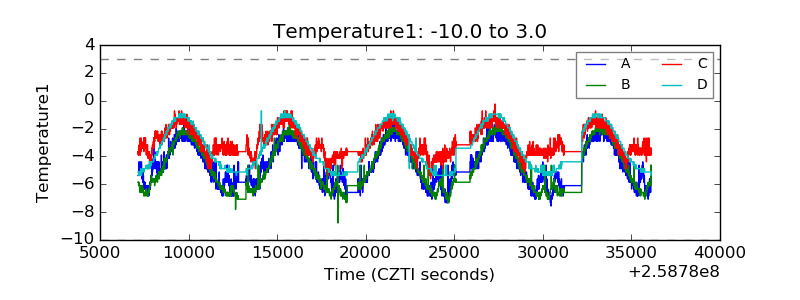 |
| Veto HV Monitor | 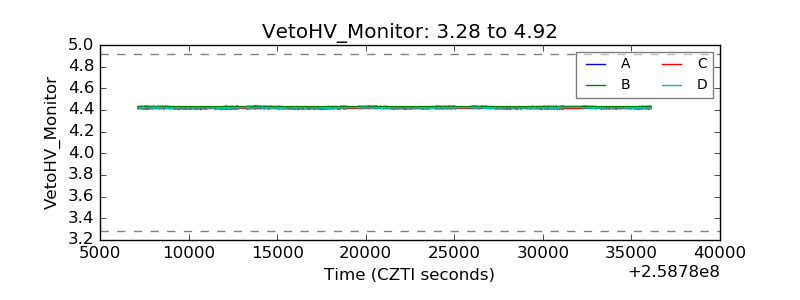 |
| Veto LLD | 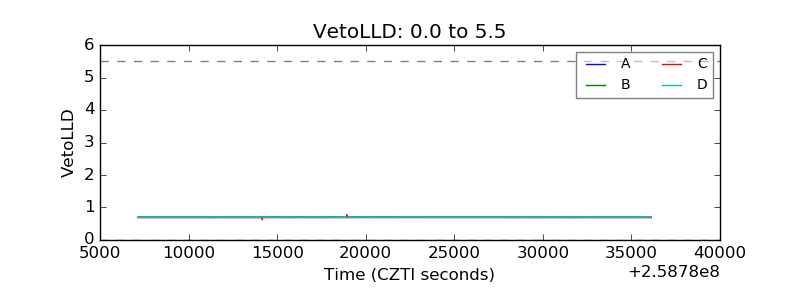 |
| Alpha Counter | 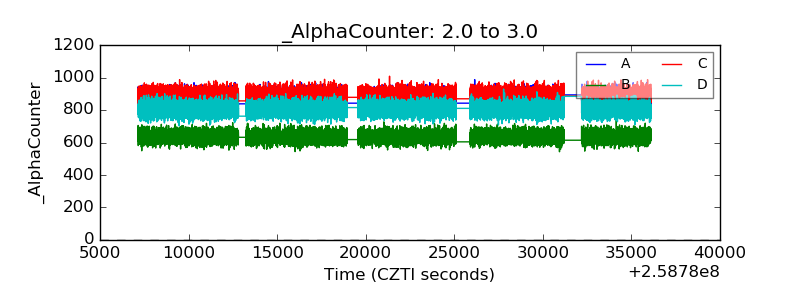 |
| _CPM_Rate | 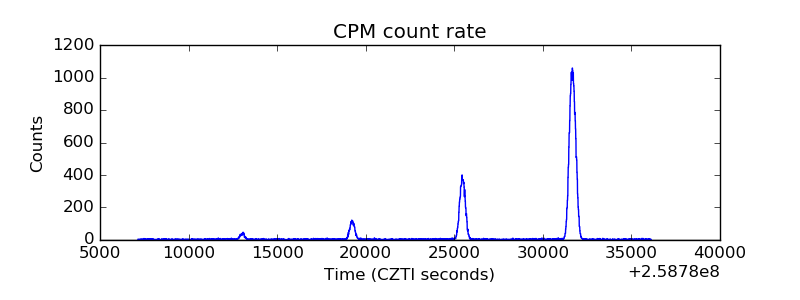 |
| CZT Counter | 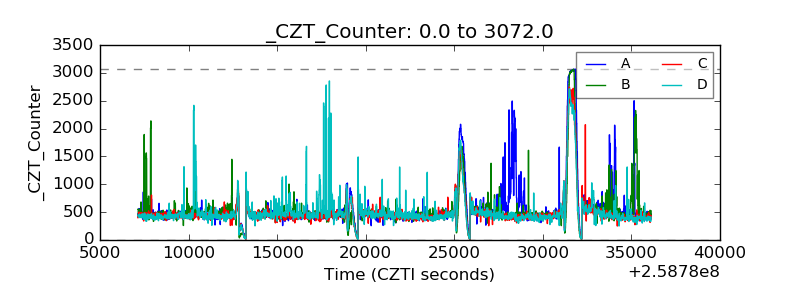 |
| +2.5 Volts monitor |  |
| +5 Volts monitor | 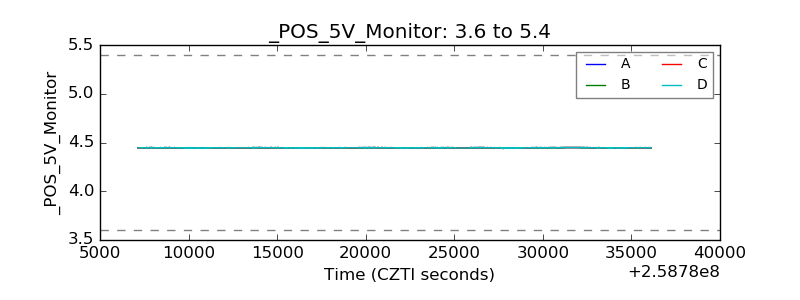 |
| _ROLL_ROT | 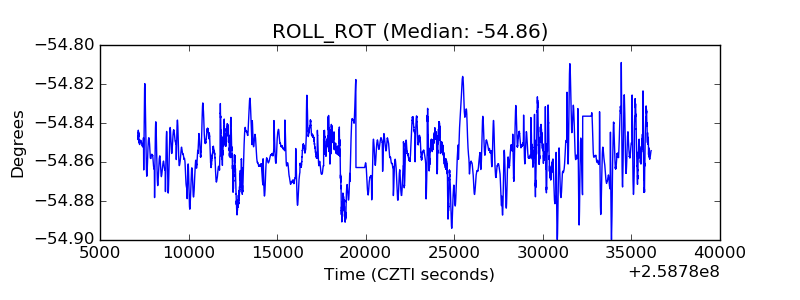 |
| _Roll_DEC | 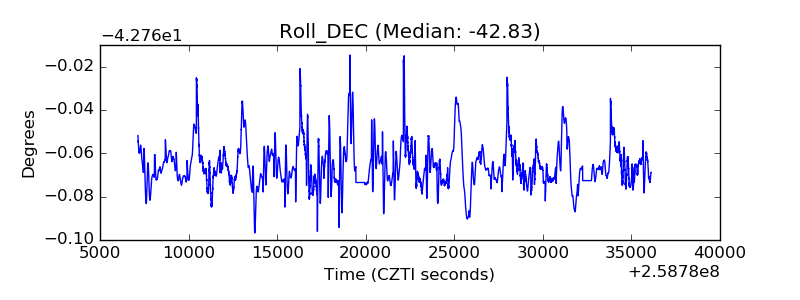 |
| _Roll_RA | 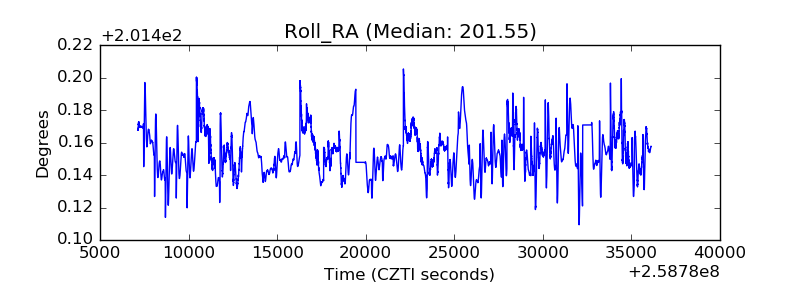 |
| Veto Counter | 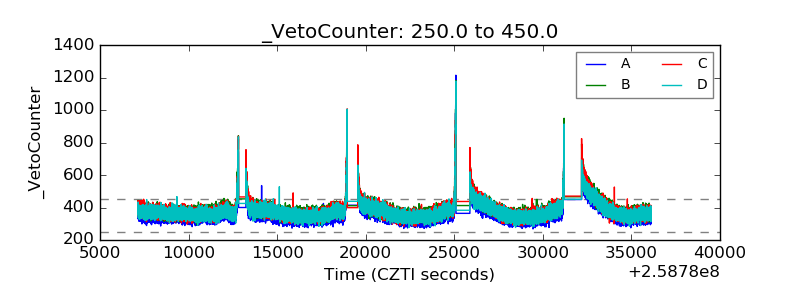 |