| Param | Original file | Final file |
|---|---|---|
| Filename | modeM0/AS1A04_101T01_9000001984_13319cztM0_level2.evt | modeM0/AS1A04_101T01_9000001984_13319cztM0_level2_quad_clean.evt |
| Size (bytes) | 541,552,320 | 94,173,120 |
| Size | 516.5 MB | 89.8 MB |
| Events in quadrant A | 3,419,529 | 595,190 |
| Events in quadrant B | 3,652,976 | 616,183 |
| Events in quadrant C | 3,475,796 | 599,838 |
| Events in quadrant D | 5,371,764 | 547,078 |
| Mode M9 | |||
|---|---|---|---|
| Quadrant | BADHDUFLAG | Total packets | Discarded packets |
| A | 0 | 17 | 0 |
| B | 0 | 17 | 0 |
| C | 0 | 17 | 0 |
| D | 0 | 17 | 0 |
| Mode SS | |||
|---|---|---|---|
| Quadrant | BADHDUFLAG | Total packets | Discarded packets |
| A | 0 | 146 | 0 |
| B | 0 | 146 | 0 |
| C | 0 | 146 | 0 |
| D | 0 | 146 | 0 |
| Mode M0 | |||
|---|---|---|---|
| Quadrant | BADHDUFLAG | Total packets | Discarded packets |
| A | 0 | 14898 | 3 |
| B | 0 | 15452 | 2 |
| C | 0 | 15044 | 2 |
| D | 0 | 20813 | 2 |
| Quadrant | Total seconds | Saturated seconds | Saturation percentage |
|---|---|---|---|
| A | 7085 | 50 | 0.705716% |
| B | 7085 | 145 | 2.046577% |
| C | 7085 | 52 | 0.733945% |
| D | 7085 | 558 | 7.875794% |
Noise dominated data is calculated using 1-second bins in cleaned event files. If a bin has >2000 counts, and if more than 50% of those come from <1% of pixels, then it is considered to be noise-dominated and hence unusable.
| Quadrant | # 1 sec bins | Bins with >0 counts | Bins with >2000 counts | High rate bins dominated by noise | Noise dominated (total time) | Noise dominated (detector-on time) | Marked lightcurve |
|---|---|---|---|---|---|---|---|
| A | 8866 | 7088 | 0 | 0 | 0.00% | 0.00% | 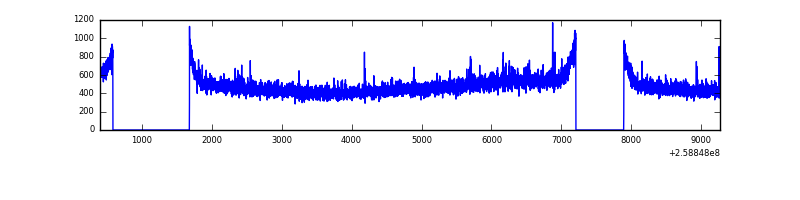 |
| B | 8866 | 7088 | 3 | 3 | 0.03% | 0.04% | 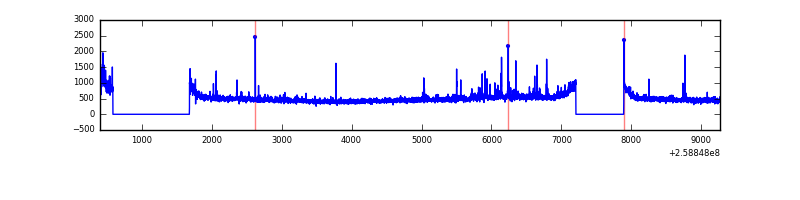 |
| C | 8866 | 7088 | 5 | 5 | 0.06% | 0.07% |  |
| D | 8866 | 7088 | 317 | 317 | 3.58% | 4.47% | 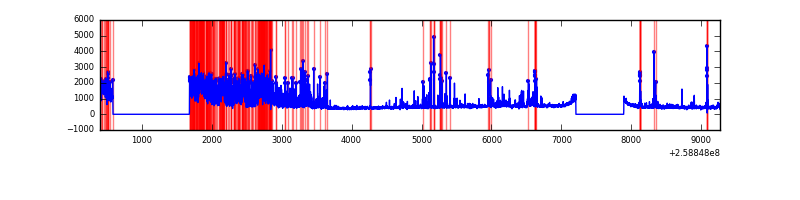 |
Top three noisy pixels from each quadrant. If the there are fewer than three noisy pixels in the level2.evt file, extra rows are filled as -1
| Pixel properties | Quadrant properties | ||||||
|---|---|---|---|---|---|---|---|
| Quadrant | DetID | PixID | Counts | Sigma | Mean | Median | Sigma |
| A | 1 | 162 | 21845 | 116.96 | 876 | 857 | 179.5 |
| A | 8 | 15 | 18597 | 98.86 | 876 | 857 | 179.5 |
| A | 0 | 226 | 7934 | 39.44 | 876 | 857 | 179.5 |
| B | 4 | 173 | 74119 | 431.92 | 884 | 863 | 169.6 |
| B | 0 | 230 | 48885 | 283.14 | 884 | 863 | 169.6 |
| B | 0 | 214 | 23174 | 131.55 | 884 | 863 | 169.6 |
| C | 6 | 96 | 78377 | 385.19 | 859 | 867 | 201.2 |
| C | 15 | 208 | 47210 | 230.31 | 859 | 867 | 201.2 |
| C | 13 | 61 | 6229 | 26.65 | 859 | 867 | 201.2 |
| D | 1 | 52 | 2048519 | 10174.81 | 827 | 804 | 201.3 |
| D | 2 | 136 | 71396 | 350.76 | 827 | 804 | 201.3 |
| D | 8 | 195 | 61788 | 303.02 | 827 | 804 | 201.3 |
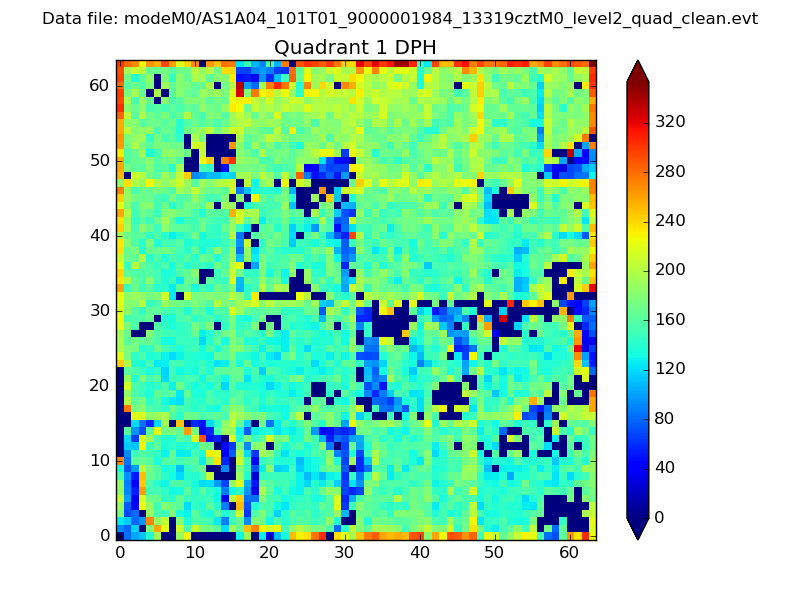
Histogram calculated using DETX and DETY for each event in the final _common_clean file
| Quadrant A |  |
 |
Quadrant B |
|---|---|---|---|
| Quadrant D |  |
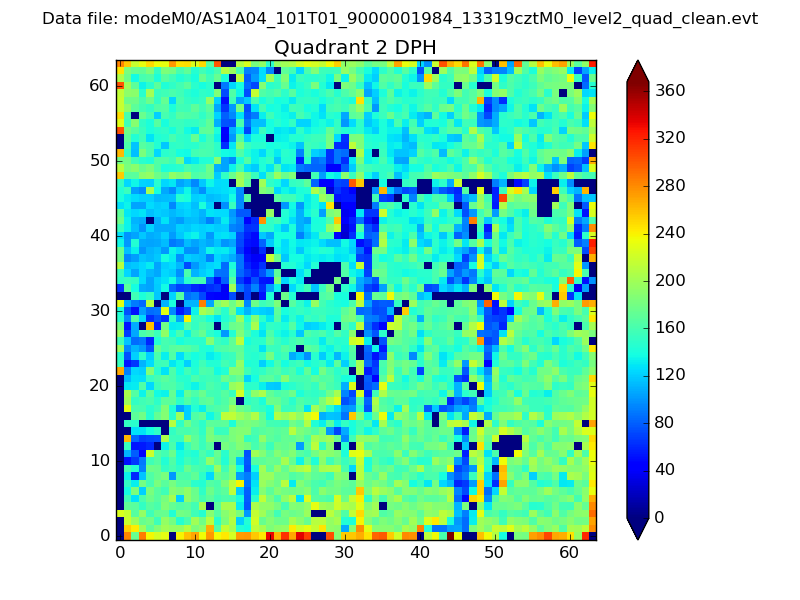 |
Quadrant C |
| Plot type | Count rate plots | Images |
|---|---|---|
| Comparison with Poisson distribution Blue bars denote a histogram of data divided into 1 sec bins. Red curve is a Poisson curve with rate = median count rate of data. |
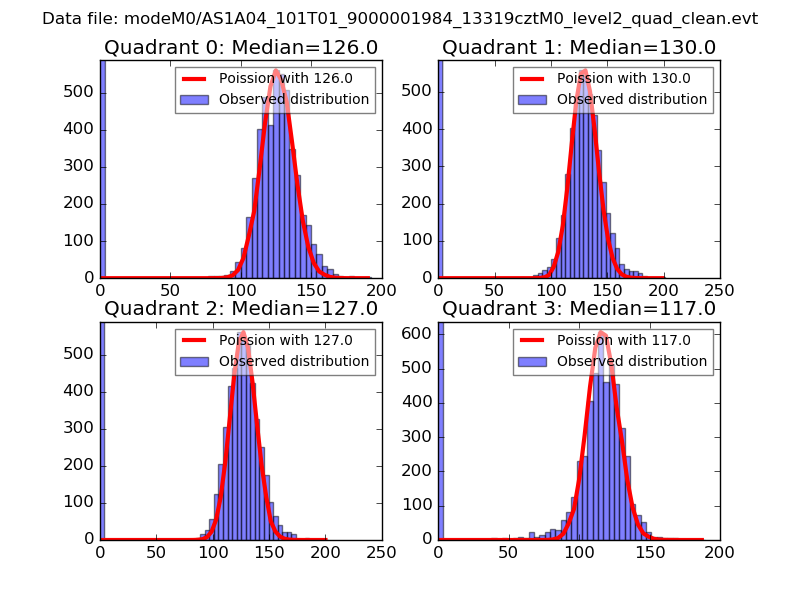 |
 |
| Quadrant-wise count rates Data is divided into 100 sec bins |
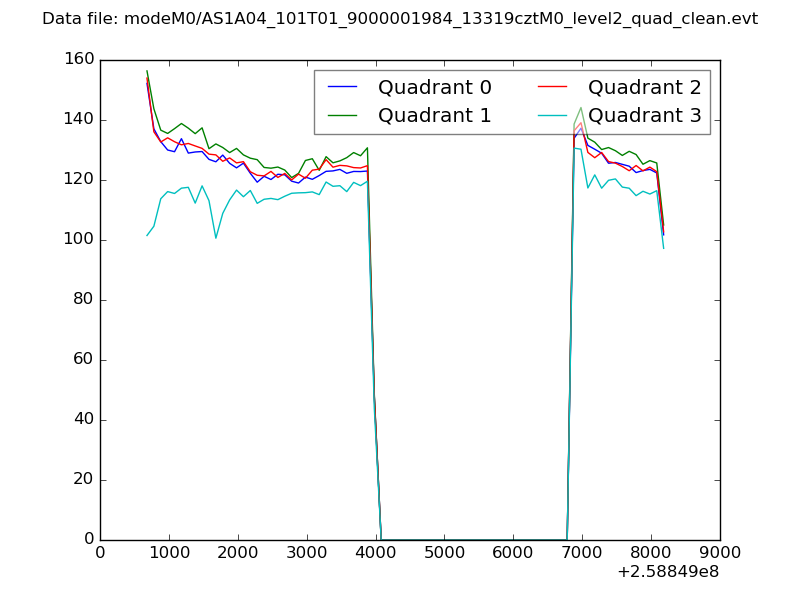 |
|
| Module-wise count rates for Quadrant A Data is divided into 100 sec bins |
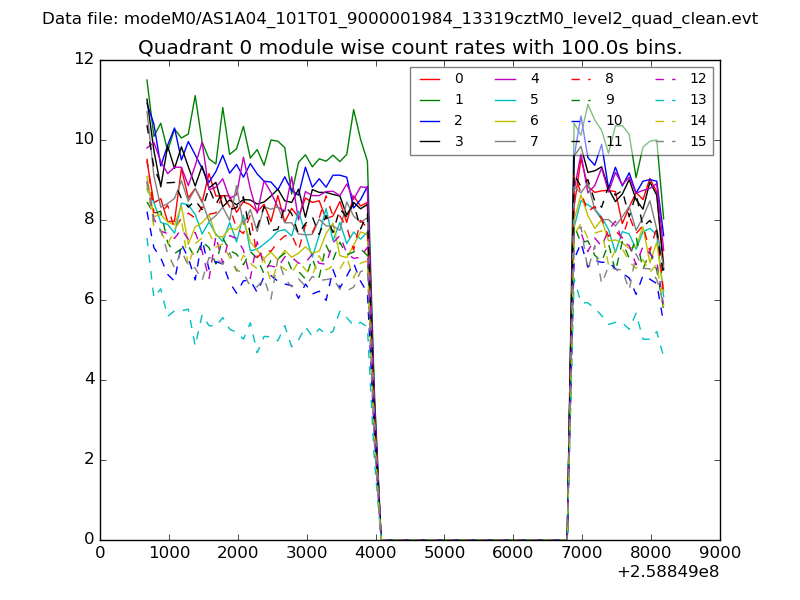 |
 |
| Module-wise count rates for Quadrant B Data is divided into 100 sec bins |
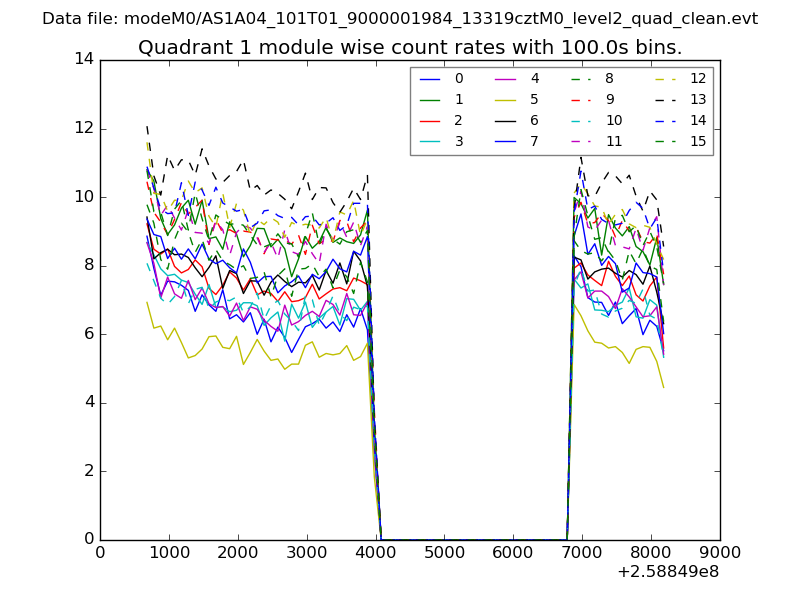 |
 |
| Module-wise count rates for Quadrant C Data is divided into 100 sec bins |
 |
 |
| Module-wise count rates for Quadrant D Data is divided into 100 sec bins |
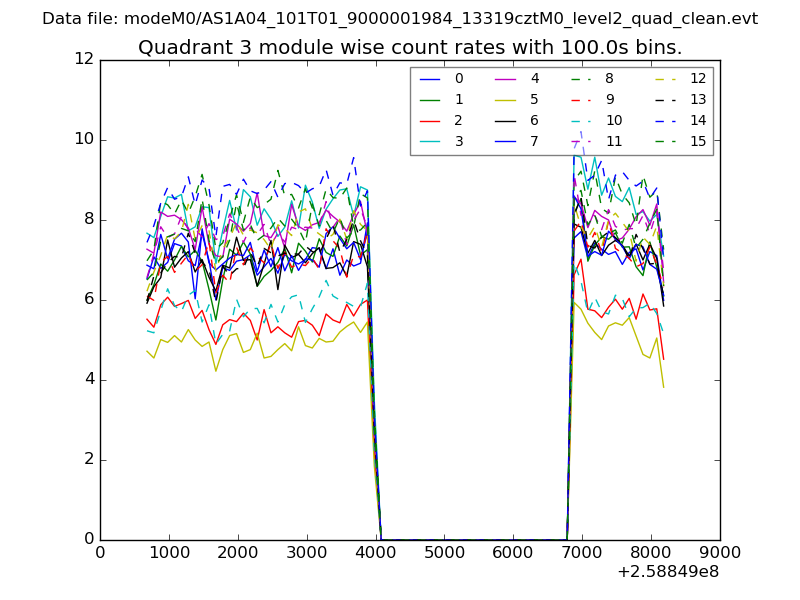 |
 |
| Parameter | Plot |
|---|---|
| CZT HV Monitor | 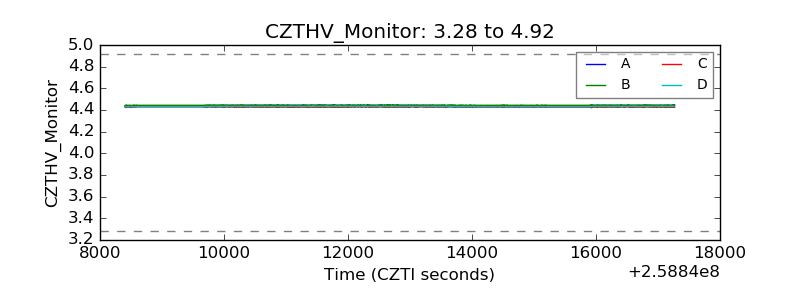 |
| D_VDD |  |
| Temperature 1 | 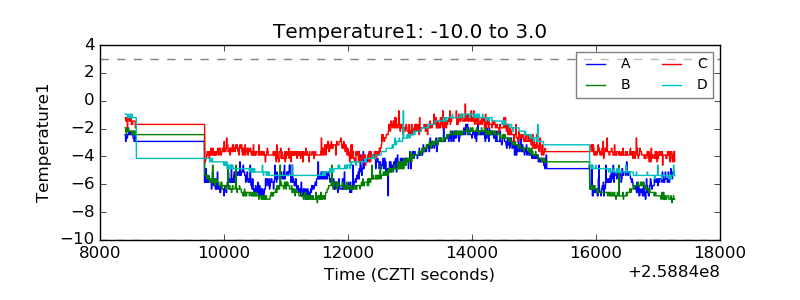 |
| Veto HV Monitor | 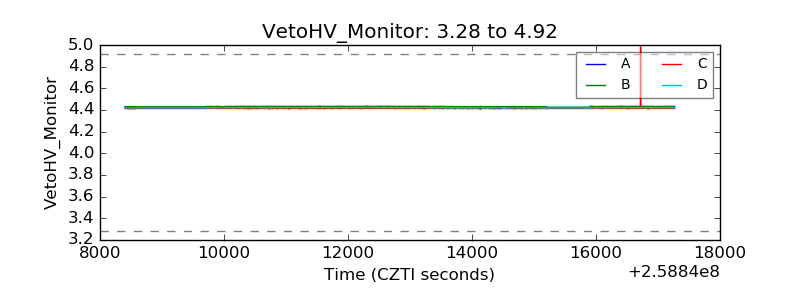 |
| Veto LLD | 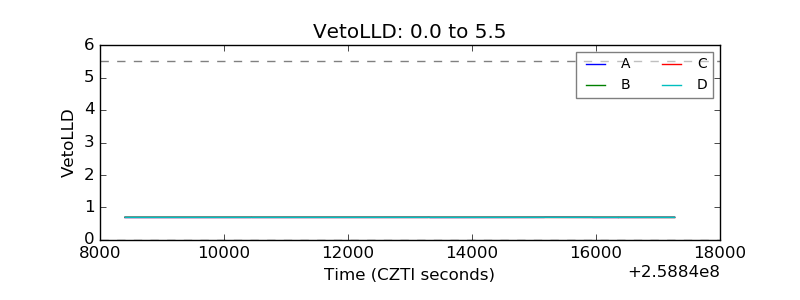 |
| Alpha Counter | 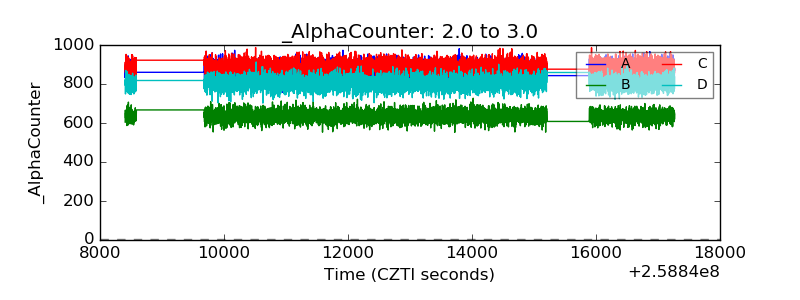 |
| _CPM_Rate | 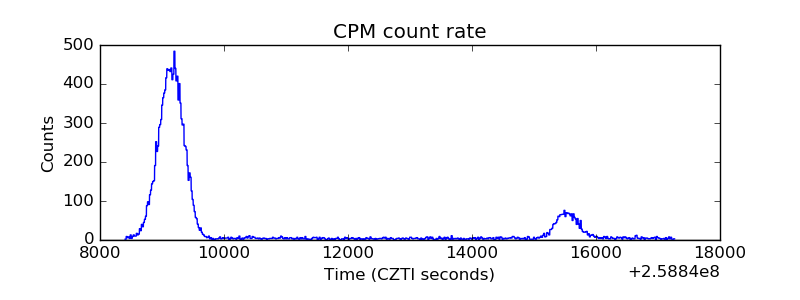 |
| CZT Counter | 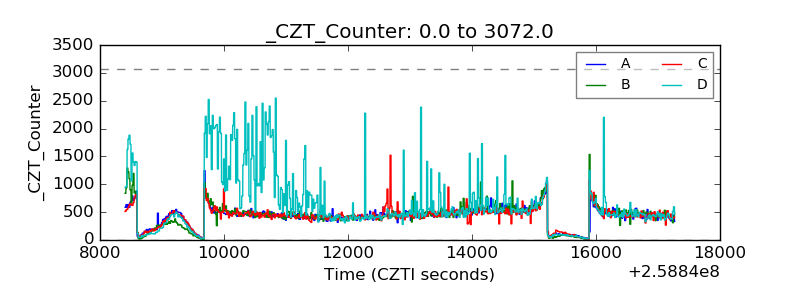 |
| +2.5 Volts monitor |  |
| +5 Volts monitor |  |
| _ROLL_ROT | 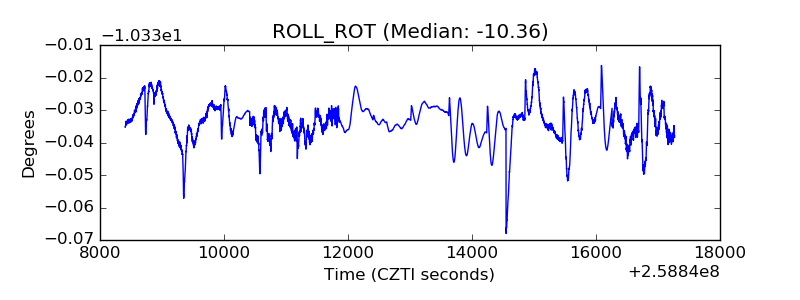 |
| _Roll_DEC | 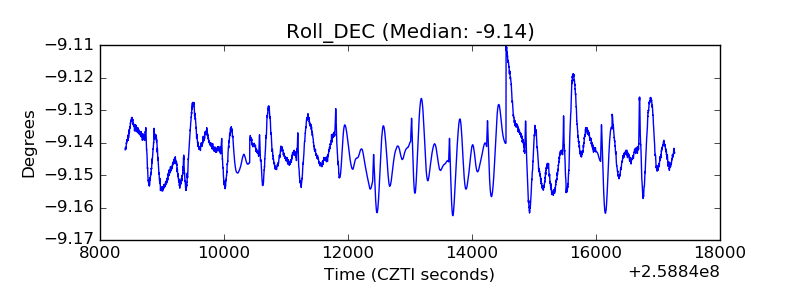 |
| _Roll_RA | 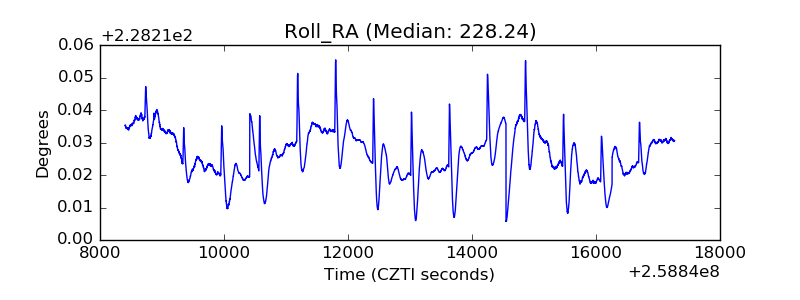 |
| Veto Counter | 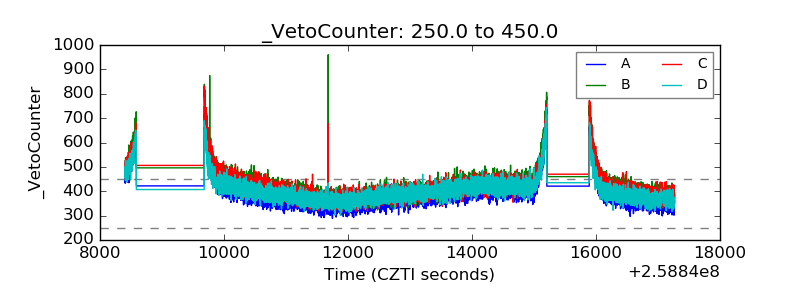 |