| Param | Original file | Final file |
|---|---|---|
| Filename | modeM0/AS1A04_101T01_9000001984_13320cztM0_level2.evt | modeM0/AS1A04_101T01_9000001984_13320cztM0_level2_quad_clean.evt |
| Size (bytes) | 568,555,200 | 110,626,560 |
| Size | 542.2 MB | 105.5 MB |
| Events in quadrant A | 3,797,459 | 704,466 |
| Events in quadrant B | 4,138,037 | 721,330 |
| Events in quadrant C | 3,898,276 | 710,968 |
| Events in quadrant D | 4,845,877 | 661,117 |
| Mode M9 | |||
|---|---|---|---|
| Quadrant | BADHDUFLAG | Total packets | Discarded packets |
| A | 0 | 7 | 0 |
| B | 0 | 7 | 0 |
| C | 0 | 7 | 0 |
| D | 0 | 7 | 0 |
| Mode SS | |||
|---|---|---|---|
| Quadrant | BADHDUFLAG | Total packets | Discarded packets |
| A | 0 | 164 | 0 |
| B | 0 | 164 | 0 |
| C | 0 | 164 | 0 |
| D | 0 | 164 | 0 |
| Mode M0 | |||
|---|---|---|---|
| Quadrant | BADHDUFLAG | Total packets | Discarded packets |
| A | 0 | 16647 | 3 |
| B | 0 | 17497 | 2 |
| C | 0 | 16988 | 2 |
| D | 0 | 19751 | 2 |
| Quadrant | Total seconds | Saturated seconds | Saturation percentage |
|---|---|---|---|
| A | 7939 | 128 | 1.612294% |
| B | 7939 | 237 | 2.985263% |
| C | 7939 | 129 | 1.624890% |
| D | 7939 | 331 | 4.169291% |
Noise dominated data is calculated using 1-second bins in cleaned event files. If a bin has >2000 counts, and if more than 50% of those come from <1% of pixels, then it is considered to be noise-dominated and hence unusable.
| Quadrant | # 1 sec bins | Bins with >0 counts | Bins with >2000 counts | High rate bins dominated by noise | Noise dominated (total time) | Noise dominated (detector-on time) | Marked lightcurve |
|---|---|---|---|---|---|---|---|
| A | 8775 | 7942 | 1 | 1 | 0.01% | 0.01% | 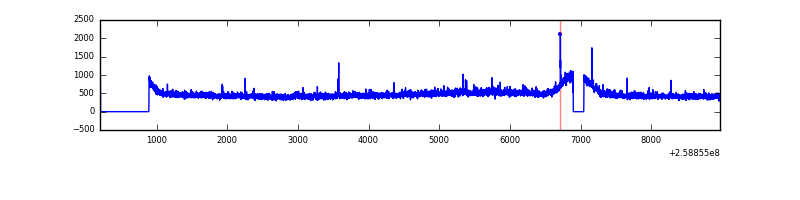 |
| B | 8775 | 7942 | 29 | 29 | 0.33% | 0.37% | 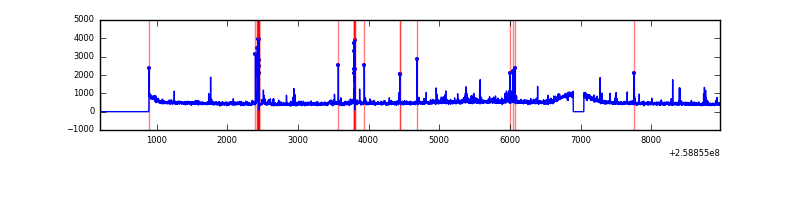 |
| C | 8775 | 7942 | 13 | 13 | 0.15% | 0.16% | 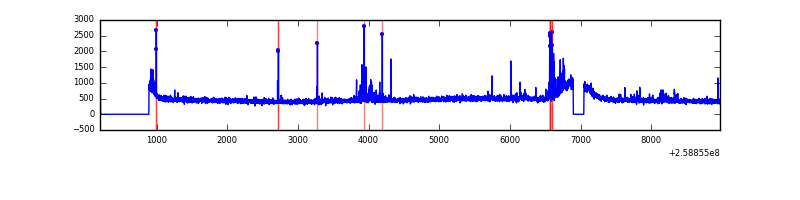 |
| D | 8775 | 7942 | 76 | 76 | 0.87% | 0.96% | 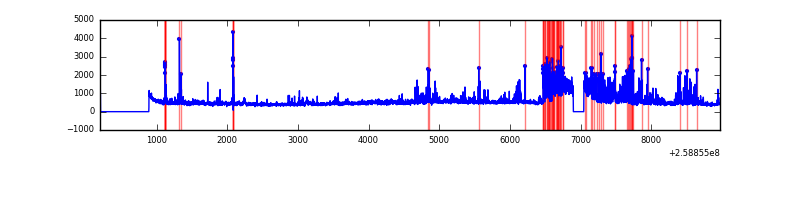 |
Top three noisy pixels from each quadrant. If the there are fewer than three noisy pixels in the level2.evt file, extra rows are filled as -1
| Pixel properties | Quadrant properties | ||||||
|---|---|---|---|---|---|---|---|
| Quadrant | DetID | PixID | Counts | Sigma | Mean | Median | Sigma |
| A | 1 | 162 | 29507 | 143.52 | 968 | 944 | 199.0 |
| A | 8 | 15 | 10860 | 49.82 | 968 | 944 | 199.0 |
| A | 1 | 178 | 10001 | 45.51 | 968 | 944 | 199.0 |
| B | 3 | 64 | 133940 | 696.58 | 973 | 949 | 190.9 |
| B | 4 | 173 | 44871 | 230.06 | 973 | 949 | 190.9 |
| B | 0 | 189 | 42214 | 216.14 | 973 | 949 | 190.9 |
| C | 6 | 96 | 136934 | 607.48 | 954 | 961 | 223.8 |
| C | 15 | 208 | 33949 | 147.38 | 954 | 961 | 223.8 |
| C | 13 | 61 | 6829 | 26.22 | 954 | 961 | 223.8 |
| D | 1 | 52 | 1103768 | 4894.89 | 930 | 905 | 225.3 |
| D | 8 | 195 | 138044 | 608.67 | 930 | 905 | 225.3 |
| D | 2 | 136 | 51334 | 223.82 | 930 | 905 | 225.3 |
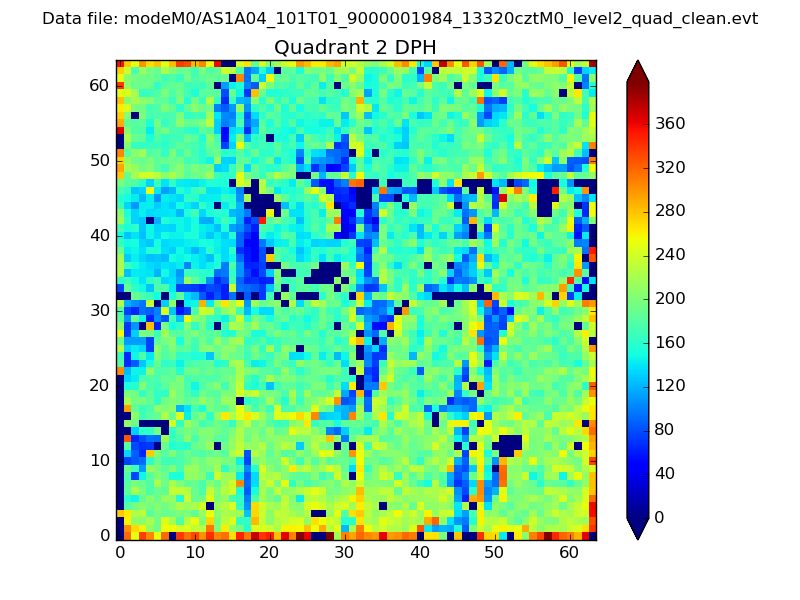
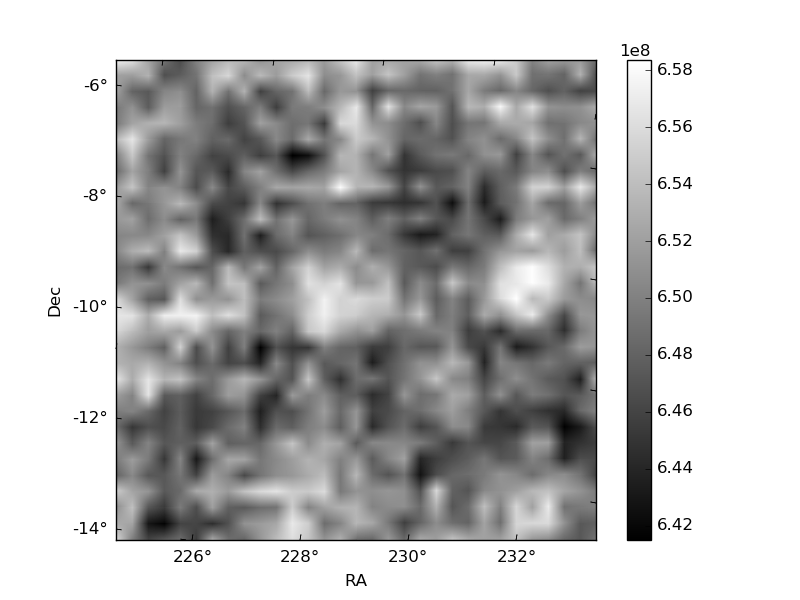
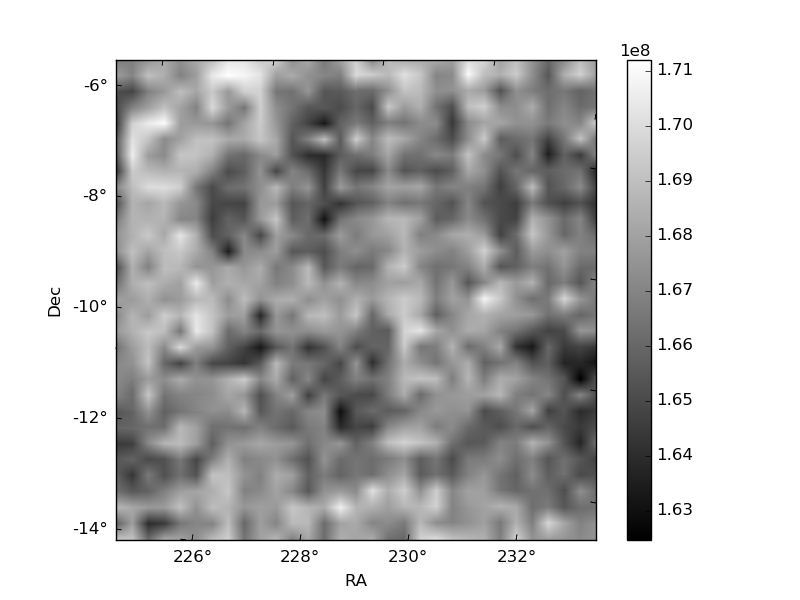
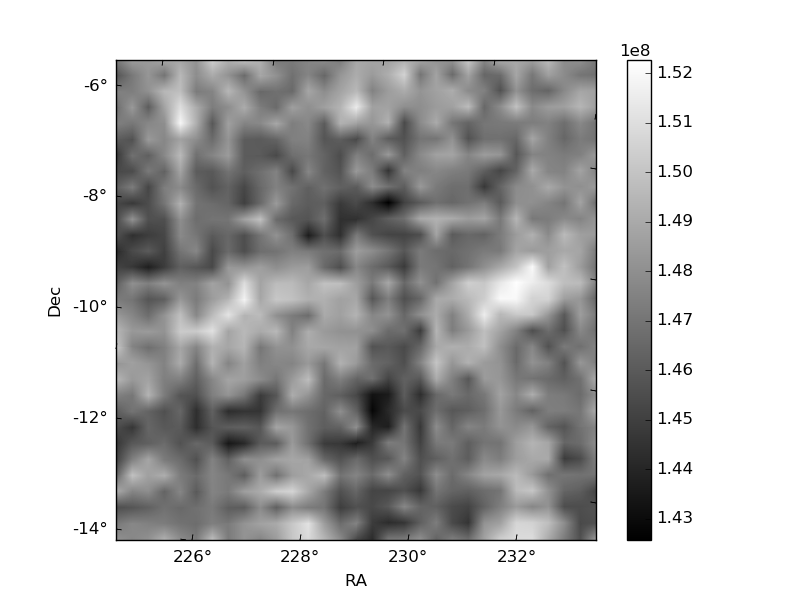
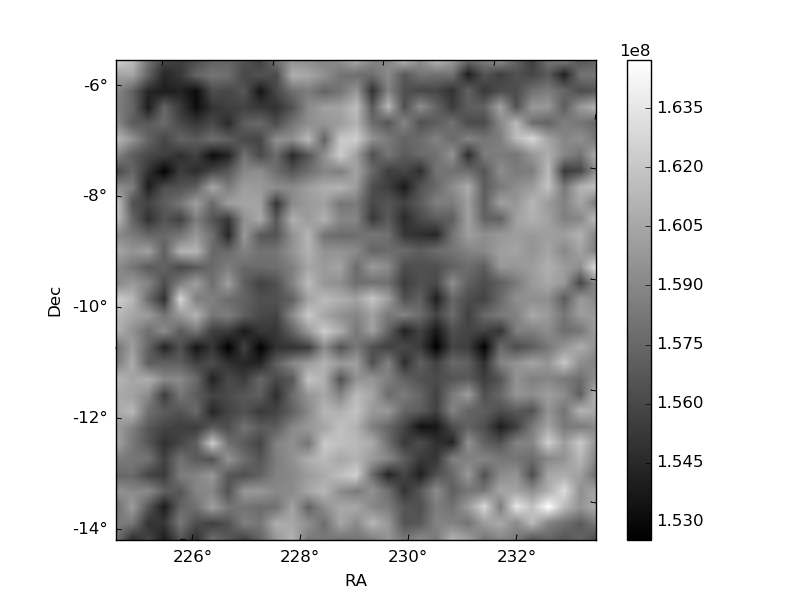
Histogram calculated using DETX and DETY for each event in the final _common_clean file
| Quadrant A | 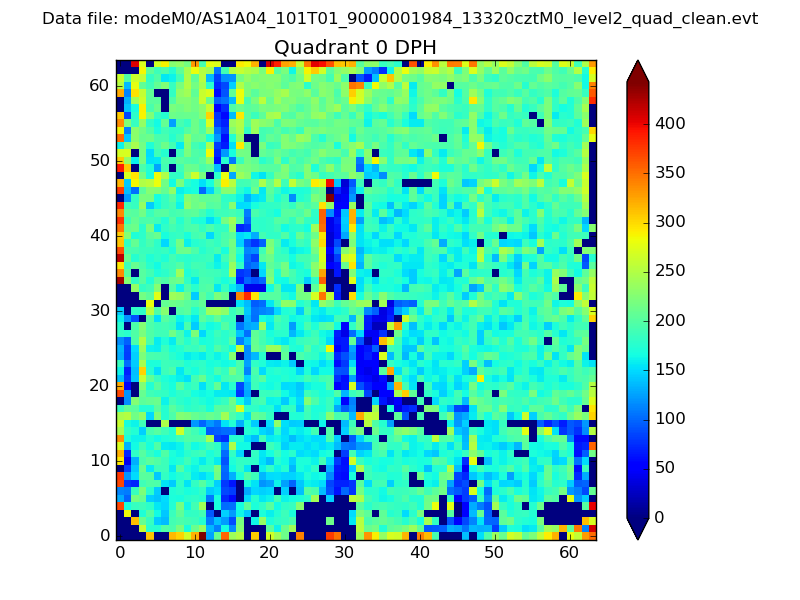 |
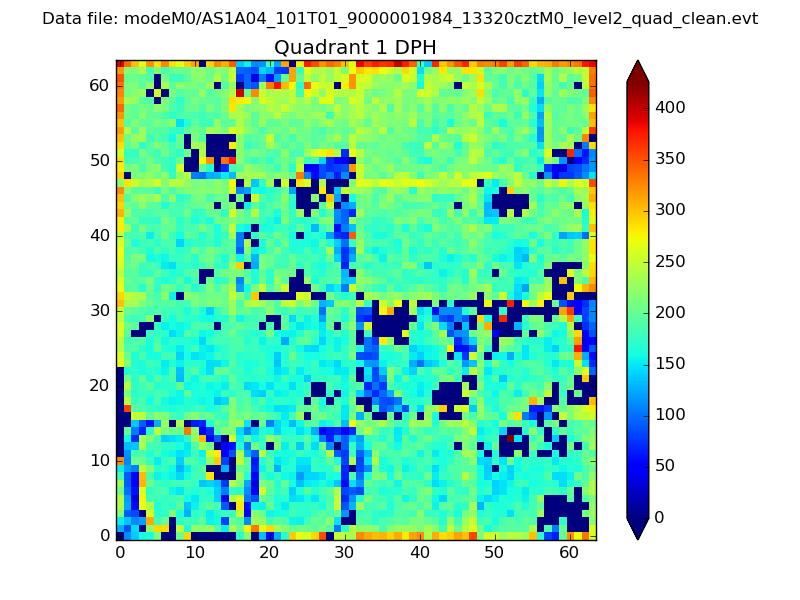 |
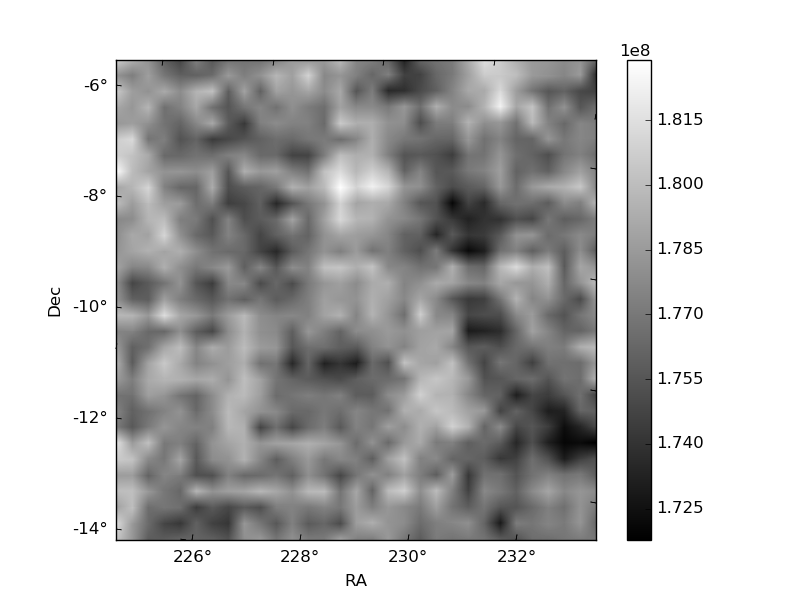
Quadrant B |
|---|---|---|---|
| Quadrant D | 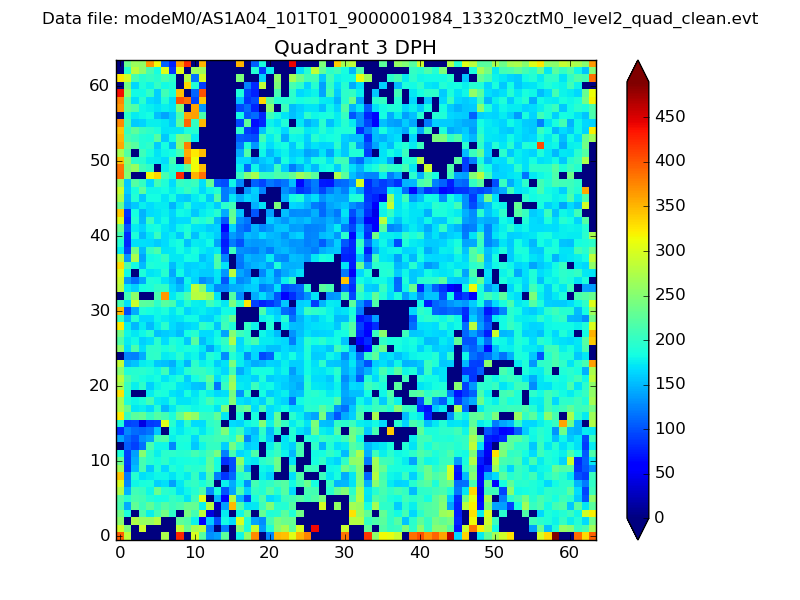 |
 |
Quadrant C |
| Plot type | Count rate plots | Images |
|---|---|---|
| Comparison with Poisson distribution Blue bars denote a histogram of data divided into 1 sec bins. Red curve is a Poisson curve with rate = median count rate of data. |
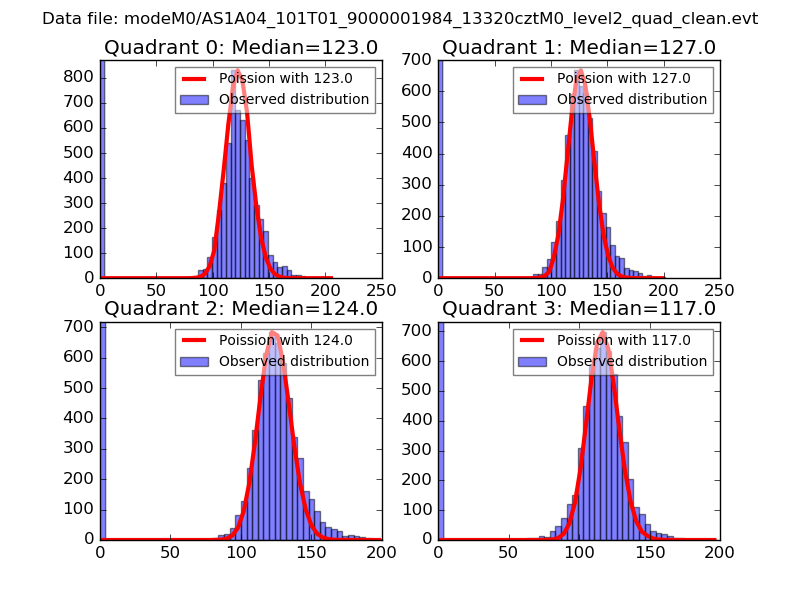 |
 |
| Quadrant-wise count rates Data is divided into 100 sec bins |
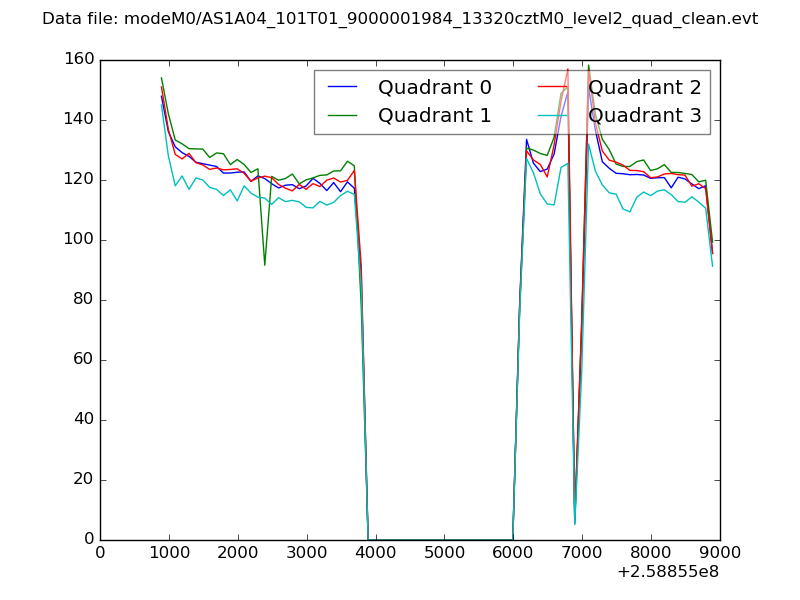 |
|
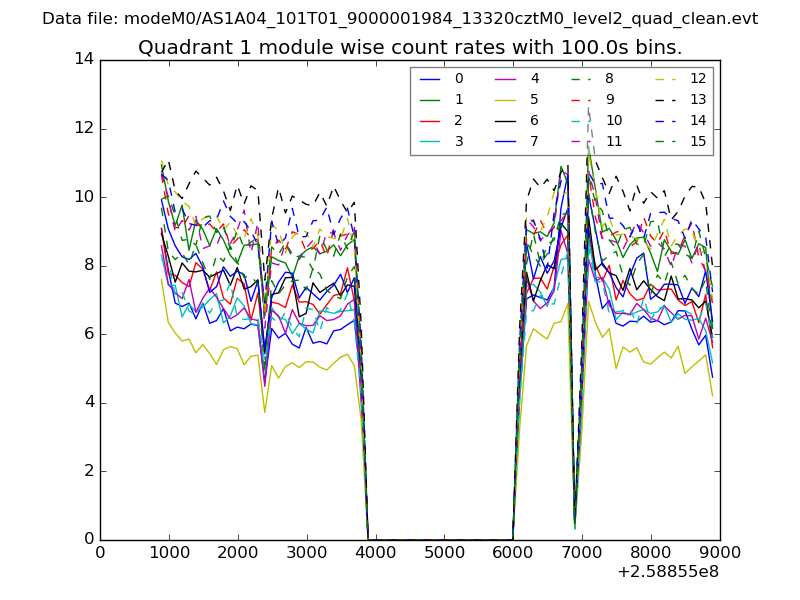
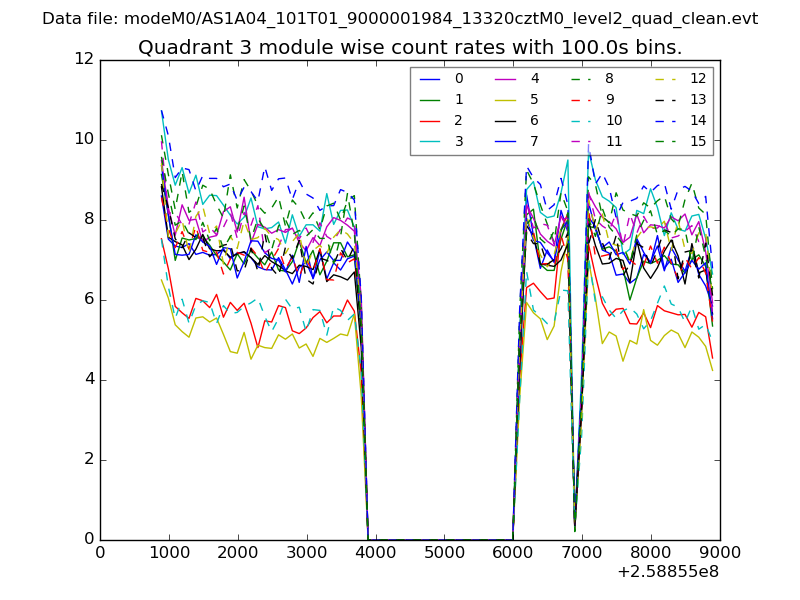
| Module-wise count rates for Quadrant A Data is divided into 100 sec bins |
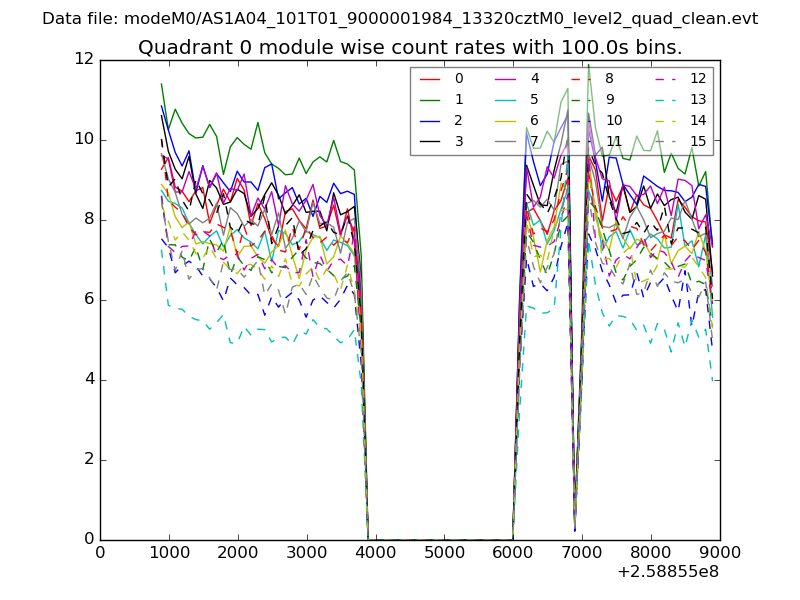 |
 |
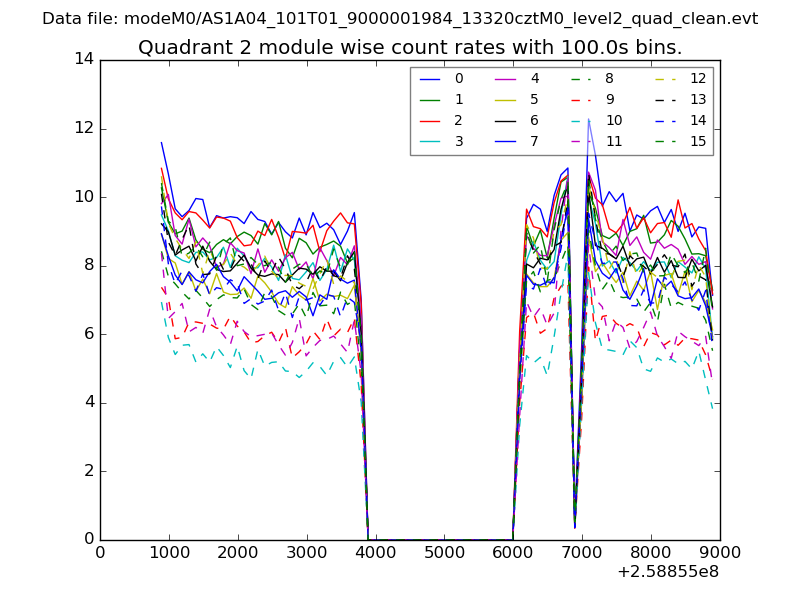
| Module-wise count rates for Quadrant B Data is divided into 100 sec bins |
 |
 |
| Module-wise count rates for Quadrant C Data is divided into 100 sec bins |
 |
 |
| Module-wise count rates for Quadrant D Data is divided into 100 sec bins |
 |
 |
| Parameter | Plot |
|---|---|
| CZT HV Monitor | 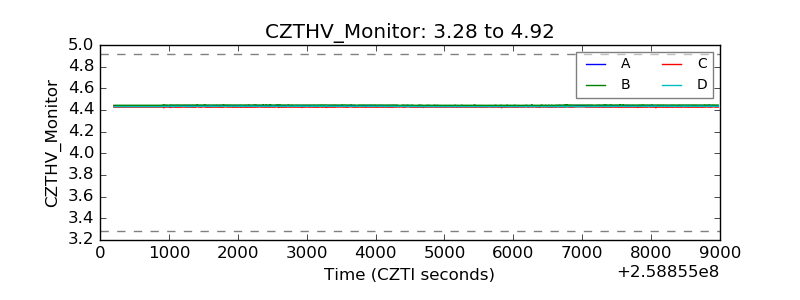 |
| D_VDD | 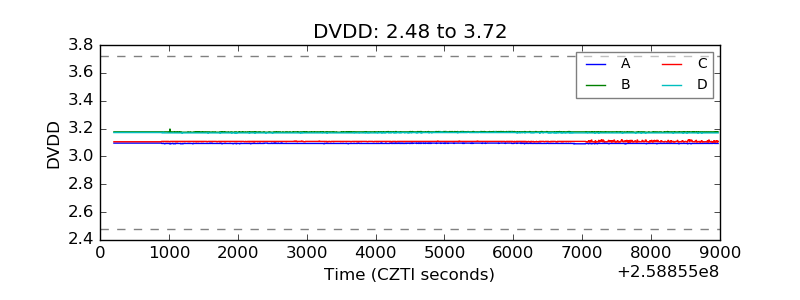 |
| Temperature 1 | 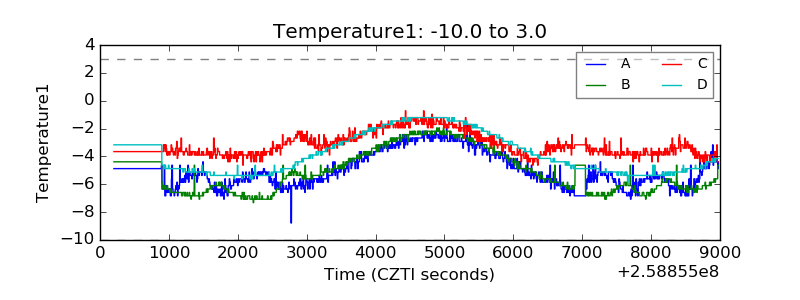 |
| Veto HV Monitor | 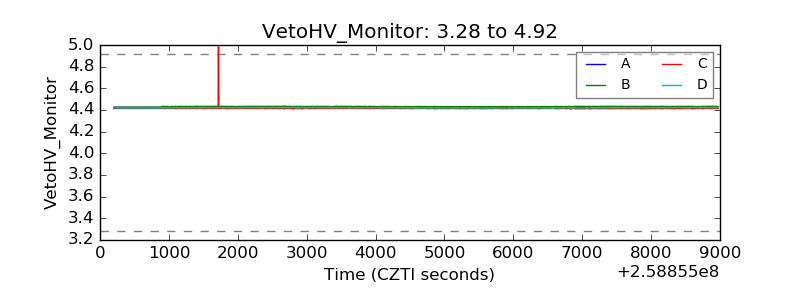 |
| Veto LLD | 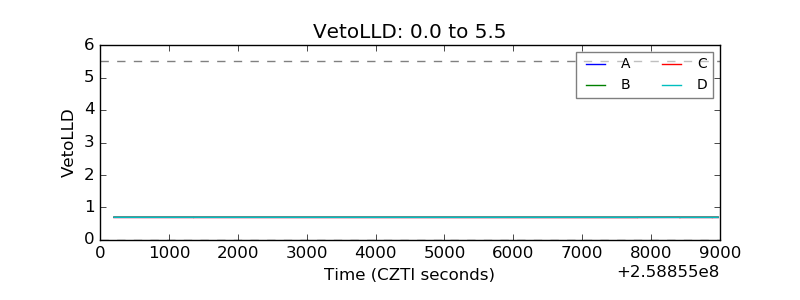 |
| Alpha Counter | 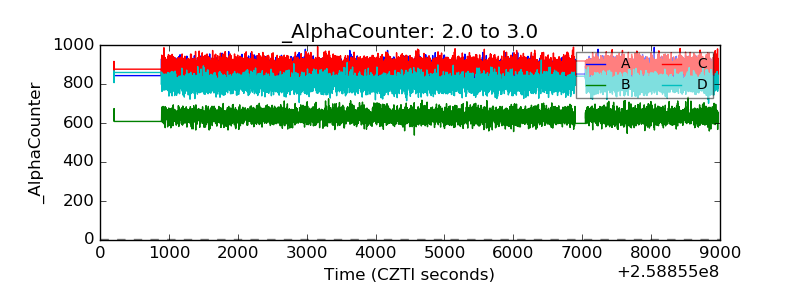 |
| _CPM_Rate | 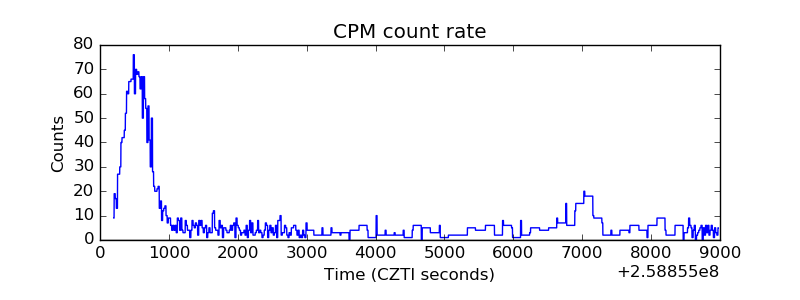 |
| CZT Counter | 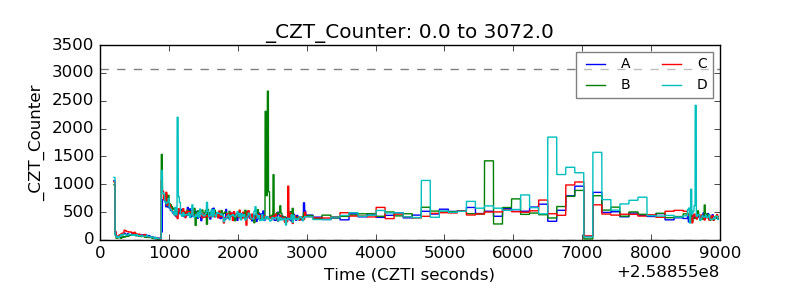 |
| +2.5 Volts monitor | 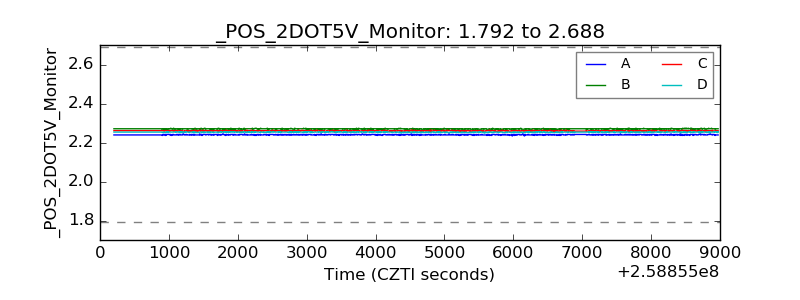 |
| +5 Volts monitor | 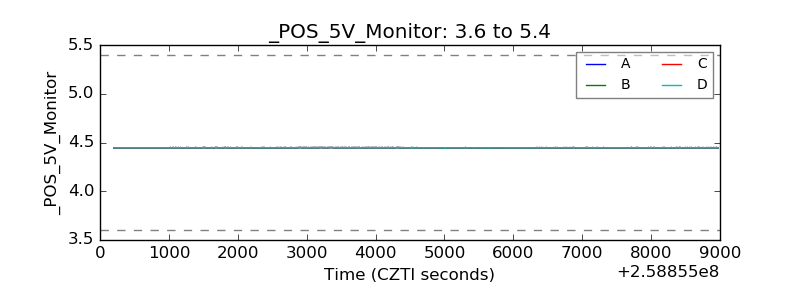 |
| _ROLL_ROT | 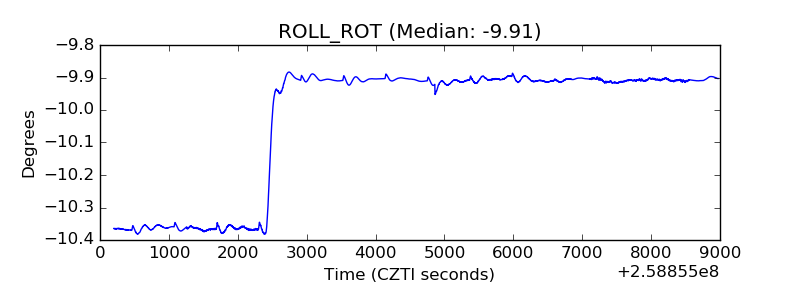 |
| _Roll_DEC | 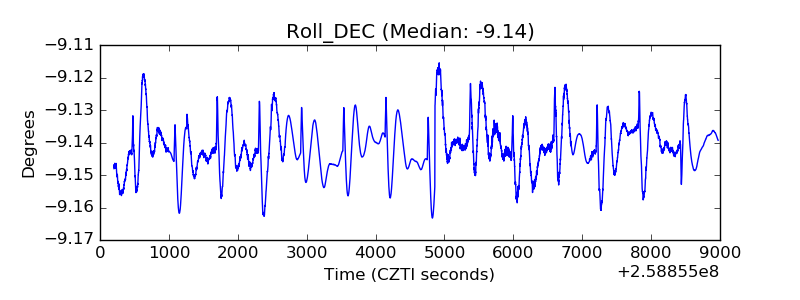 |
| _Roll_RA | 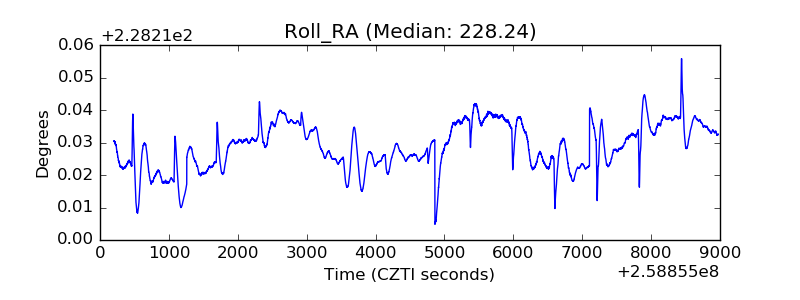 |
| Veto Counter | 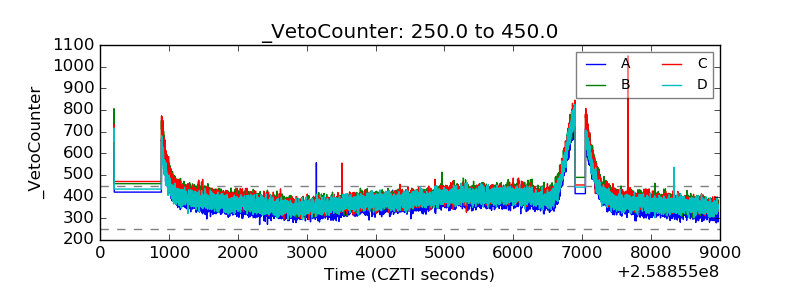 |