| Param | Original file | Final file |
|---|---|---|
| Filename | modeM0/AS1A04_101T01_9000001984_13325cztM0_level2.evt | modeM0/AS1A04_101T01_9000001984_13325cztM0_level2_quad_clean.evt |
| Size (bytes) | 2,189,977,920 | 332,043,840 |
| Size | 2.0 GB | 316.7 MB |
| Events in quadrant A | 14,306,088 | 2,032,235 |
| Events in quadrant B | 14,769,921 | 2,087,873 |
| Events in quadrant C | 13,692,557 | 2,045,518 |
| Events in quadrant D | 21,598,546 | 1,896,676 |
| Mode M9 | |||
|---|---|---|---|
| Quadrant | BADHDUFLAG | Total packets | Discarded packets |
| A | 0 | 25 | 0 |
| B | 0 | 25 | 0 |
| C | 0 | 25 | 0 |
| D | 0 | 25 | 0 |
| Mode SS | |||
|---|---|---|---|
| Quadrant | BADHDUFLAG | Total packets | Discarded packets |
| A | 0 | 590 | 0 |
| B | 0 | 590 | 0 |
| C | 0 | 590 | 0 |
| D | 0 | 590 | 0 |
| Mode M0 | |||
|---|---|---|---|
| Quadrant | BADHDUFLAG | Total packets | Discarded packets |
| A | 0 | 60940 | 6 |
| B | 0 | 61983 | 5 |
| C | 0 | 59879 | 5 |
| D | 0 | 83422 | 5 |
| Quadrant | Total seconds | Saturated seconds | Saturation percentage |
|---|---|---|---|
| A | 29004 | 345 | 1.189491% |
| B | 29004 | 522 | 1.799752% |
| C | 29004 | 288 | 0.992966% |
| D | 29004 | 1639 | 5.650945% |
Noise dominated data is calculated using 1-second bins in cleaned event files. If a bin has >2000 counts, and if more than 50% of those come from <1% of pixels, then it is considered to be noise-dominated and hence unusable.
| Quadrant | # 1 sec bins | Bins with >0 counts | Bins with >2000 counts | High rate bins dominated by noise | Noise dominated (total time) | Noise dominated (detector-on time) | Marked lightcurve |
|---|---|---|---|---|---|---|---|
| A | 31450 | 29010 | 5 | 5 | 0.02% | 0.02% | 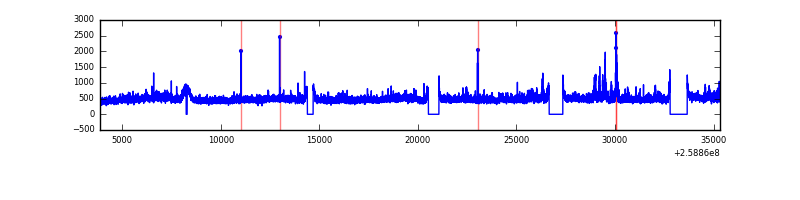 |
| B | 31450 | 29010 | 111 | 111 | 0.35% | 0.38% |  |
| C | 31450 | 29010 | 38 | 38 | 0.12% | 0.13% | 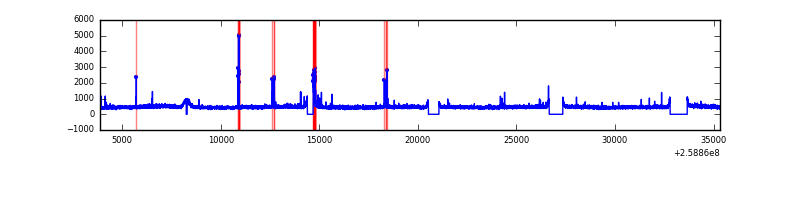 |
| D | 31450 | 29010 | 1131 | 1131 | 3.60% | 3.90% | 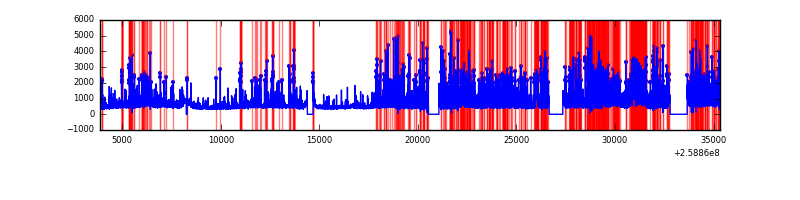 |
Top three noisy pixels from each quadrant. If the there are fewer than three noisy pixels in the level2.evt file, extra rows are filled as -1
| Pixel properties | Quadrant properties | ||||||
|---|---|---|---|---|---|---|---|
| Quadrant | DetID | PixID | Counts | Sigma | Mean | Median | Sigma |
| A | 8 | 15 | 614067 | 862.06 | 3499 | 3421 | 708.4 |
| A | 1 | 162 | 114600 | 156.95 | 3499 | 3421 | 708.4 |
| A | 1 | 178 | 41325 | 53.51 | 3499 | 3421 | 708.4 |
| B | 3 | 64 | 303430 | 447.49 | 3506 | 3423 | 670.4 |
| B | 4 | 142 | 207411 | 304.27 | 3506 | 3423 | 670.4 |
| B | 10 | 245 | 152688 | 222.64 | 3506 | 3423 | 670.4 |
| C | 15 | 208 | 270789 | 338.42 | 3414 | 3429 | 790.0 |
| C | 3 | 233 | 58479 | 69.68 | 3414 | 3429 | 790.0 |
| C | 6 | 96 | 47625 | 55.94 | 3414 | 3429 | 790.0 |
| D | 1 | 52 | 7274762 | 9099.38 | 3336 | 3239 | 799.1 |
| D | 8 | 195 | 1073229 | 1338.96 | 3336 | 3239 | 799.1 |
| D | 2 | 136 | 200242 | 246.52 | 3336 | 3239 | 799.1 |
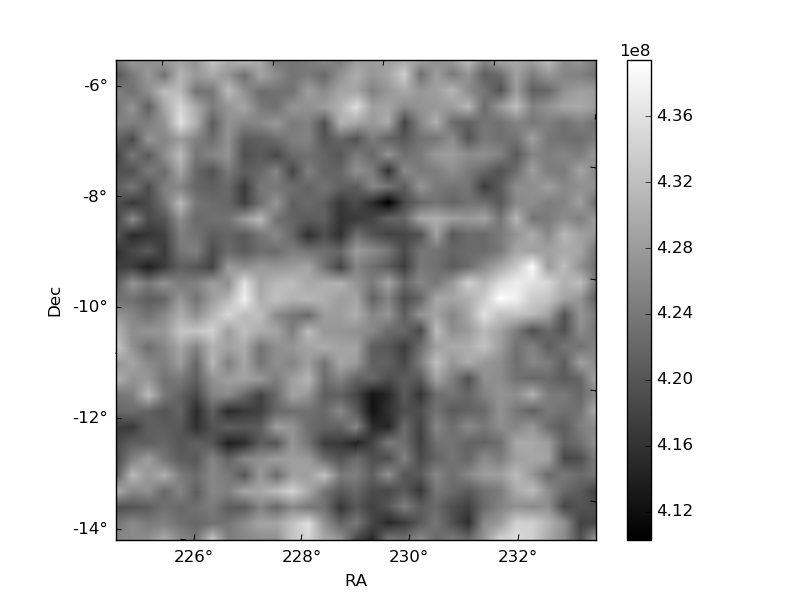
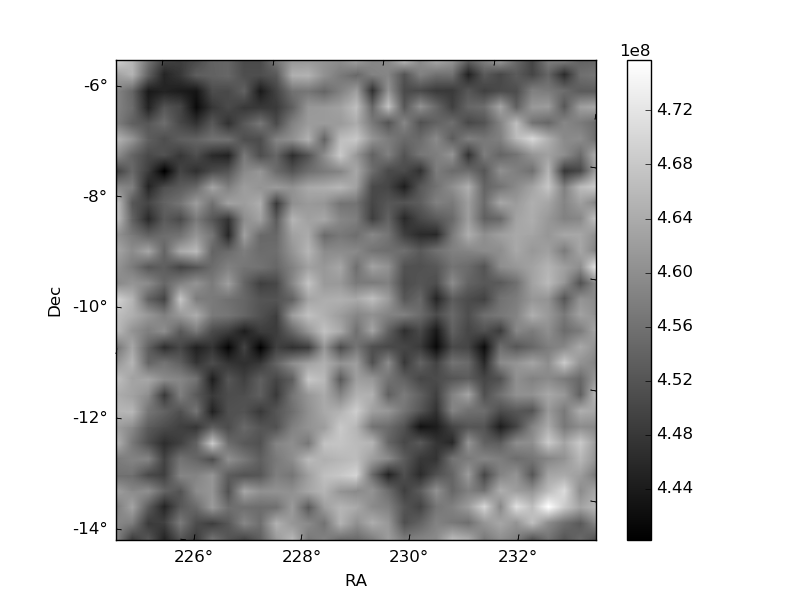
Histogram calculated using DETX and DETY for each event in the final _common_clean file
| Quadrant A |  |
 |
Quadrant B |
|---|---|---|---|
| Quadrant D | 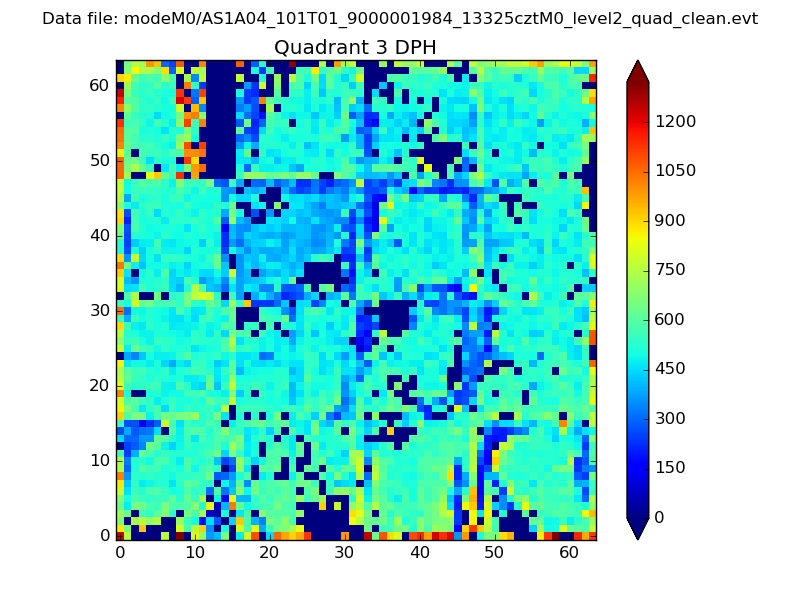 |
 |
Quadrant C |
| Plot type | Count rate plots | Images |
|---|---|---|
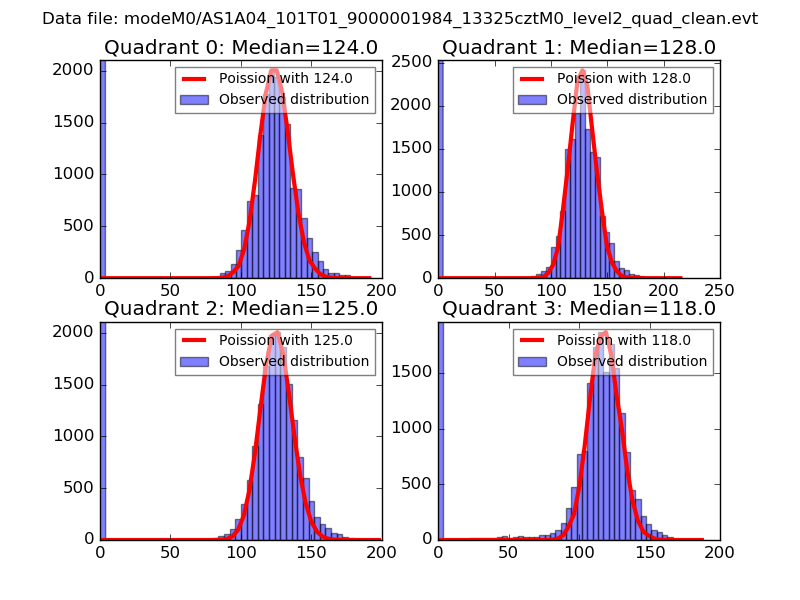
| Comparison with Poisson distribution Blue bars denote a histogram of data divided into 1 sec bins. Red curve is a Poisson curve with rate = median count rate of data. |
 |
 |
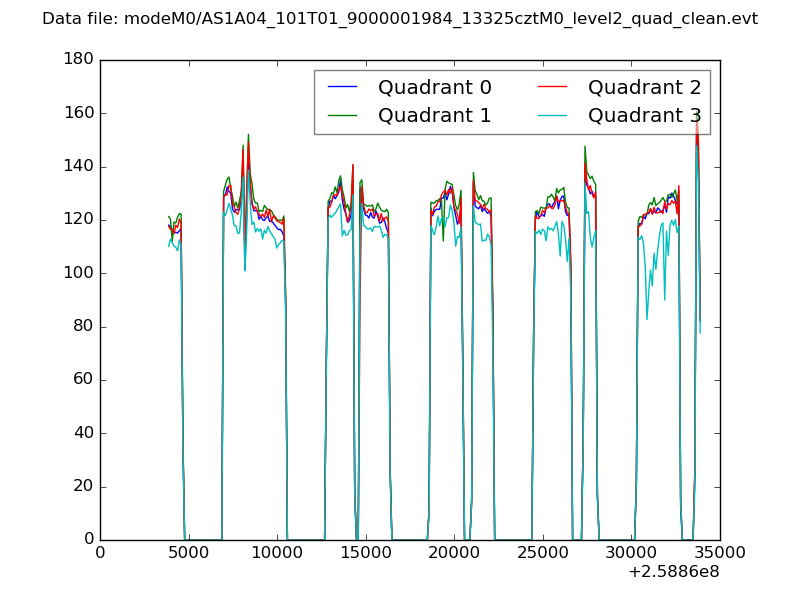
| Quadrant-wise count rates Data is divided into 100 sec bins |
 |
|
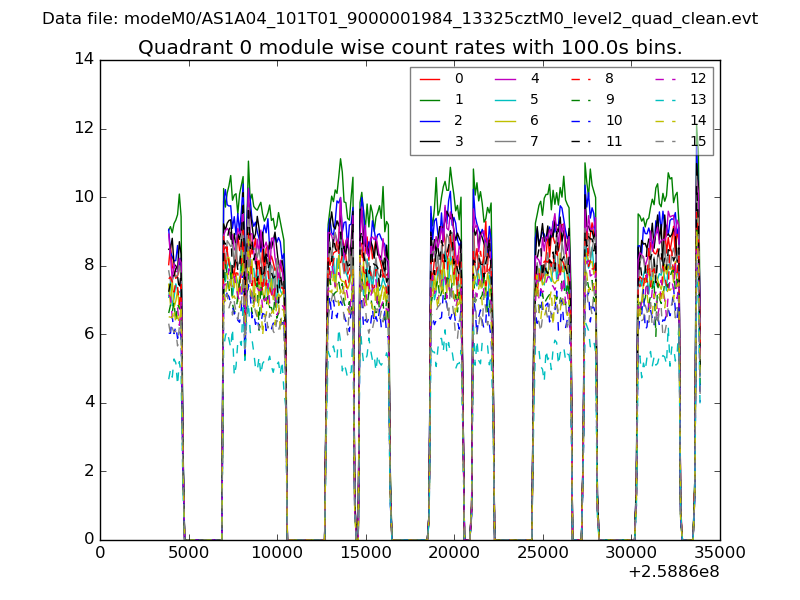
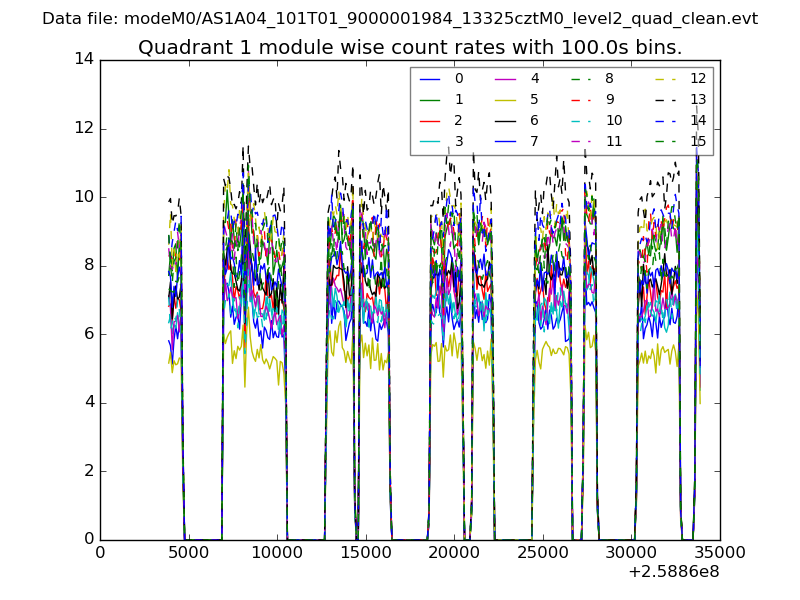
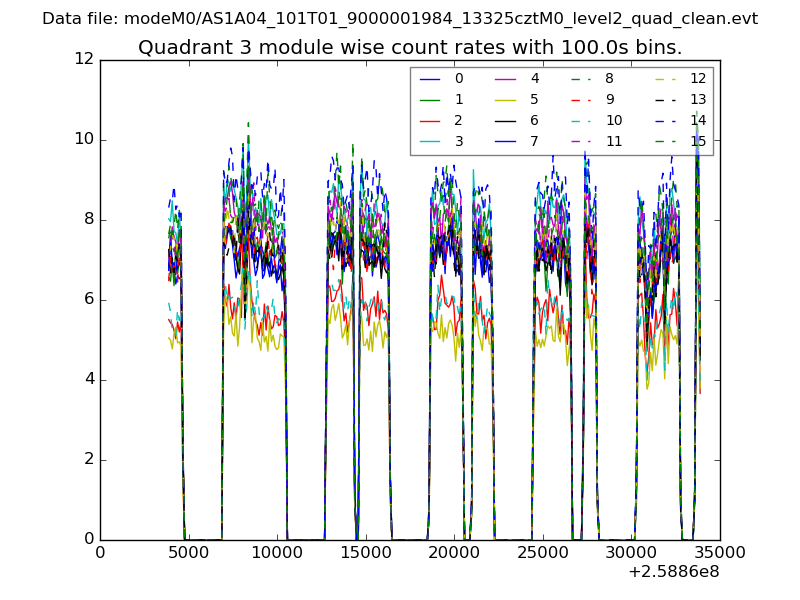
| Module-wise count rates for Quadrant A Data is divided into 100 sec bins |
 |
 |
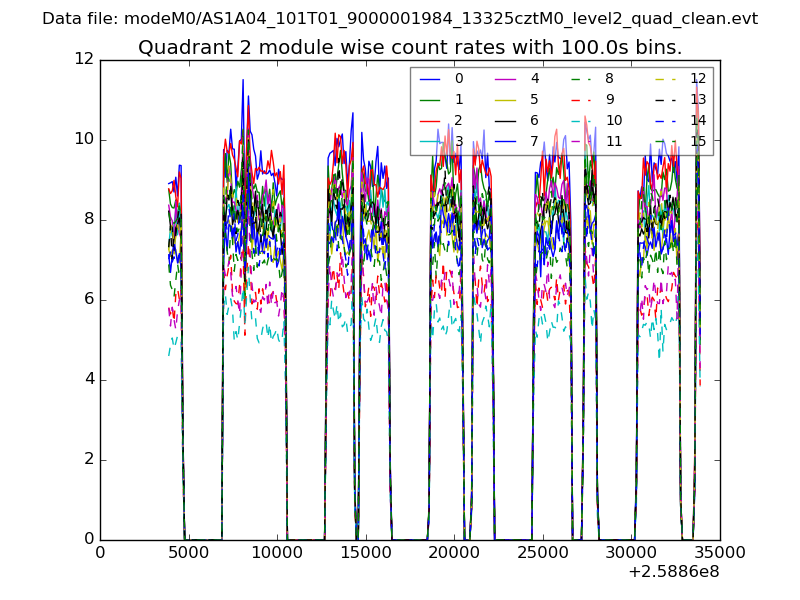
| Module-wise count rates for Quadrant B Data is divided into 100 sec bins |
 |
 |
| Module-wise count rates for Quadrant C Data is divided into 100 sec bins |
 |
 |
| Module-wise count rates for Quadrant D Data is divided into 100 sec bins |
 |
 |
| Parameter | Plot |
|---|---|
| CZT HV Monitor | 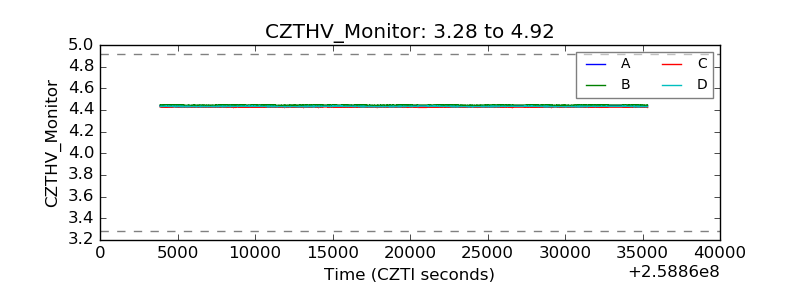 |
| D_VDD | 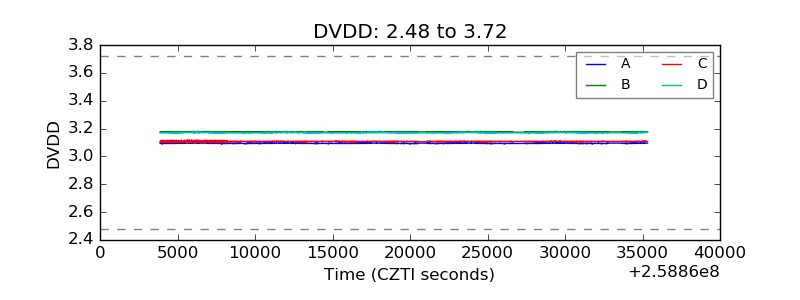 |
| Temperature 1 | 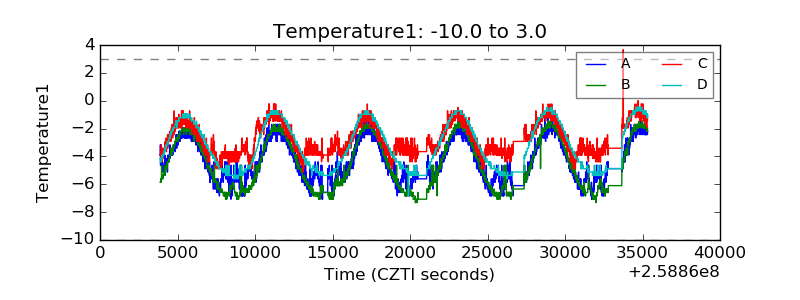 |
| Veto HV Monitor | 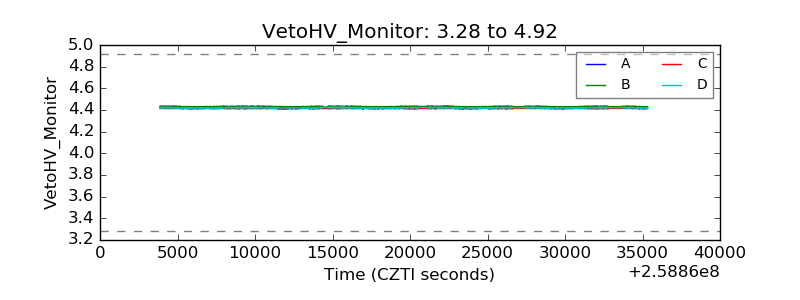 |
| Veto LLD | 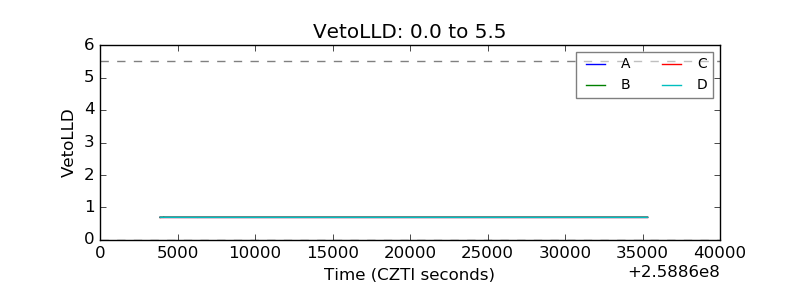 |
| Alpha Counter | 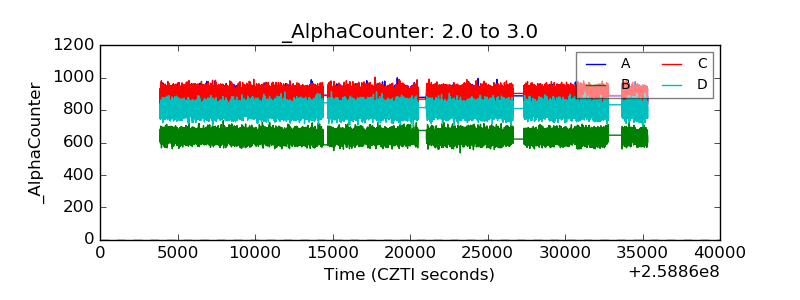 |
| _CPM_Rate | 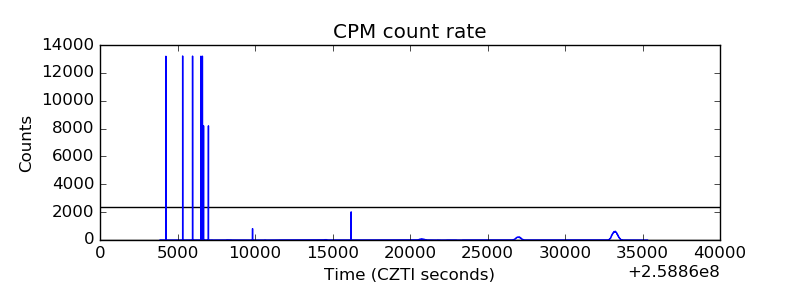 |
| CZT Counter | 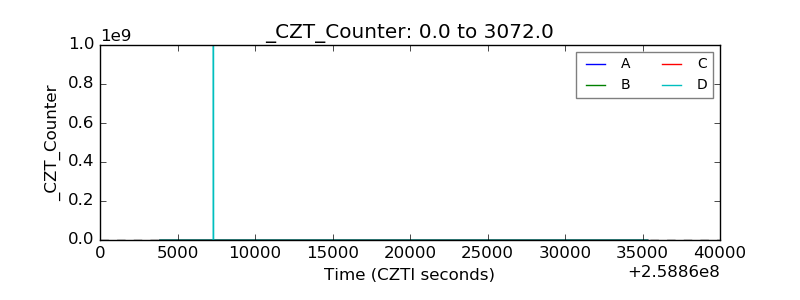 |
| +2.5 Volts monitor |  |
| +5 Volts monitor |  |
| _ROLL_ROT | 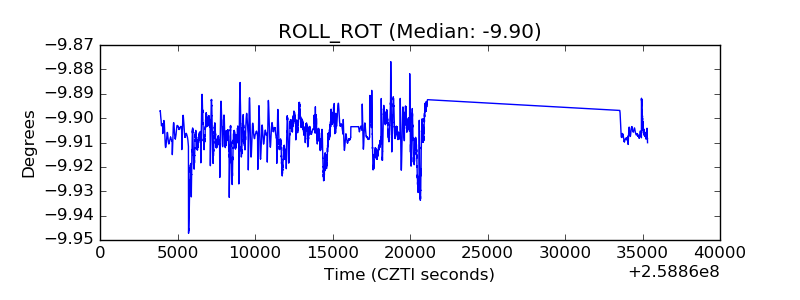 |
| _Roll_DEC | 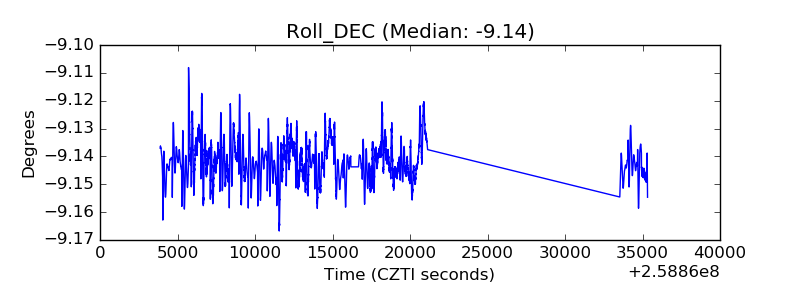 |
| _Roll_RA | 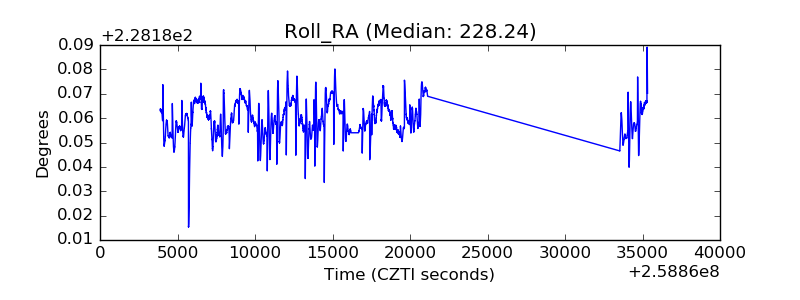 |
| Veto Counter | 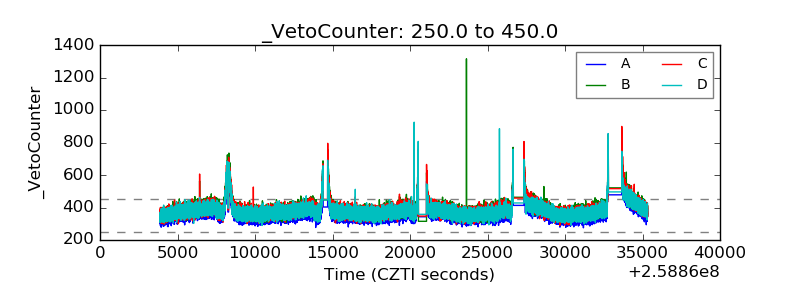 |