| Param | Original file | Final file |
|---|---|---|
| Filename | modeM0/AS1A04_101T01_9000001984_13326cztM0_level2.evt | modeM0/AS1A04_101T01_9000001984_13326cztM0_level2_quad_clean.evt |
| Size (bytes) | 1,662,655,680 | 259,191,360 |
| Size | 1.5 GB | 247.2 MB |
| Events in quadrant A | 11,227,692 | 1,570,941 |
| Events in quadrant B | 11,999,866 | 1,611,323 |
| Events in quadrant C | 11,110,084 | 1,579,356 |
| Events in quadrant D | 14,451,562 | 1,493,980 |
| Mode M9 | |||
|---|---|---|---|
| Quadrant | BADHDUFLAG | Total packets | Discarded packets |
| A | 0 | 19 | 0 |
| B | 0 | 19 | 0 |
| C | 0 | 19 | 0 |
| D | 0 | 19 | 0 |
| Mode SS | |||
|---|---|---|---|
| Quadrant | BADHDUFLAG | Total packets | Discarded packets |
| A | 0 | 472 | 0 |
| B | 0 | 472 | 0 |
| C | 0 | 472 | 0 |
| D | 0 | 472 | 0 |
| Mode M0 | |||
|---|---|---|---|
| Quadrant | BADHDUFLAG | Total packets | Discarded packets |
| A | 0 | 48261 | 11 |
| B | 0 | 50284 | 9 |
| C | 0 | 48277 | 10 |
| D | 0 | 58133 | 7 |
| Quadrant | Total seconds | Saturated seconds | Saturation percentage |
|---|---|---|---|
| A | 23160 | 318 | 1.373057% |
| B | 23160 | 476 | 2.055268% |
| C | 23159 | 259 | 1.118356% |
| D | 23161 | 729 | 3.147532% |
Noise dominated data is calculated using 1-second bins in cleaned event files. If a bin has >2000 counts, and if more than 50% of those come from <1% of pixels, then it is considered to be noise-dominated and hence unusable.
| Quadrant | # 1 sec bins | Bins with >0 counts | Bins with >2000 counts | High rate bins dominated by noise | Noise dominated (total time) | Noise dominated (detector-on time) | Marked lightcurve |
|---|---|---|---|---|---|---|---|
| A | 37603 | 23167 | 2 | 2 | 0.01% | 0.01% | 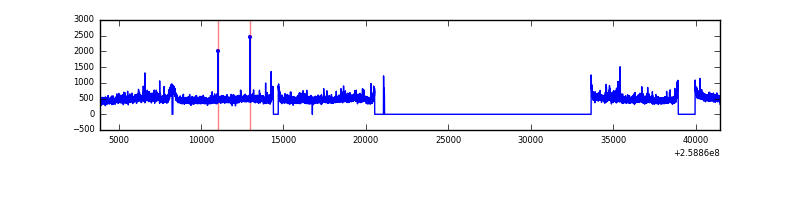 |
| B | 37603 | 23167 | 99 | 99 | 0.26% | 0.43% | 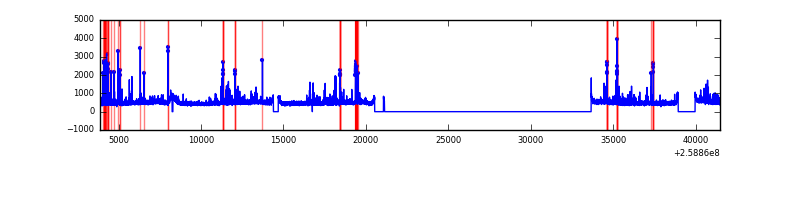 |
| C | 37603 | 23167 | 38 | 38 | 0.10% | 0.16% | 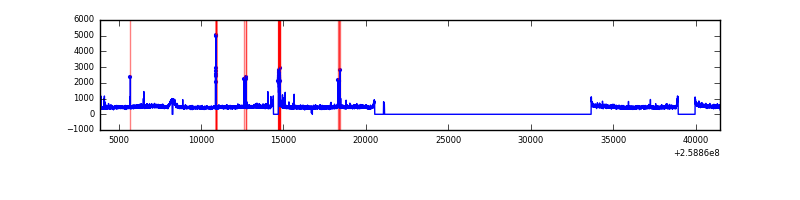 |
| D | 37603 | 23168 | 342 | 342 | 0.91% | 1.48% | 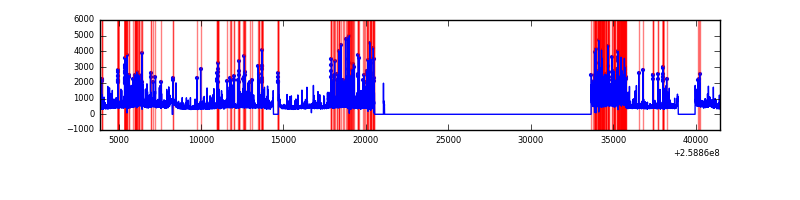 |
Top three noisy pixels from each quadrant. If the there are fewer than three noisy pixels in the level2.evt file, extra rows are filled as -1
| Pixel properties | Quadrant properties | ||||||
|---|---|---|---|---|---|---|---|
| Quadrant | DetID | PixID | Counts | Sigma | Mean | Median | Sigma |
| A | 8 | 15 | 142814 | 244.0 | 2833 | 2767 | 574.0 |
| A | 1 | 162 | 94992 | 160.68 | 2833 | 2767 | 574.0 |
| A | 1 | 178 | 34879 | 55.95 | 2833 | 2767 | 574.0 |
| B | 3 | 64 | 285686 | 524.55 | 2837 | 2769 | 539.3 |
| B | 4 | 142 | 186473 | 340.6 | 2837 | 2769 | 539.3 |
| B | 10 | 245 | 143286 | 260.53 | 2837 | 2769 | 539.3 |
| C | 15 | 208 | 252295 | 390.6 | 2759 | 2769 | 638.8 |
| C | 6 | 96 | 46665 | 68.71 | 2759 | 2769 | 638.8 |
| C | 3 | 233 | 46228 | 68.03 | 2759 | 2769 | 638.8 |
| D | 1 | 52 | 2733632 | 4186.55 | 2725 | 2644 | 652.3 |
| D | 8 | 195 | 909665 | 1390.44 | 2725 | 2644 | 652.3 |
| D | 2 | 136 | 145714 | 219.32 | 2725 | 2644 | 652.3 |
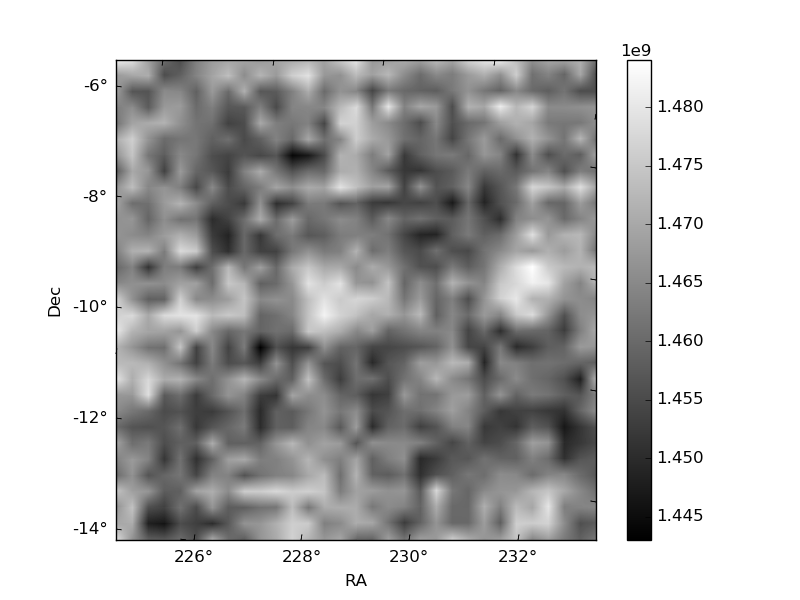
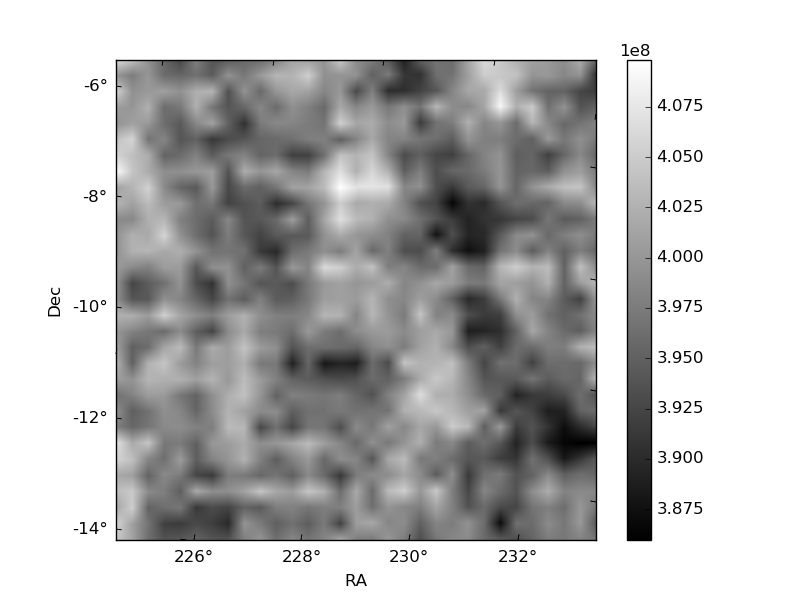
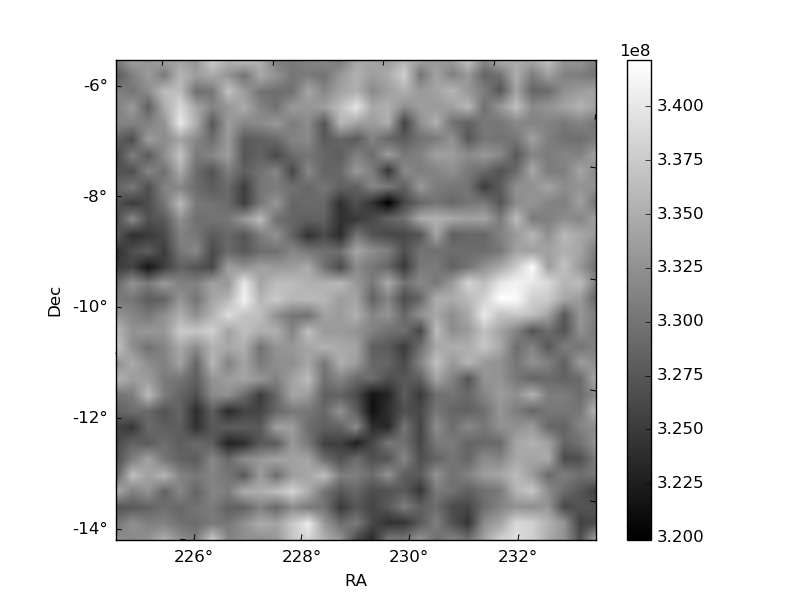
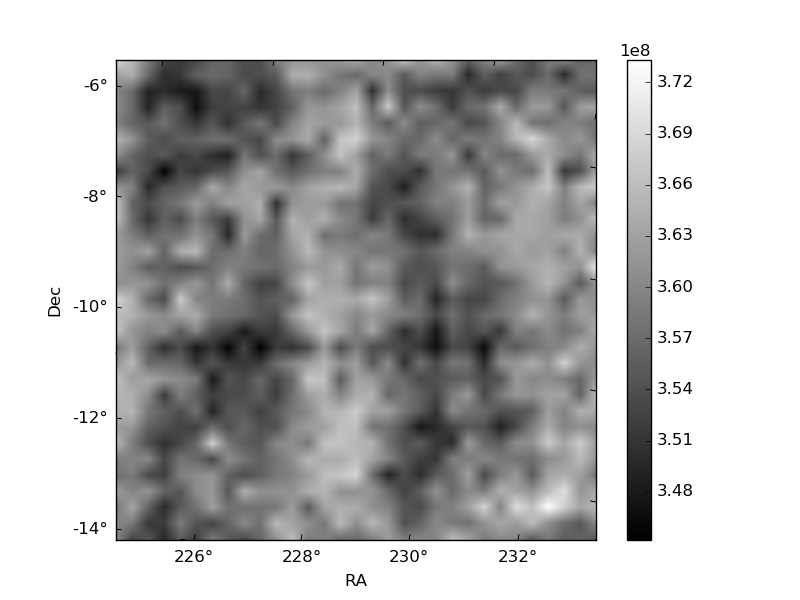
Histogram calculated using DETX and DETY for each event in the final _common_clean file
| Quadrant A | 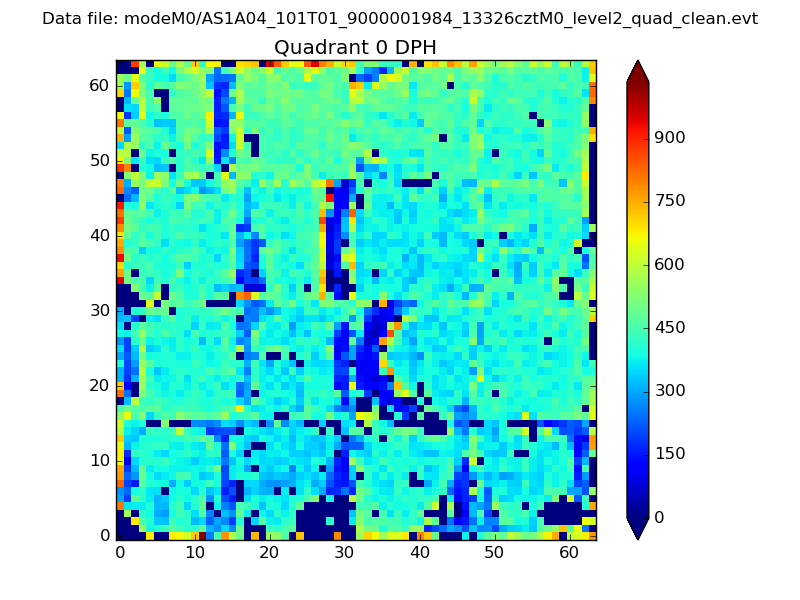 |
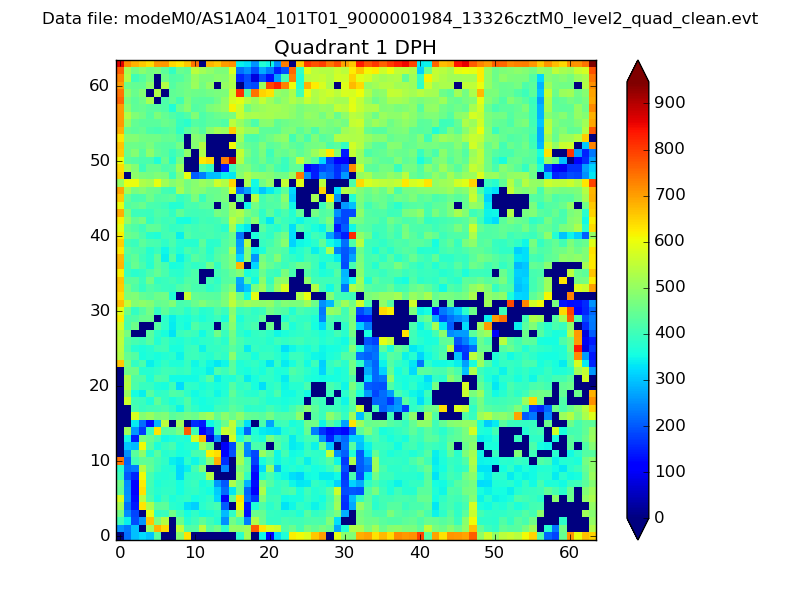 |
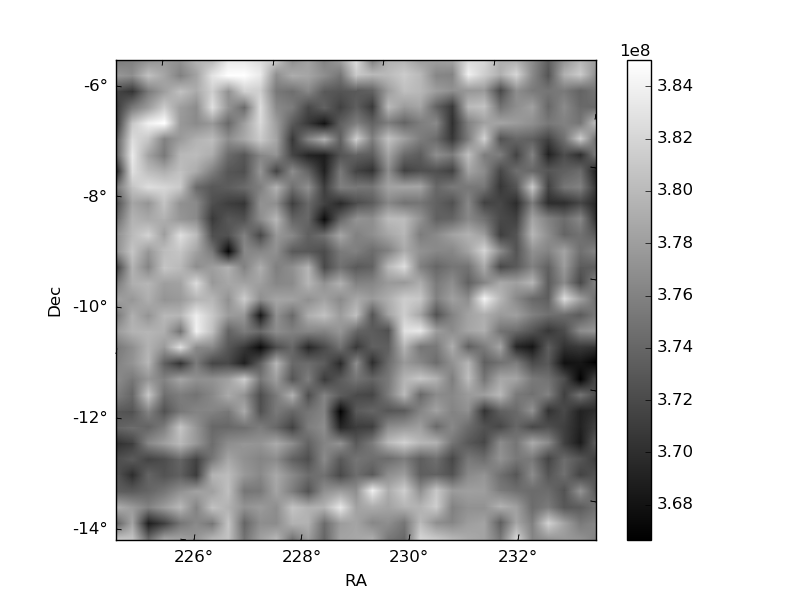
Quadrant B |
|---|---|---|---|
| Quadrant D | 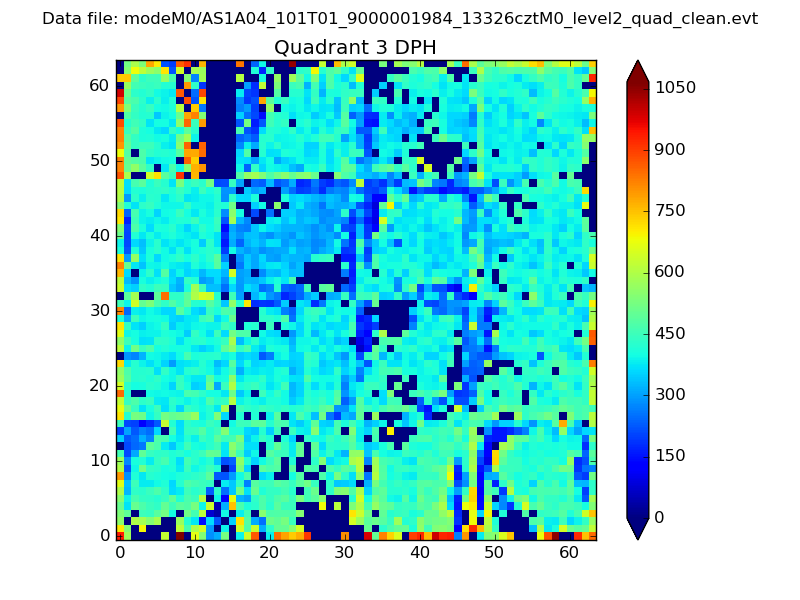 |
 |
Quadrant C |
| Plot type | Count rate plots | Images |
|---|---|---|
| Comparison with Poisson distribution Blue bars denote a histogram of data divided into 1 sec bins. Red curve is a Poisson curve with rate = median count rate of data. |
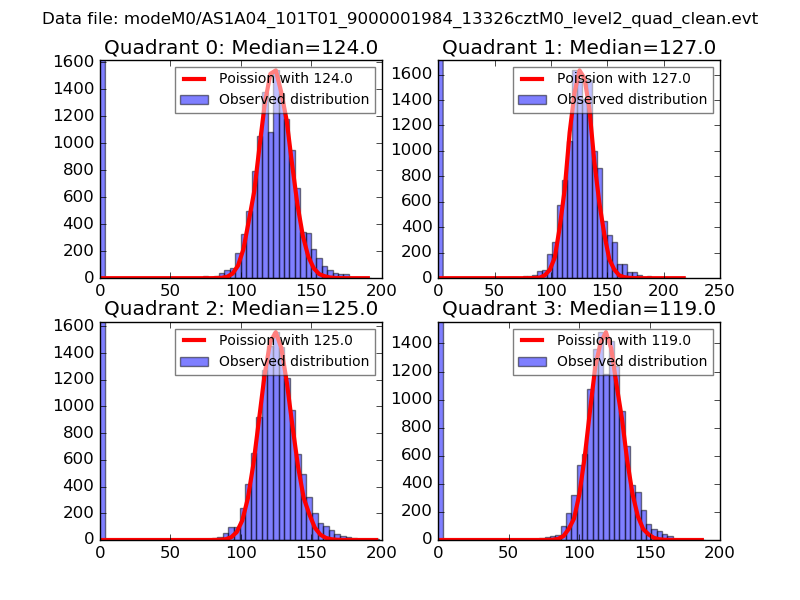 |
 |
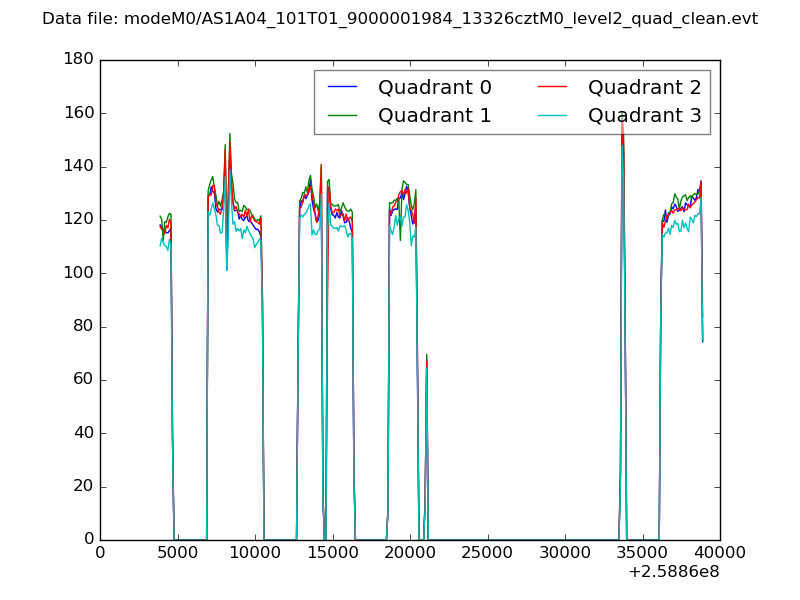
| Quadrant-wise count rates Data is divided into 100 sec bins |
 |
|
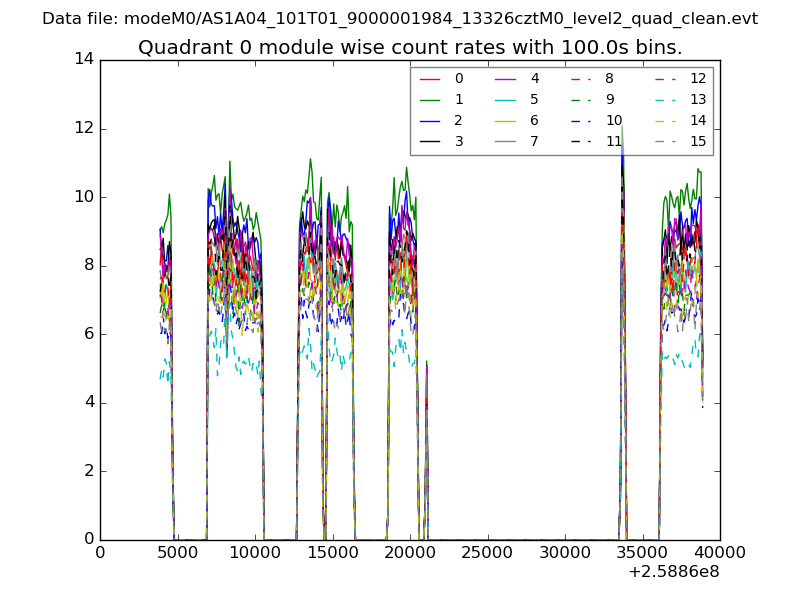
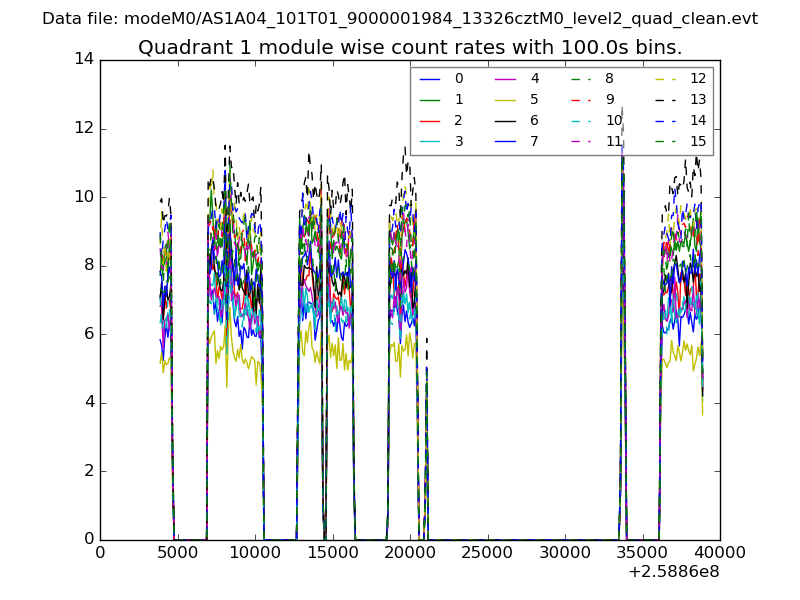
| Module-wise count rates for Quadrant A Data is divided into 100 sec bins |
 |
 |
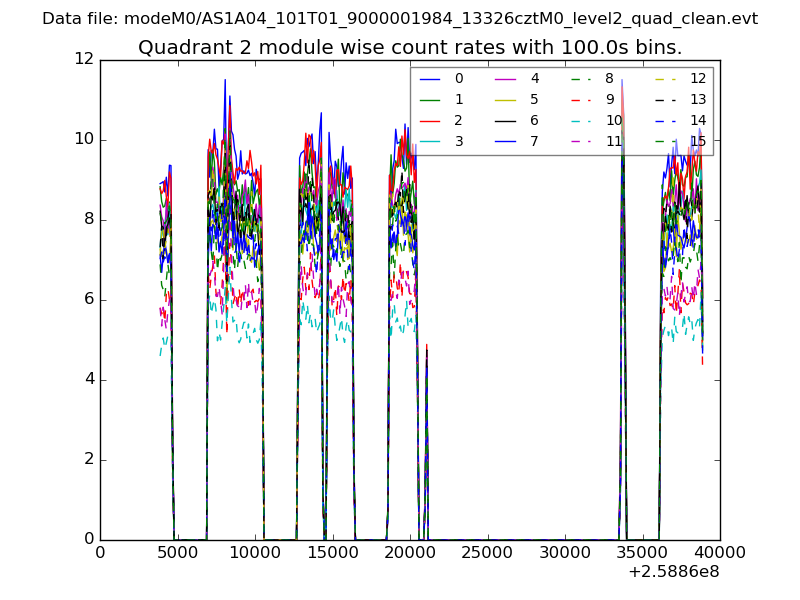
| Module-wise count rates for Quadrant B Data is divided into 100 sec bins |
 |
 |
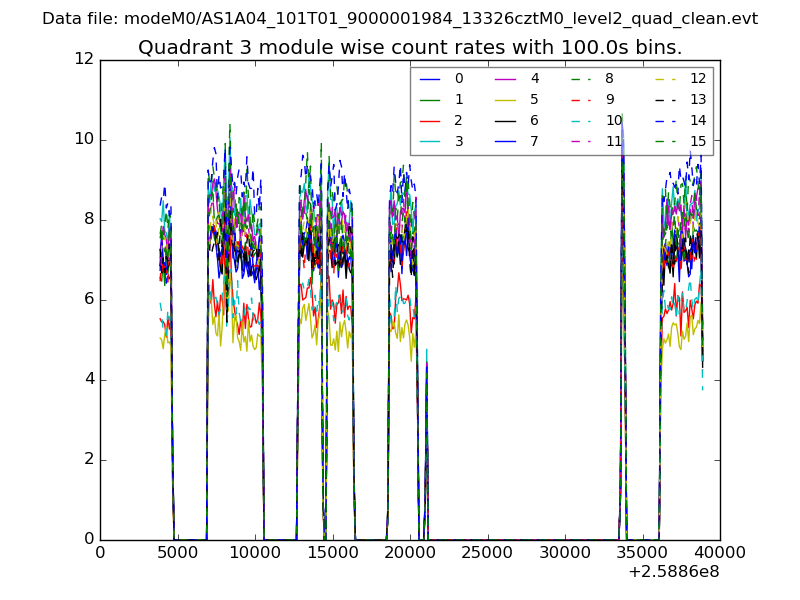
| Module-wise count rates for Quadrant C Data is divided into 100 sec bins |
 |
 |
| Module-wise count rates for Quadrant D Data is divided into 100 sec bins |
 |
 |
| Parameter | Plot |
|---|---|
| CZT HV Monitor | 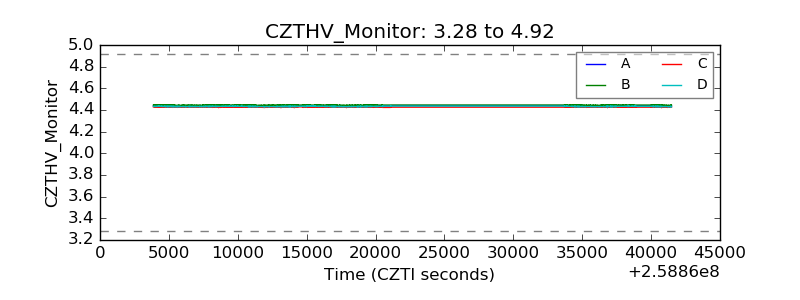 |
| D_VDD | 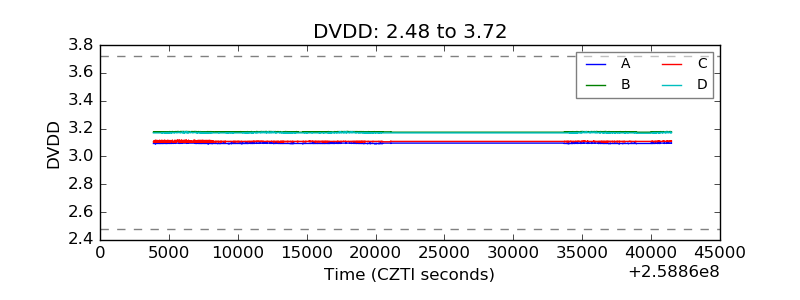 |
| Temperature 1 | 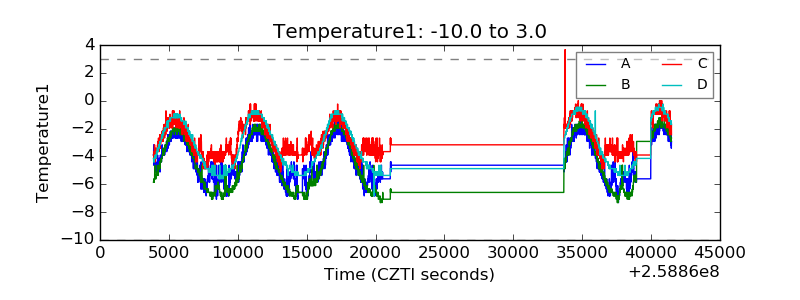 |
| Veto HV Monitor | 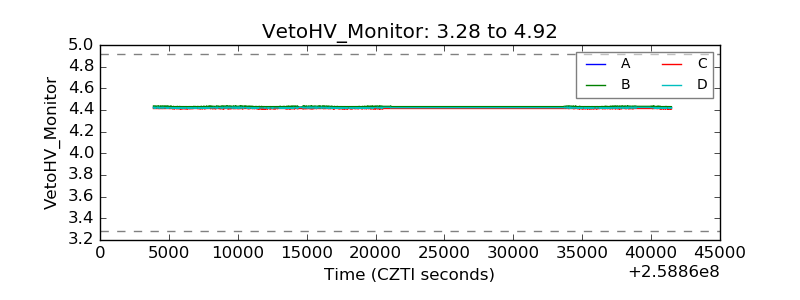 |
| Veto LLD | 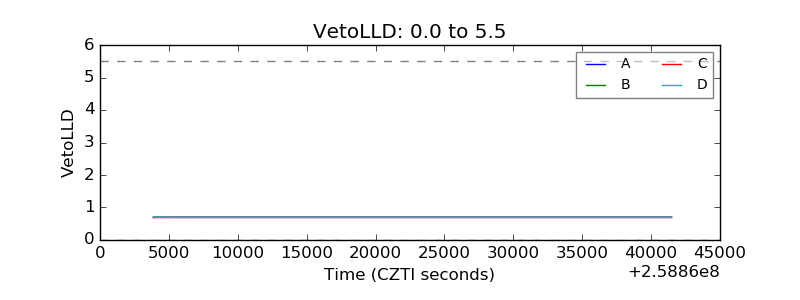 |
| Alpha Counter | 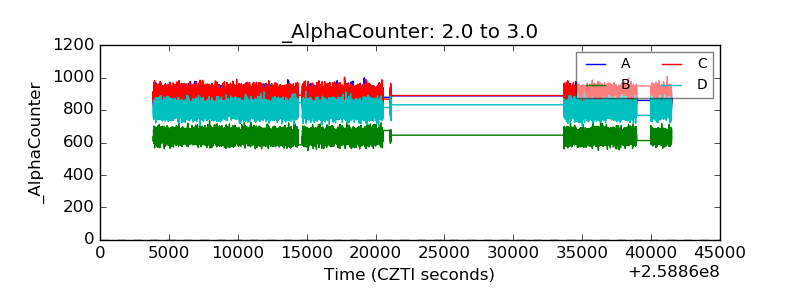 |
| _CPM_Rate | 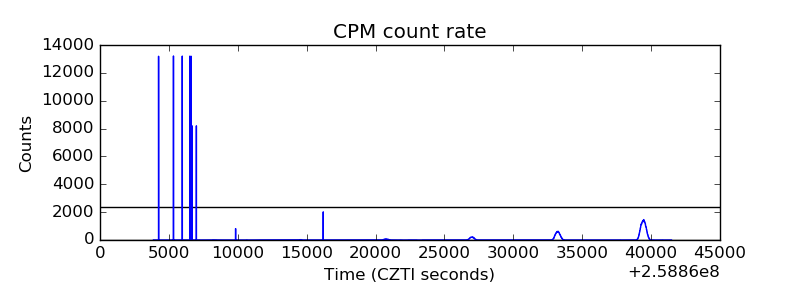 |
| CZT Counter |  |
| +2.5 Volts monitor |  |
| +5 Volts monitor |  |
| _ROLL_ROT | 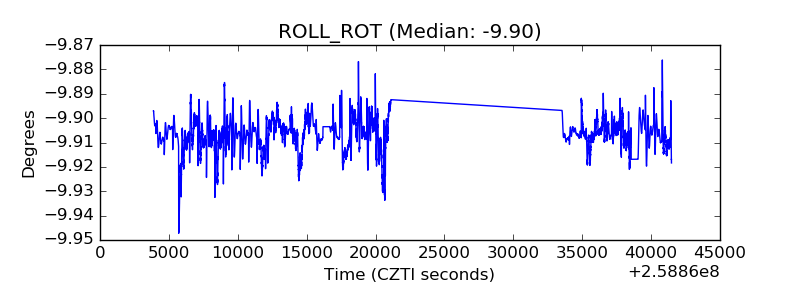 |
| _Roll_DEC | 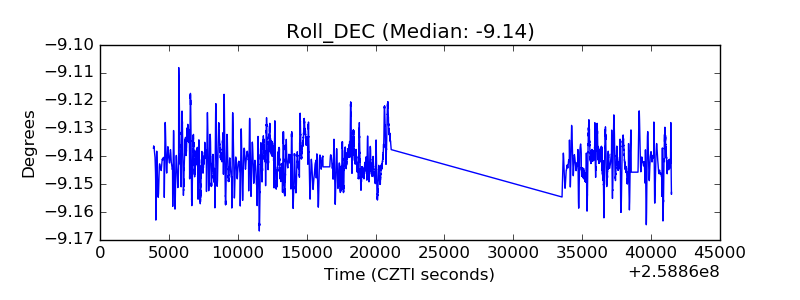 |
| _Roll_RA | 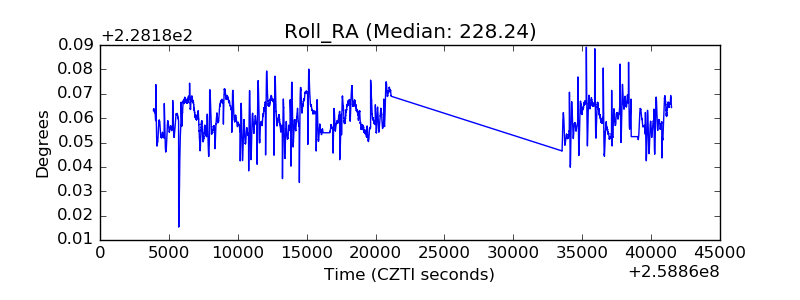 |
| Veto Counter | 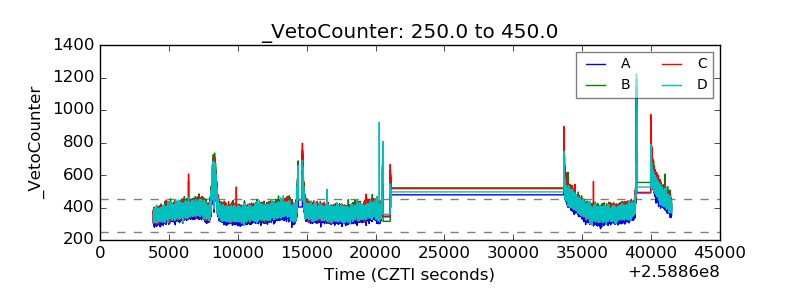 |