| Param | Original file | Final file |
|---|---|---|
| Filename | modeM0/AS1A04_101T01_9000001984_13328cztM0_level2.evt | modeM0/AS1A04_101T01_9000001984_13328cztM0_level2_quad_clean.evt |
| Size (bytes) | 475,741,440 | 66,283,200 |
| Size | 453.7 MB | 63.2 MB |
| Events in quadrant A | 3,342,168 | 389,821 |
| Events in quadrant B | 3,616,157 | 398,722 |
| Events in quadrant C | 3,251,093 | 389,444 |
| Events in quadrant D | 3,752,059 | 370,526 |
| Mode M9 | |||
|---|---|---|---|
| Quadrant | BADHDUFLAG | Total packets | Discarded packets |
| A | 0 | 20 | 0 |
| B | 0 | 20 | 0 |
| C | 0 | 20 | 0 |
| D | 0 | 21 | 0 |
| Mode SS | |||
|---|---|---|---|
| Quadrant | BADHDUFLAG | Total packets | Discarded packets |
| A | 0 | 134 | 0 |
| B | 0 | 134 | 0 |
| C | 0 | 134 | 0 |
| D | 0 | 134 | 0 |
| Mode M0 | |||
|---|---|---|---|
| Quadrant | BADHDUFLAG | Total packets | Discarded packets |
| A | 0 | 14177 | 3 |
| B | 0 | 14938 | 2 |
| C | 0 | 13903 | 2 |
| D | 0 | 15633 | 2 |
| Quadrant | Total seconds | Saturated seconds | Saturation percentage |
|---|---|---|---|
| A | 6570 | 65 | 0.989346% |
| B | 6570 | 120 | 1.826484% |
| C | 6570 | 44 | 0.669711% |
| D | 6570 | 94 | 1.430746% |
Noise dominated data is calculated using 1-second bins in cleaned event files. If a bin has >2000 counts, and if more than 50% of those come from <1% of pixels, then it is considered to be noise-dominated and hence unusable.
| Quadrant | # 1 sec bins | Bins with >0 counts | Bins with >2000 counts | High rate bins dominated by noise | Noise dominated (total time) | Noise dominated (detector-on time) | Marked lightcurve |
|---|---|---|---|---|---|---|---|
| A | 7751 | 6572 | 1 | 1 | 0.01% | 0.02% | 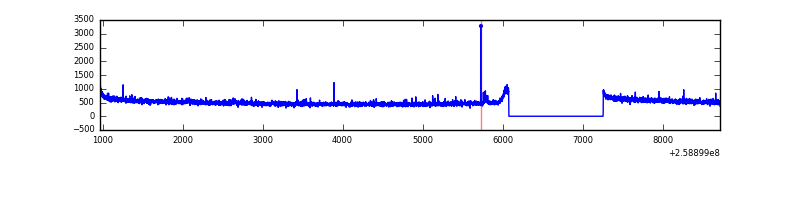 |
| B | 7751 | 6572 | 23 | 23 | 0.30% | 0.35% | 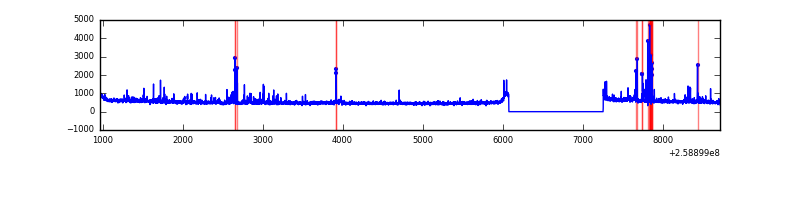 |
| C | 7751 | 6572 | 0 | 0 | 0.00% | 0.00% | 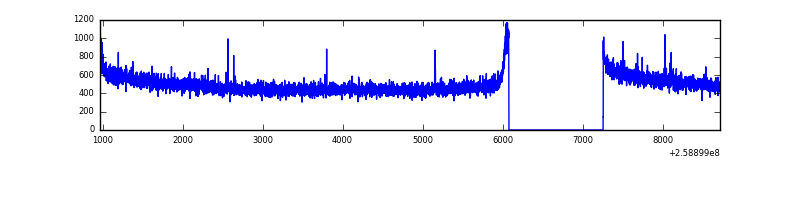 |
| D | 7751 | 6572 | 24 | 24 | 0.31% | 0.37% | 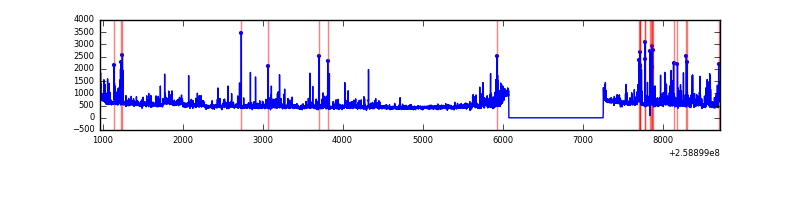 |
Top three noisy pixels from each quadrant. If the there are fewer than three noisy pixels in the level2.evt file, extra rows are filled as -1
| Pixel properties | Quadrant properties | ||||||
|---|---|---|---|---|---|---|---|
| Quadrant | DetID | PixID | Counts | Sigma | Mean | Median | Sigma |
| A | 1 | 162 | 19253 | 106.65 | 855 | 840 | 172.6 |
| A | 15 | 69 | 11957 | 64.39 | 855 | 840 | 172.6 |
| A | 0 | 226 | 7757 | 40.06 | 855 | 840 | 172.6 |
| B | 4 | 142 | 174818 | 1082.04 | 855 | 834 | 160.8 |
| B | 3 | 209 | 28427 | 171.61 | 855 | 834 | 160.8 |
| B | 4 | 216 | 26665 | 160.65 | 855 | 834 | 160.8 |
| C | 13 | 61 | 6095 | 27.32 | 831 | 837 | 192.5 |
| C | 15 | 208 | 5588 | 24.68 | 831 | 837 | 192.5 |
| C | 3 | 233 | 3886 | 15.84 | 831 | 837 | 192.5 |
| D | 1 | 52 | 254616 | 1281.78 | 825 | 802 | 198.0 |
| D | 5 | 222 | 147482 | 740.75 | 825 | 802 | 198.0 |
| D | 2 | 136 | 89588 | 448.38 | 825 | 802 | 198.0 |
Histogram calculated using DETX and DETY for each event in the final _common_clean file
| Quadrant A |  |
 |
Quadrant B |
|---|---|---|---|
| Quadrant D |  |
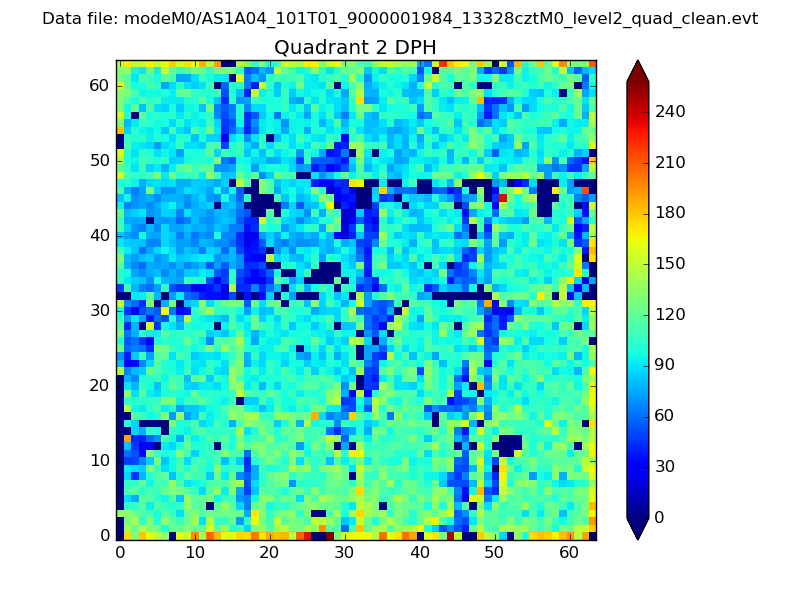 |
Quadrant C |
| Plot type | Count rate plots | Images |
|---|---|---|
| Comparison with Poisson distribution Blue bars denote a histogram of data divided into 1 sec bins. Red curve is a Poisson curve with rate = median count rate of data. |
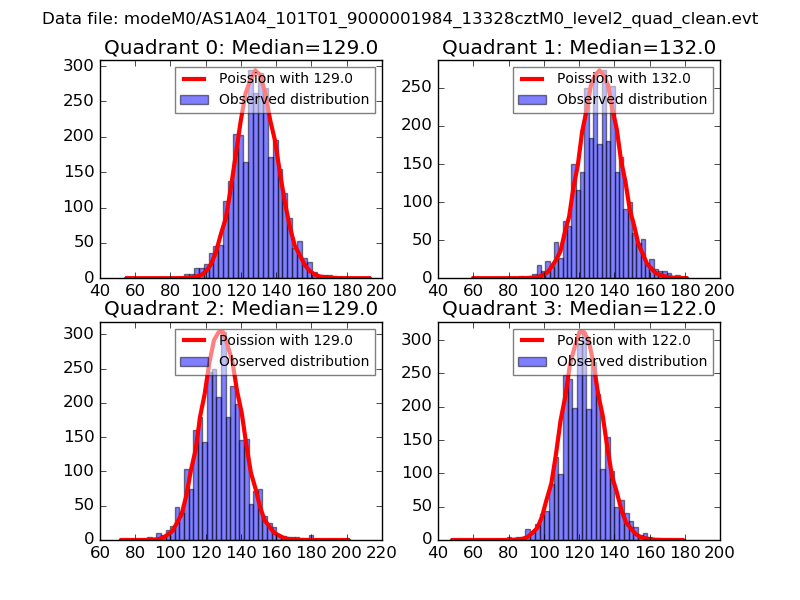 |
 |
| Quadrant-wise count rates Data is divided into 100 sec bins |
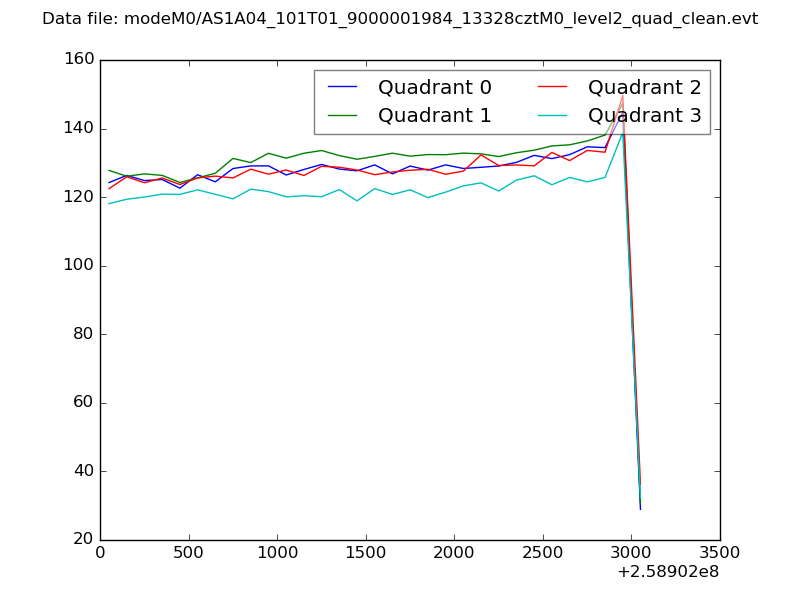 |
|
| Module-wise count rates for Quadrant A Data is divided into 100 sec bins |
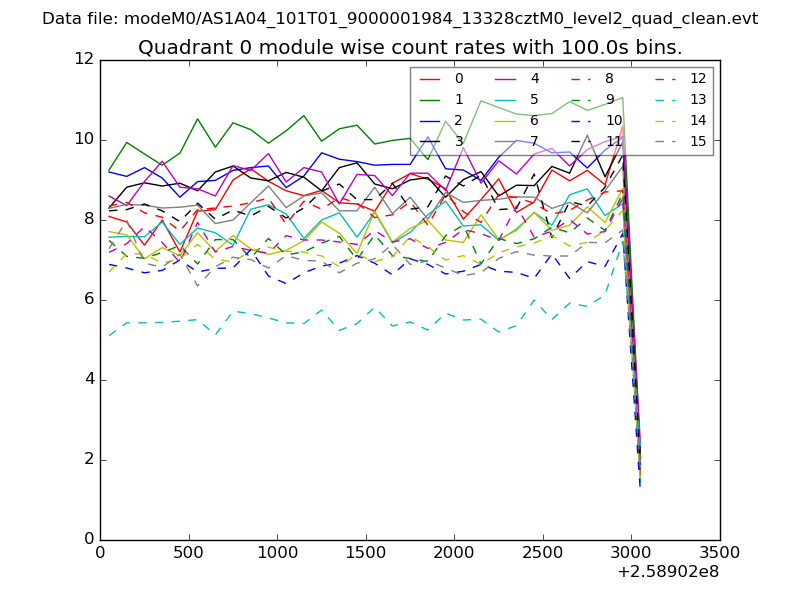 |
 |
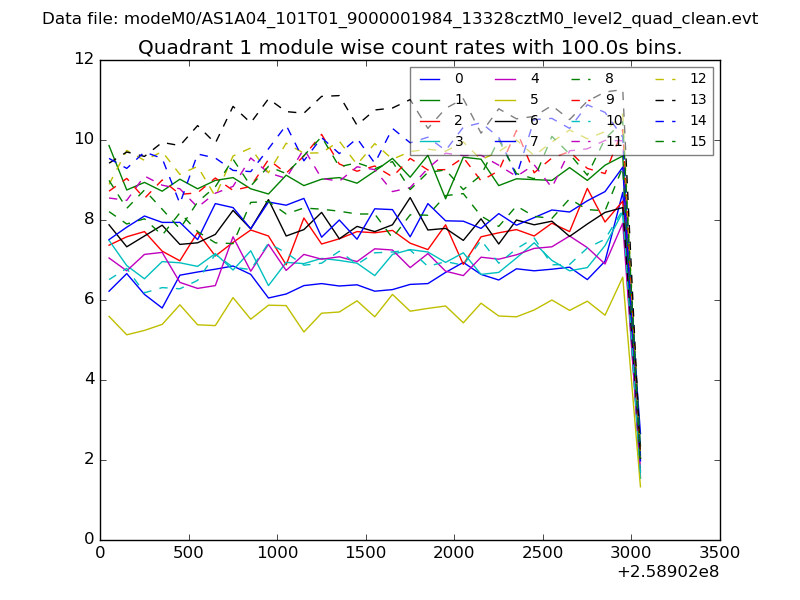
| Module-wise count rates for Quadrant B Data is divided into 100 sec bins |
 |
 |
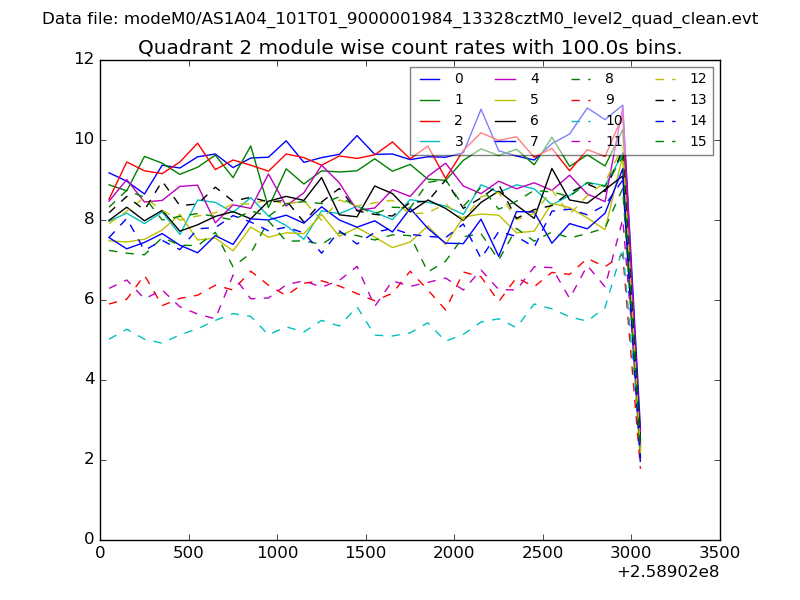
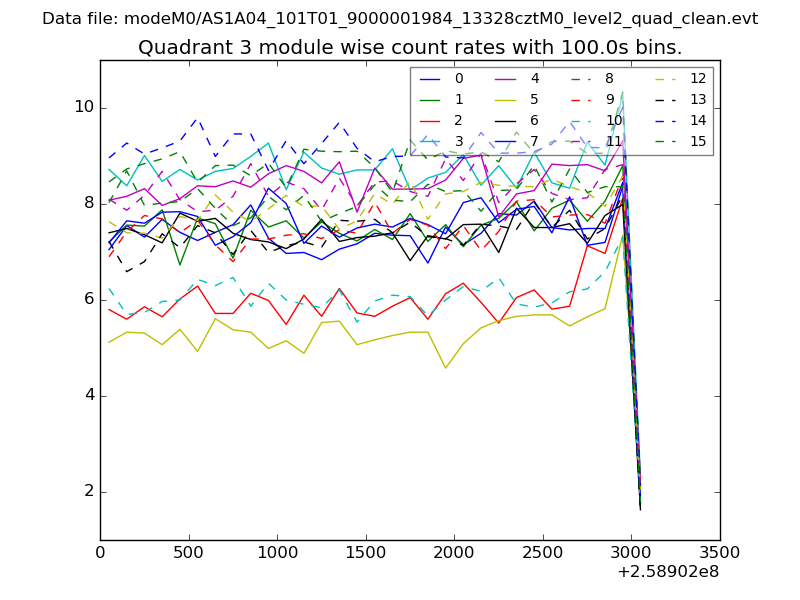
| Module-wise count rates for Quadrant C Data is divided into 100 sec bins |
 |
 |
| Module-wise count rates for Quadrant D Data is divided into 100 sec bins |
 |
 |
| Parameter | Plot |
|---|---|
| CZT HV Monitor | 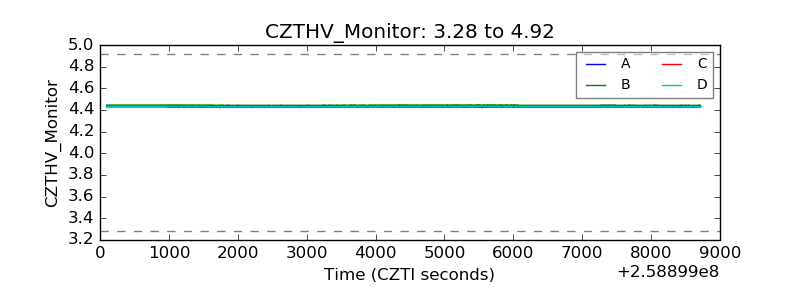 |
| D_VDD | 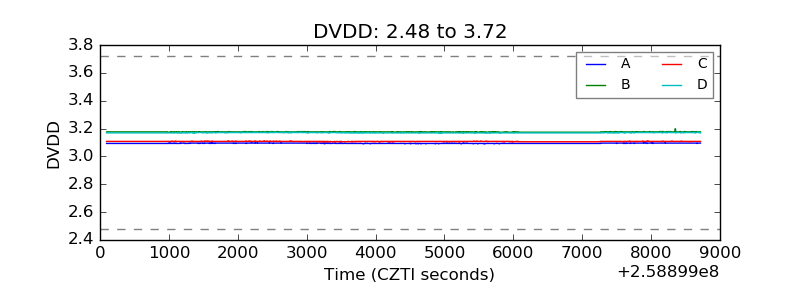 |
| Temperature 1 | 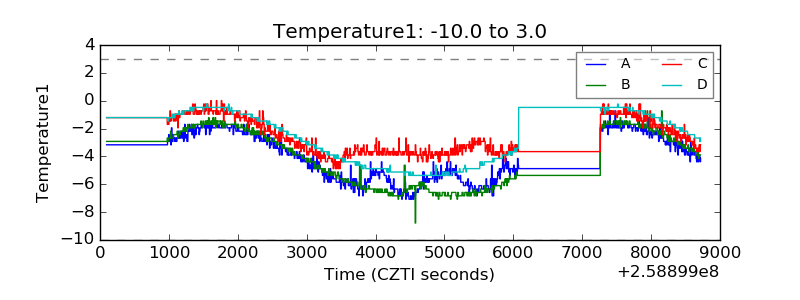 |
| Veto HV Monitor | 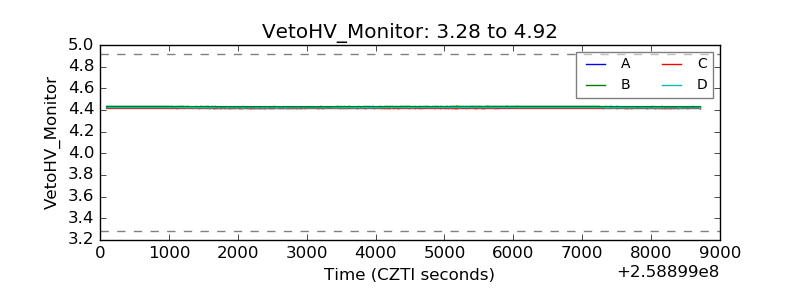 |
| Veto LLD | 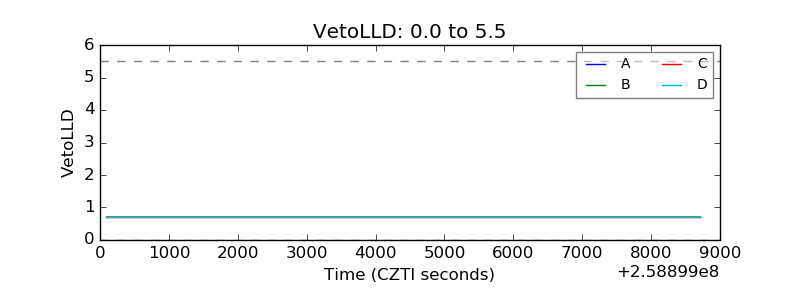 |
| Alpha Counter | 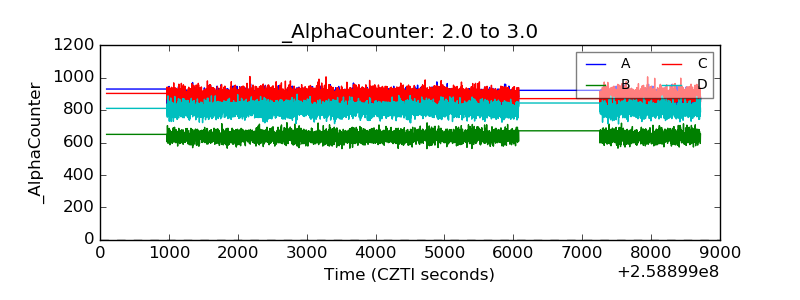 |
| _CPM_Rate | 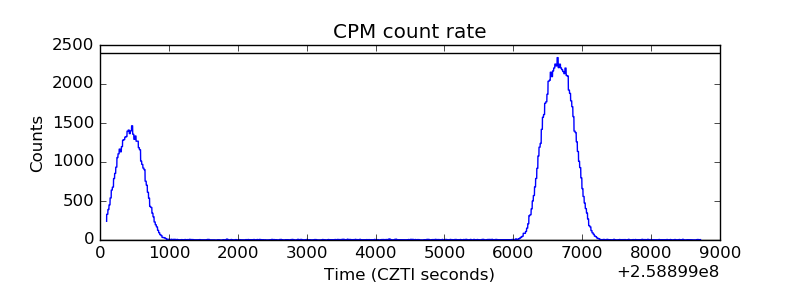 |
| CZT Counter | 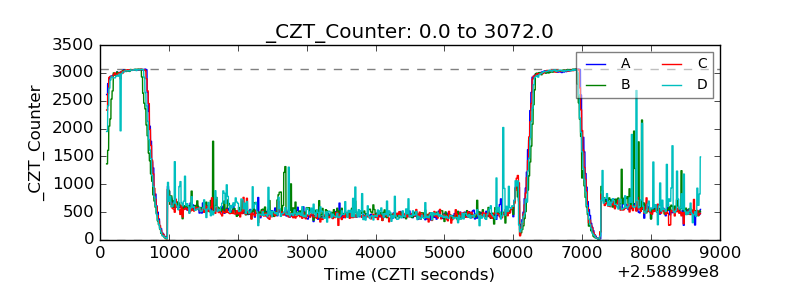 |
| +2.5 Volts monitor |  |
| +5 Volts monitor |  |
| _ROLL_ROT | 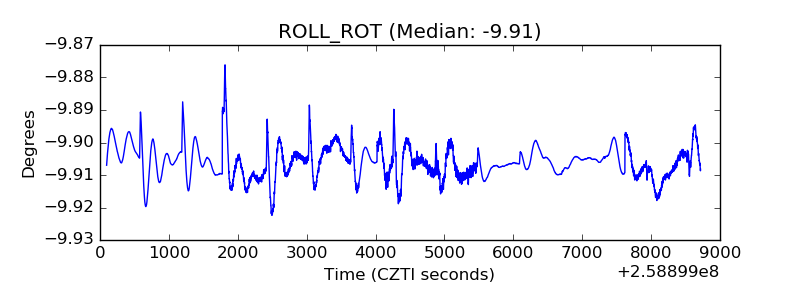 |
| _Roll_DEC | 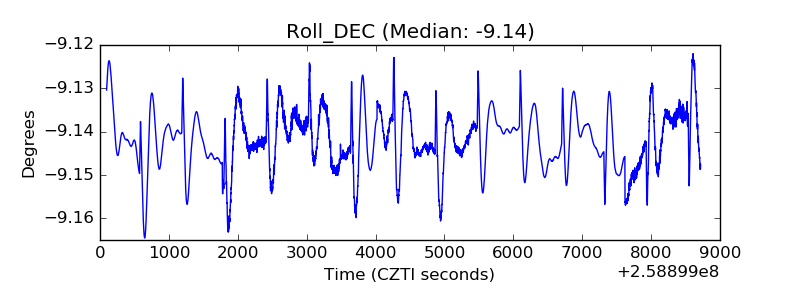 |
| _Roll_RA | 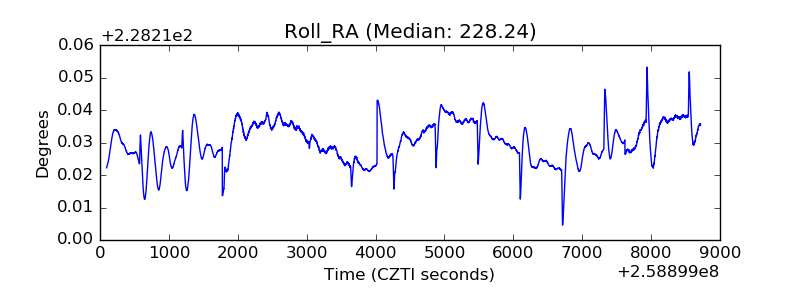 |
| Veto Counter | 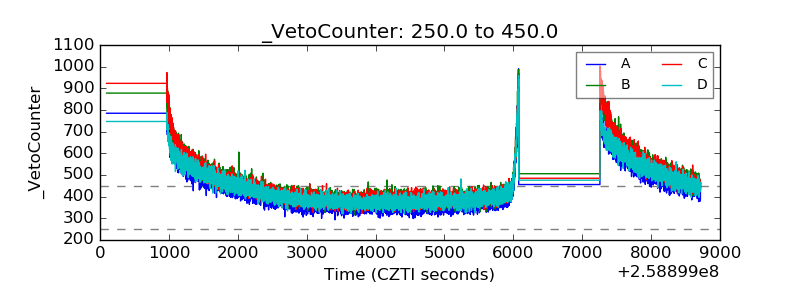 |