| Param | Original file | Final file |
|---|---|---|
| Filename | modeM0/AS1A04_101T01_9000001984_13332cztM0_level2.evt | modeM0/AS1A04_101T01_9000001984_13332cztM0_level2_quad_clean.evt |
| Size (bytes) | 477,777,600 | 102,438,720 |
| Size | 455.6 MB | 97.7 MB |
| Events in quadrant A | 3,605,903 | 659,420 |
| Events in quadrant B | 3,612,122 | 685,017 |
| Events in quadrant C | 3,403,575 | 661,361 |
| Events in quadrant D | 3,388,059 | 624,677 |
| Mode M9 | |||
|---|---|---|---|
| Quadrant | BADHDUFLAG | Total packets | Discarded packets |
| A | 0 | 27 | 0 |
| B | 0 | 27 | 0 |
| C | 0 | 27 | 0 |
| D | 0 | 27 | 0 |
| Mode SS | |||
|---|---|---|---|
| Quadrant | BADHDUFLAG | Total packets | Discarded packets |
| A | 0 | 138 | 0 |
| B | 0 | 138 | 0 |
| C | 0 | 138 | 0 |
| D | 0 | 138 | 0 |
| Mode M0 | |||
|---|---|---|---|
| Quadrant | BADHDUFLAG | Total packets | Discarded packets |
| A | 0 | 15071 | 3 |
| B | 0 | 15017 | 2 |
| C | 0 | 14343 | 2 |
| D | 0 | 14668 | 2 |
| Quadrant | Total seconds | Saturated seconds | Saturation percentage |
|---|---|---|---|
| A | 6776 | 112 | 1.652893% |
| B | 6776 | 121 | 1.785714% |
| C | 6776 | 35 | 0.516529% |
| D | 6776 | 35 | 0.516529% |
Noise dominated data is calculated using 1-second bins in cleaned event files. If a bin has >2000 counts, and if more than 50% of those come from <1% of pixels, then it is considered to be noise-dominated and hence unusable.
| Quadrant | # 1 sec bins | Bins with >0 counts | Bins with >2000 counts | High rate bins dominated by noise | Noise dominated (total time) | Noise dominated (detector-on time) | Marked lightcurve |
|---|---|---|---|---|---|---|---|
| A | 9432 | 6779 | 14 | 14 | 0.15% | 0.21% | 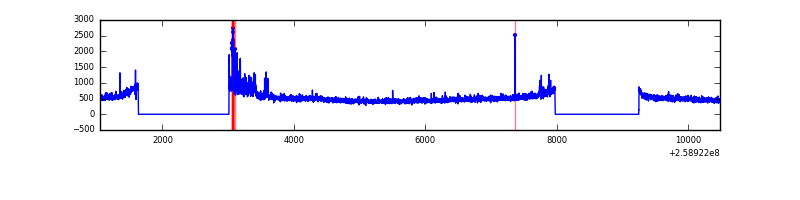 |
| B | 9432 | 6779 | 17 | 17 | 0.18% | 0.25% |  |
| C | 9432 | 6779 | 0 | 0 | 0.00% | 0.00% | 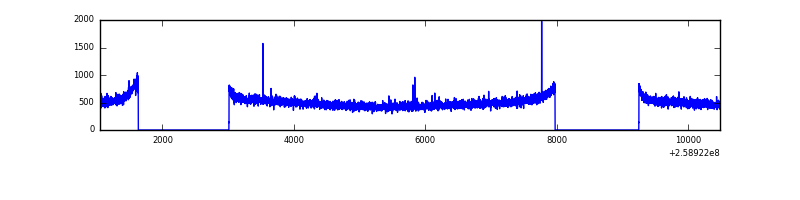 |
| D | 9432 | 6779 | 8 | 8 | 0.08% | 0.12% | 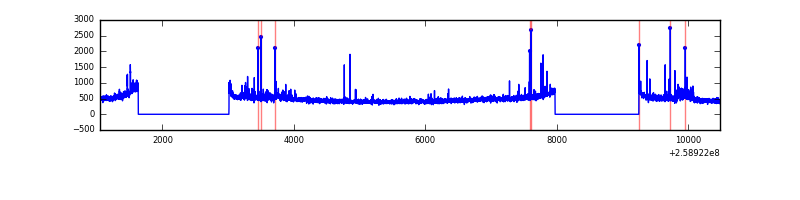 |
Top three noisy pixels from each quadrant. If the there are fewer than three noisy pixels in the level2.evt file, extra rows are filled as -1
| Pixel properties | Quadrant properties | ||||||
|---|---|---|---|---|---|---|---|
| Quadrant | DetID | PixID | Counts | Sigma | Mean | Median | Sigma |
| A | 8 | 15 | 217508 | 1219.27 | 872 | 855 | 177.7 |
| A | 1 | 162 | 20677 | 111.55 | 872 | 855 | 177.7 |
| A | 0 | 226 | 7856 | 39.4 | 872 | 855 | 177.7 |
| B | 4 | 173 | 46234 | 268.18 | 885 | 864 | 169.2 |
| B | 3 | 64 | 31521 | 181.21 | 885 | 864 | 169.2 |
| B | 3 | 209 | 31283 | 179.8 | 885 | 864 | 169.2 |
| C | 3 | 233 | 65175 | 327.05 | 855 | 861 | 196.6 |
| C | 15 | 208 | 6593 | 29.15 | 855 | 861 | 196.6 |
| C | 13 | 61 | 6225 | 27.28 | 855 | 861 | 196.6 |
| D | 8 | 195 | 76497 | 371.26 | 842 | 820 | 203.8 |
| D | 1 | 52 | 65808 | 318.82 | 842 | 820 | 203.8 |
| D | 14 | 34 | 28342 | 135.02 | 842 | 820 | 203.8 |
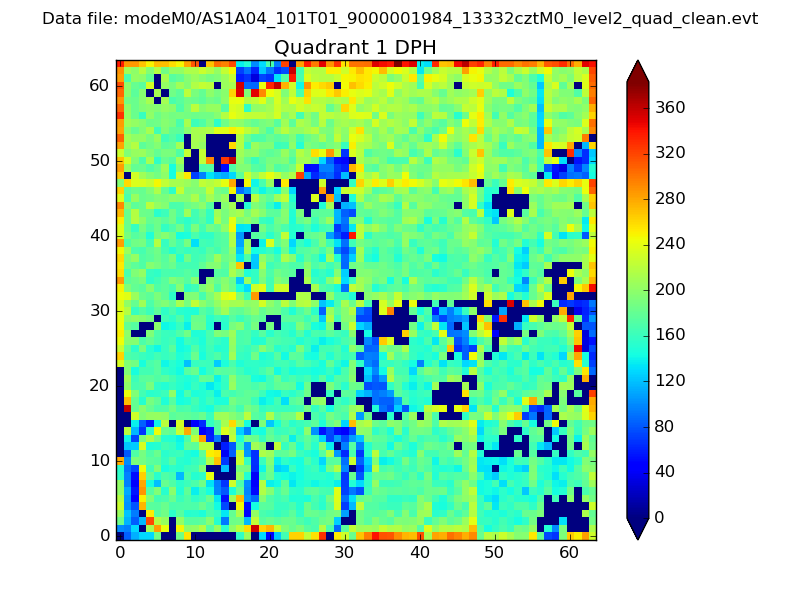
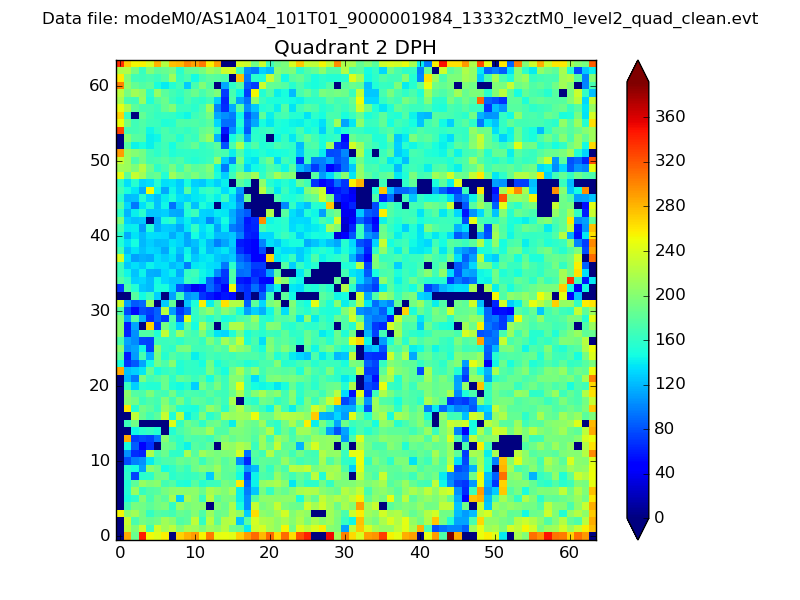
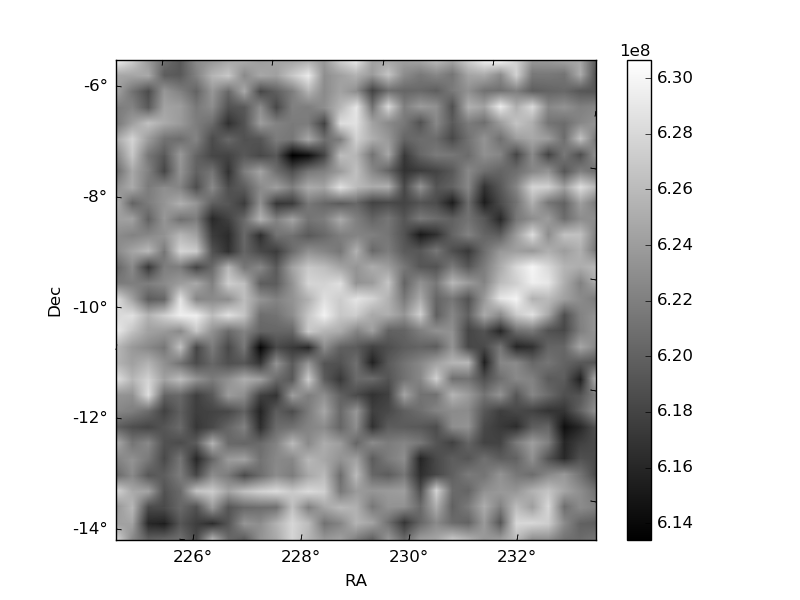
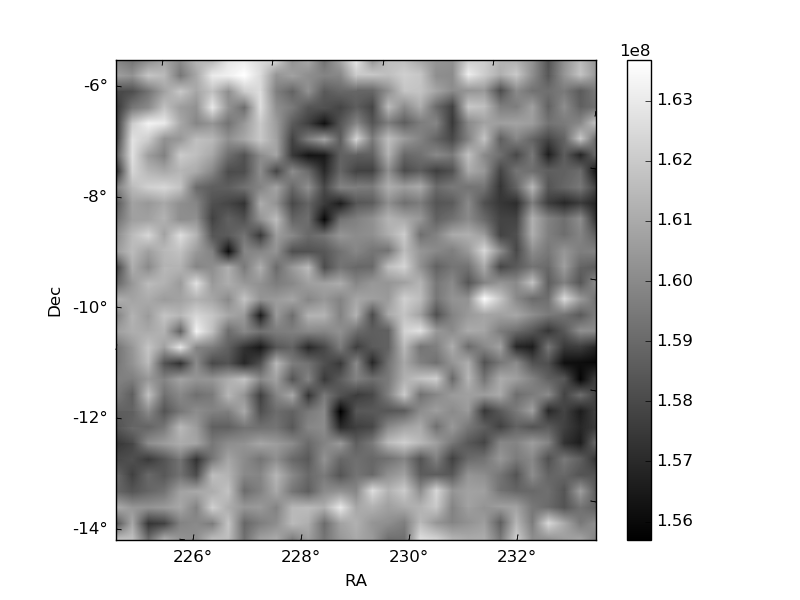
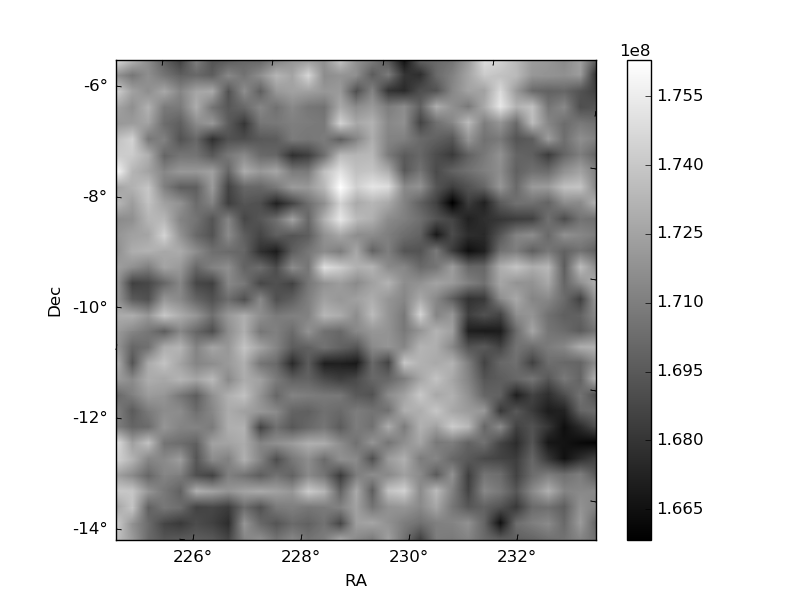
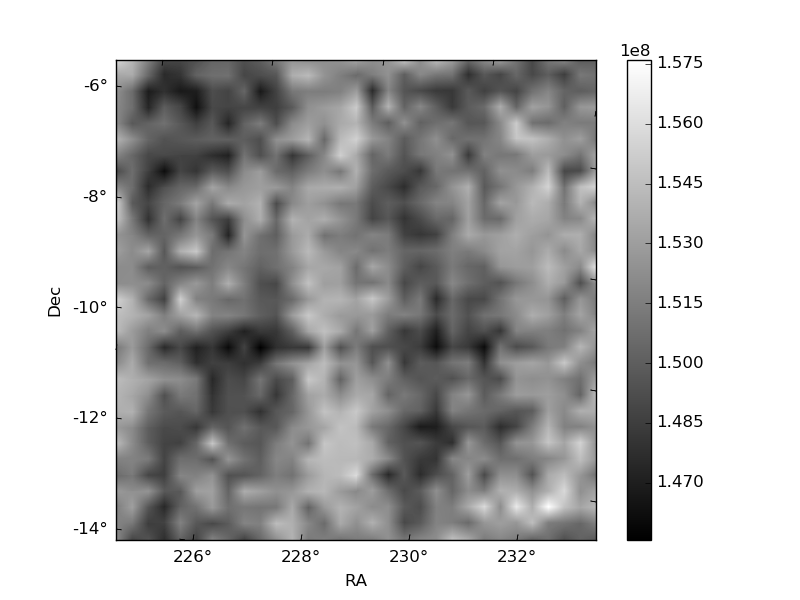
Histogram calculated using DETX and DETY for each event in the final _common_clean file
| Quadrant A | 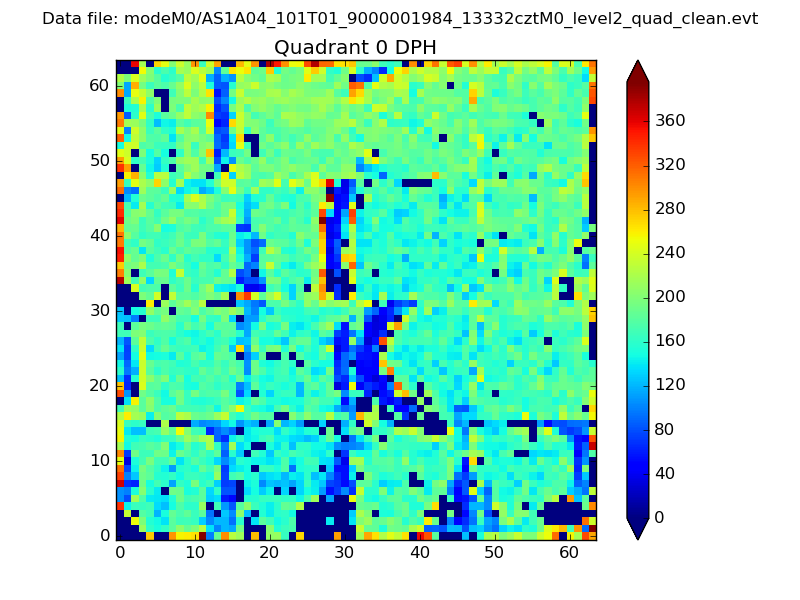 |
 |
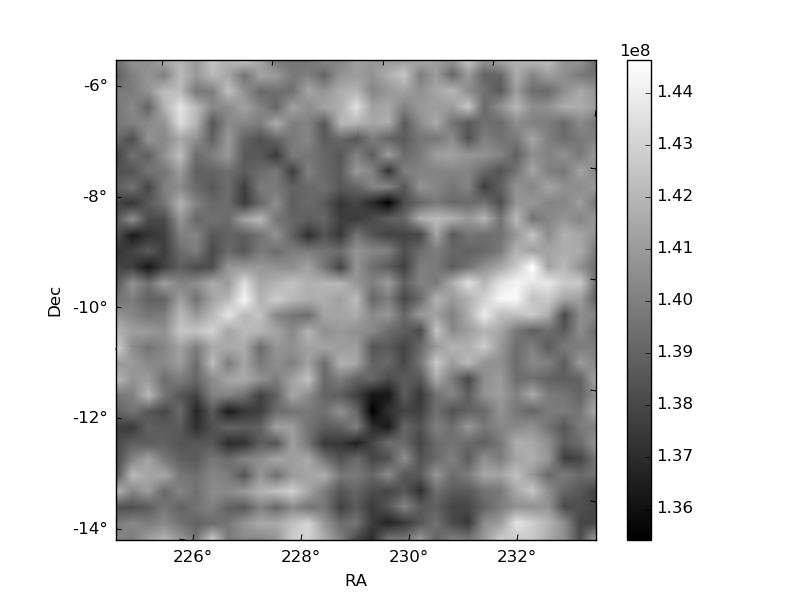
Quadrant B |
|---|---|---|---|
| Quadrant D | 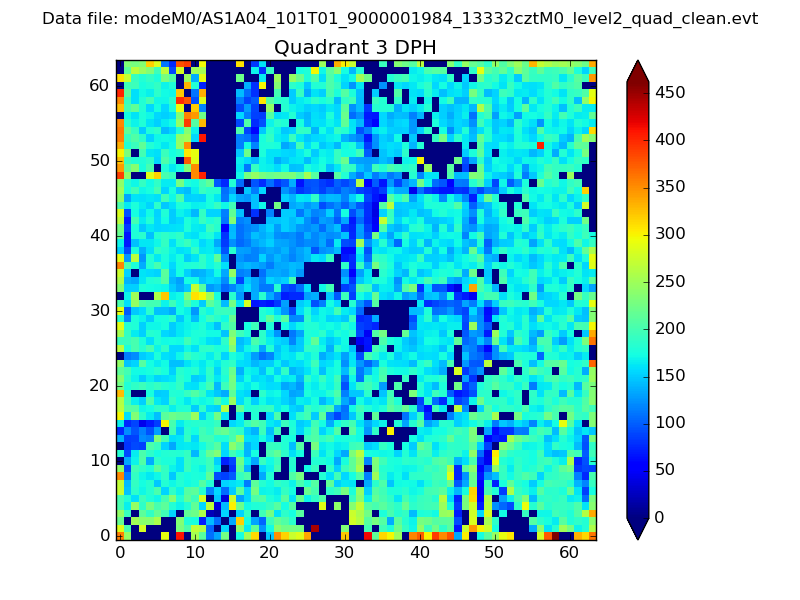 |
 |
Quadrant C |
| Plot type | Count rate plots | Images |
|---|---|---|
| Comparison with Poisson distribution Blue bars denote a histogram of data divided into 1 sec bins. Red curve is a Poisson curve with rate = median count rate of data. |
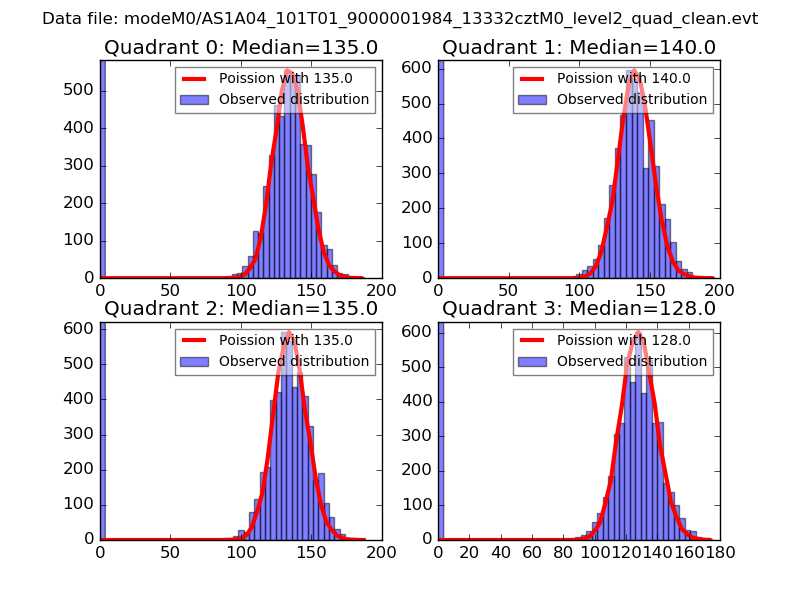 |
 |
| Quadrant-wise count rates Data is divided into 100 sec bins |
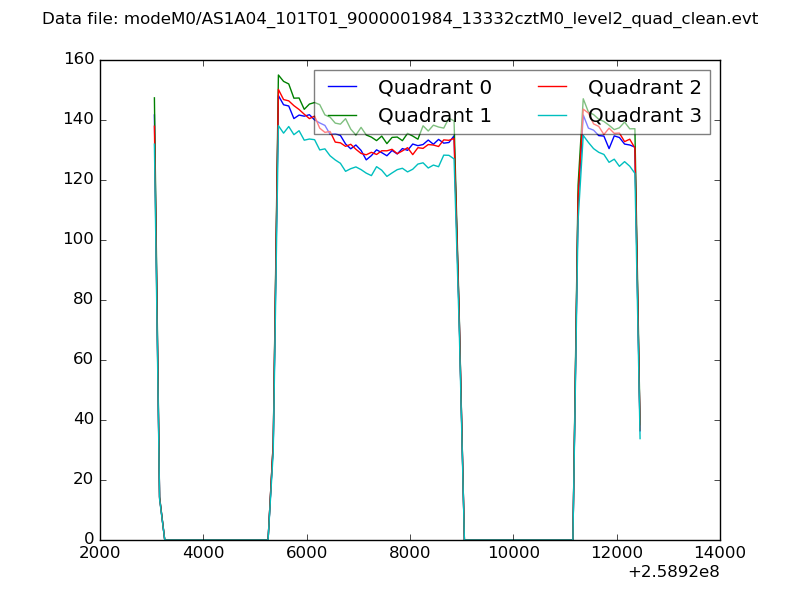 |
|
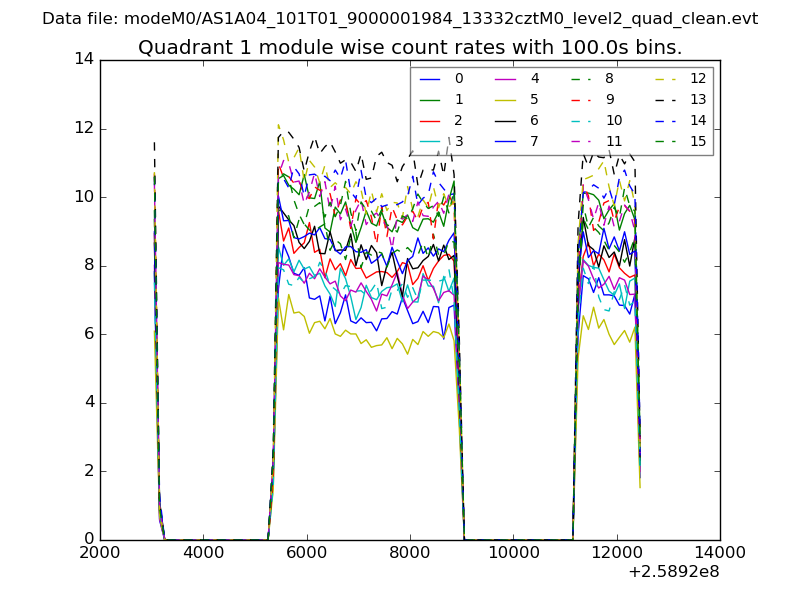
| Module-wise count rates for Quadrant A Data is divided into 100 sec bins |
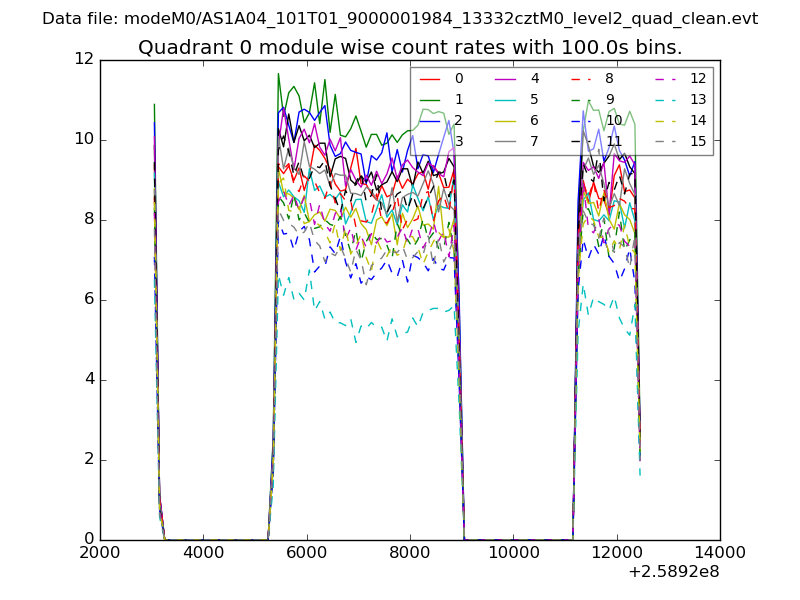 |
 |
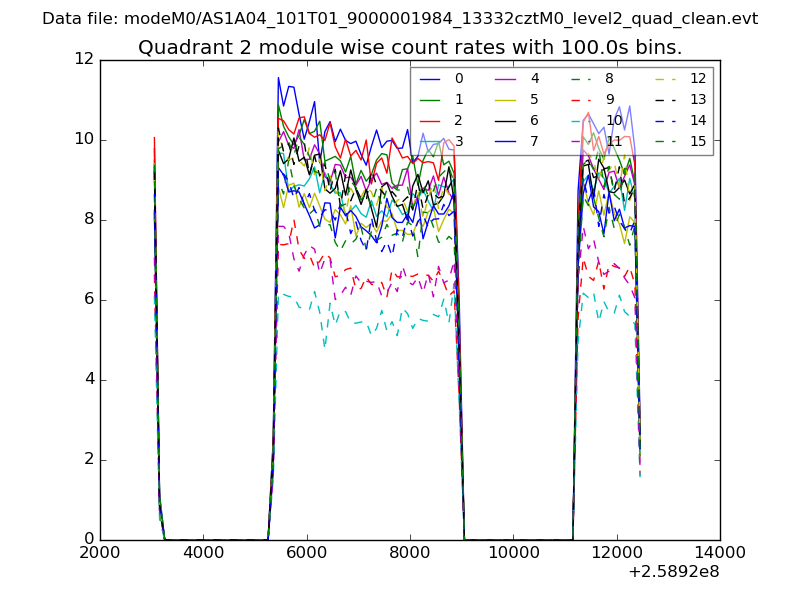
| Module-wise count rates for Quadrant B Data is divided into 100 sec bins |
 |
 |
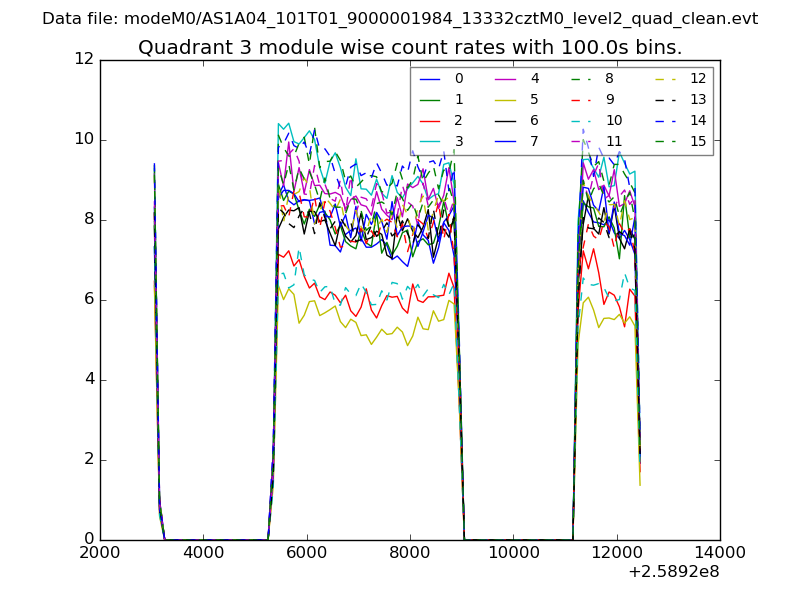
| Module-wise count rates for Quadrant C Data is divided into 100 sec bins |
 |
 |
| Module-wise count rates for Quadrant D Data is divided into 100 sec bins |
 |
 |
| Parameter | Plot |
|---|---|
| CZT HV Monitor | 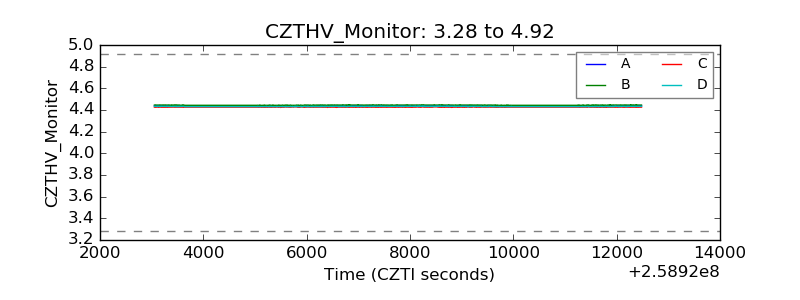 |
| D_VDD | 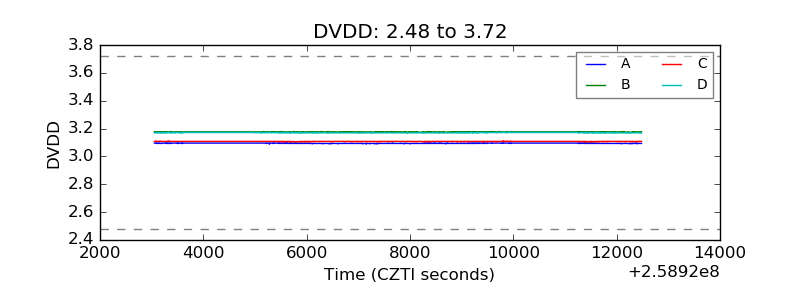 |
| Temperature 1 | 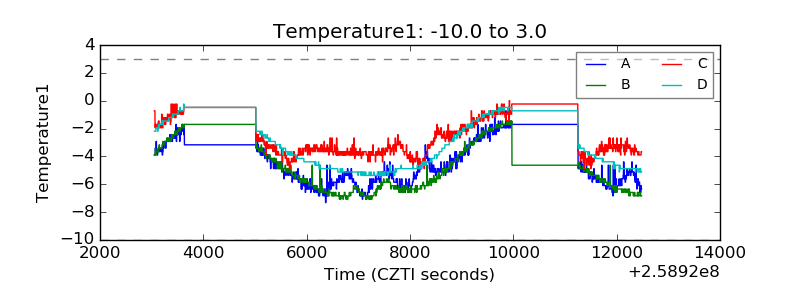 |
| Veto HV Monitor | 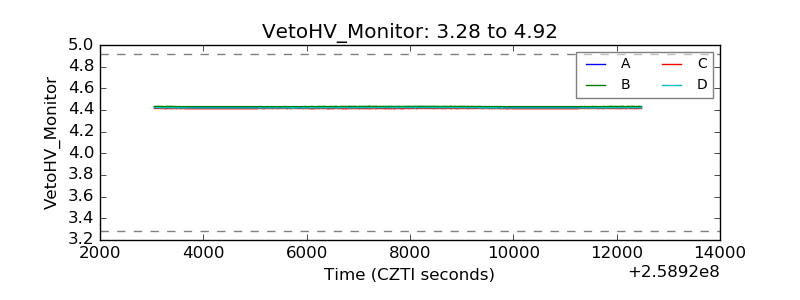 |
| Veto LLD | 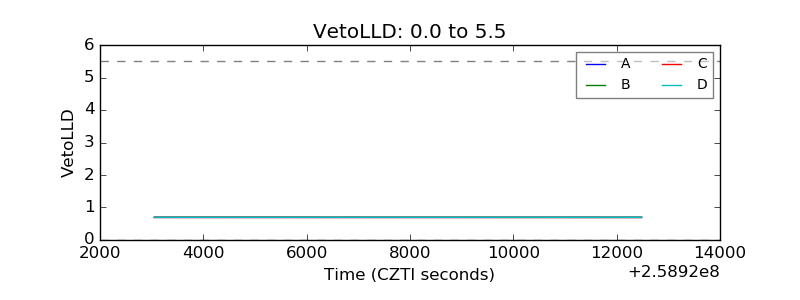 |
| Alpha Counter | 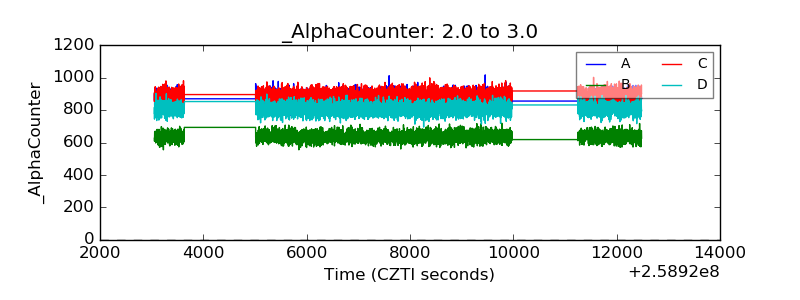 |
| _CPM_Rate | 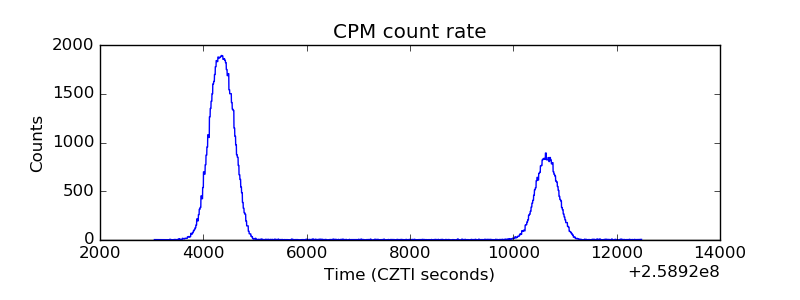 |
| CZT Counter | 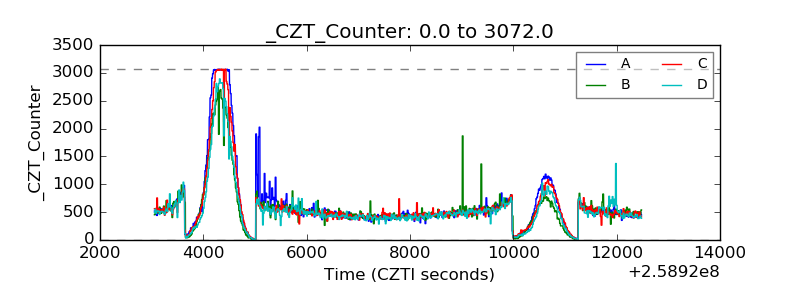 |
| +2.5 Volts monitor |  |
| +5 Volts monitor |  |
| _ROLL_ROT | 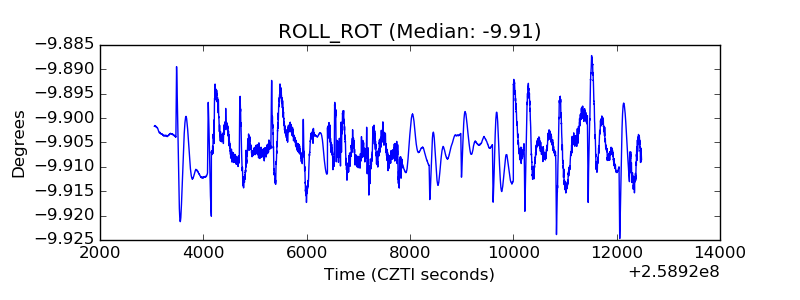 |
| _Roll_DEC | 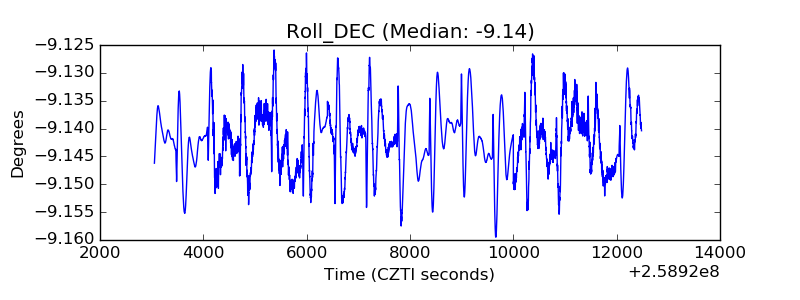 |
| _Roll_RA | 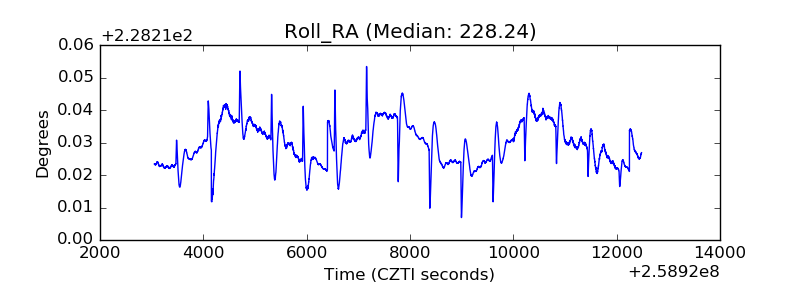 |
| Veto Counter | 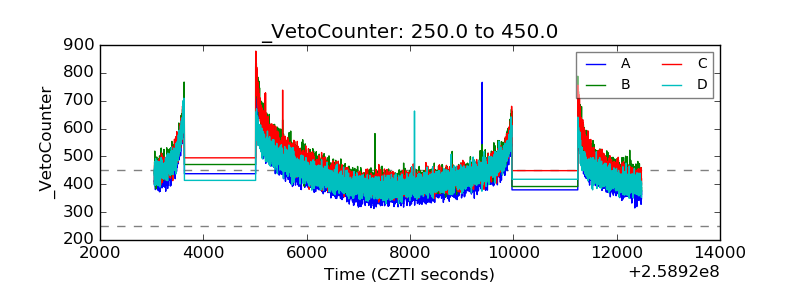 |