| Param | Original file | Final file |
|---|---|---|
| Filename | modeM0/AS1A04_101T01_9000001984_13333cztM0_level2.evt | modeM0/AS1A04_101T01_9000001984_13333cztM0_level2_quad_clean.evt |
| Size (bytes) | 443,891,520 | 96,814,080 |
| Size | 423.3 MB | 92.3 MB |
| Events in quadrant A | 3,130,115 | 621,007 |
| Events in quadrant B | 3,354,898 | 644,691 |
| Events in quadrant C | 3,442,533 | 619,670 |
| Events in quadrant D | 3,071,190 | 590,463 |
| Mode M9 | |||
|---|---|---|---|
| Quadrant | BADHDUFLAG | Total packets | Discarded packets |
| A | 0 | 13 | 0 |
| B | 0 | 13 | 0 |
| C | 0 | 13 | 0 |
| D | 0 | 14 | 0 |
| Mode SS | |||
|---|---|---|---|
| Quadrant | BADHDUFLAG | Total packets | Discarded packets |
| A | 0 | 134 | 0 |
| B | 0 | 134 | 0 |
| C | 0 | 134 | 0 |
| D | 0 | 134 | 0 |
| Mode M0 | |||
|---|---|---|---|
| Quadrant | BADHDUFLAG | Total packets | Discarded packets |
| A | 0 | 13574 | 3 |
| B | 0 | 14172 | 2 |
| C | 0 | 14342 | 2 |
| D | 0 | 13721 | 2 |
| Quadrant | Total seconds | Saturated seconds | Saturation percentage |
|---|---|---|---|
| A | 6537 | 44 | 0.673092% |
| B | 6537 | 108 | 1.652134% |
| C | 6537 | 79 | 1.208505% |
| D | 6537 | 19 | 0.290653% |
Noise dominated data is calculated using 1-second bins in cleaned event files. If a bin has >2000 counts, and if more than 50% of those come from <1% of pixels, then it is considered to be noise-dominated and hence unusable.
| Quadrant | # 1 sec bins | Bins with >0 counts | Bins with >2000 counts | High rate bins dominated by noise | Noise dominated (total time) | Noise dominated (detector-on time) | Marked lightcurve |
|---|---|---|---|---|---|---|---|
| A | 7458 | 6539 | 3 | 3 | 0.04% | 0.05% | 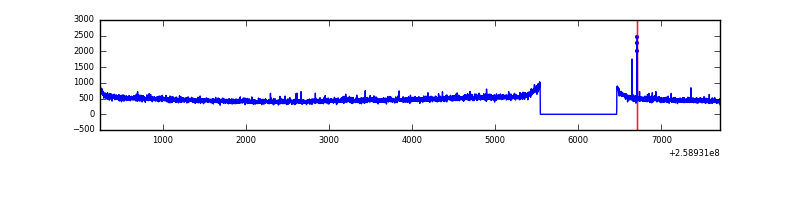 |
| B | 7458 | 6539 | 22 | 22 | 0.29% | 0.34% | 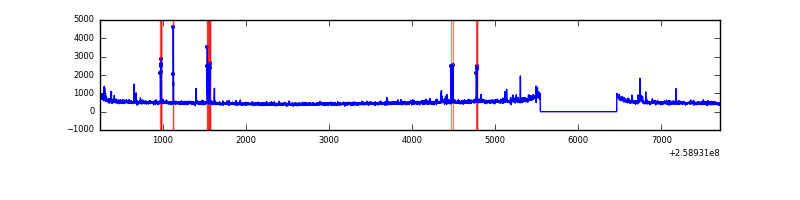 |
| C | 7458 | 6539 | 55 | 55 | 0.74% | 0.84% | 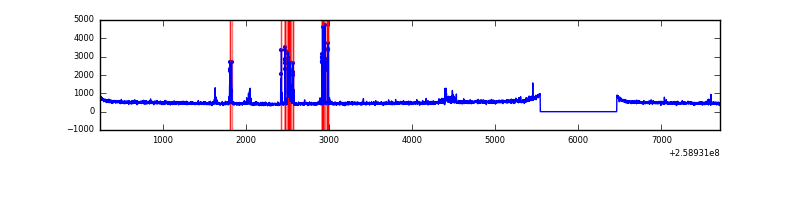 |
| D | 7458 | 6539 | 4 | 4 | 0.05% | 0.06% | 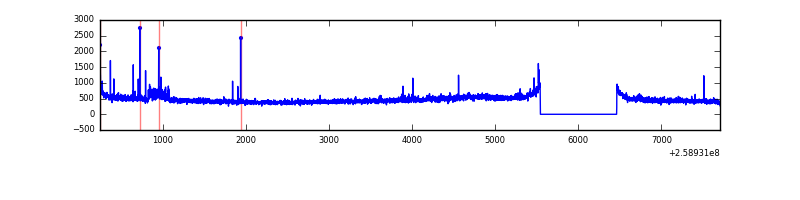 |
Top three noisy pixels from each quadrant. If the there are fewer than three noisy pixels in the level2.evt file, extra rows are filled as -1
| Pixel properties | Quadrant properties | ||||||
|---|---|---|---|---|---|---|---|
| Quadrant | DetID | PixID | Counts | Sigma | Mean | Median | Sigma |
| A | 1 | 162 | 15270 | 87.7 | 804 | 788 | 165.1 |
| A | 9 | 143 | 11608 | 65.52 | 804 | 788 | 165.1 |
| A | 0 | 226 | 7175 | 38.68 | 804 | 788 | 165.1 |
| B | 3 | 64 | 79851 | 502.49 | 815 | 793 | 157.3 |
| B | 10 | 245 | 37637 | 234.18 | 815 | 793 | 157.3 |
| B | 3 | 209 | 21404 | 131.0 | 815 | 793 | 157.3 |
| C | 15 | 208 | 253834 | 1390.8 | 784 | 788 | 181.9 |
| C | 3 | 233 | 102318 | 558.03 | 784 | 788 | 181.9 |
| C | 6 | 96 | 30636 | 164.05 | 784 | 788 | 181.9 |
| D | 1 | 52 | 52621 | 276.69 | 775 | 755 | 187.5 |
| D | 8 | 195 | 36942 | 193.05 | 775 | 755 | 187.5 |
| D | 2 | 234 | 21350 | 109.87 | 775 | 755 | 187.5 |
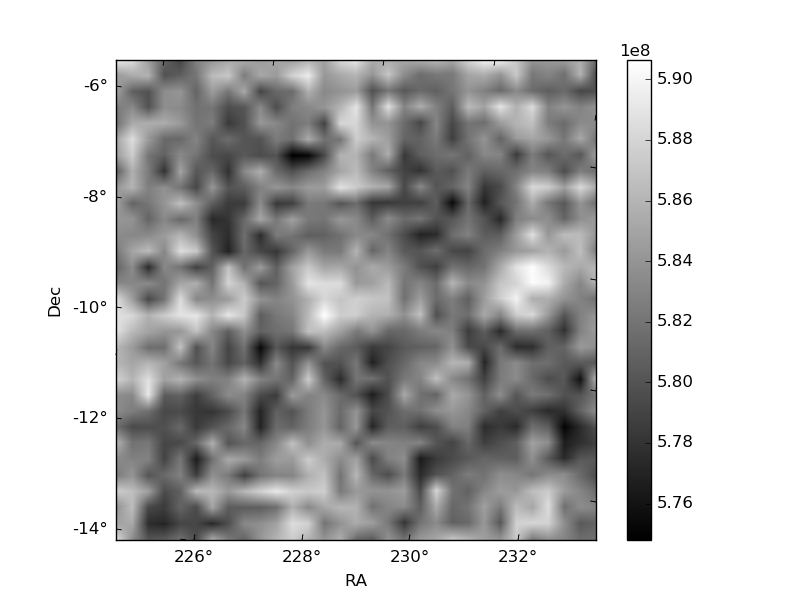
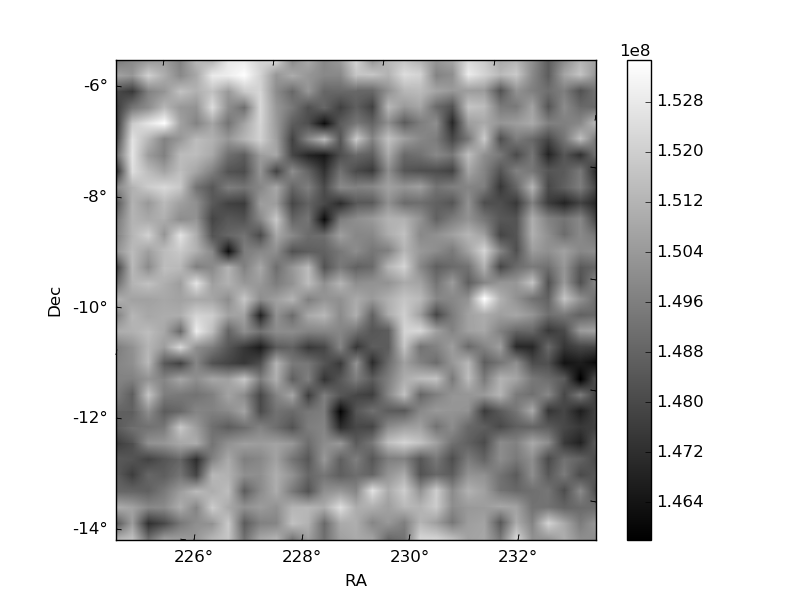
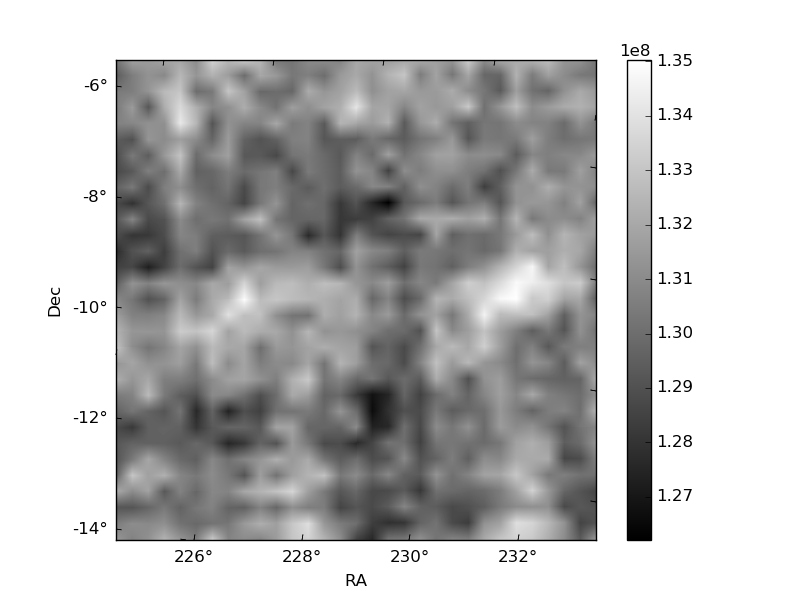
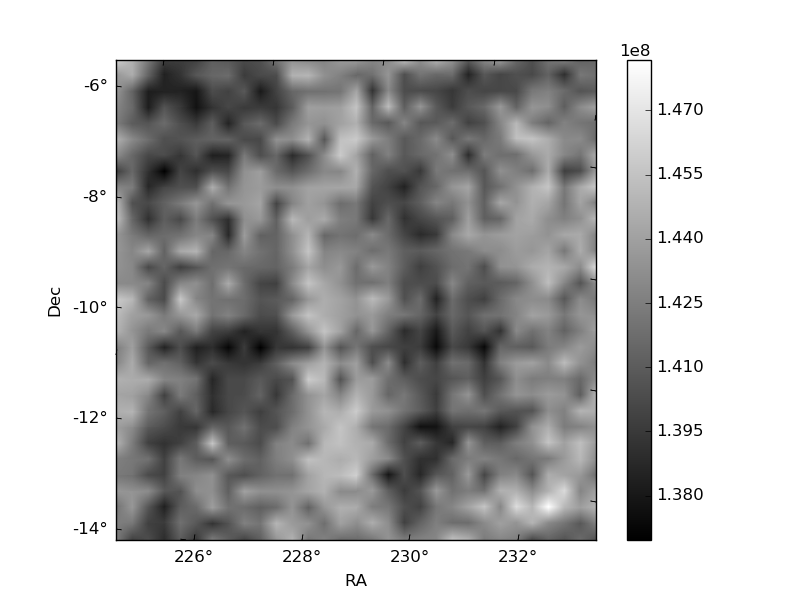
Histogram calculated using DETX and DETY for each event in the final _common_clean file
| Quadrant A | 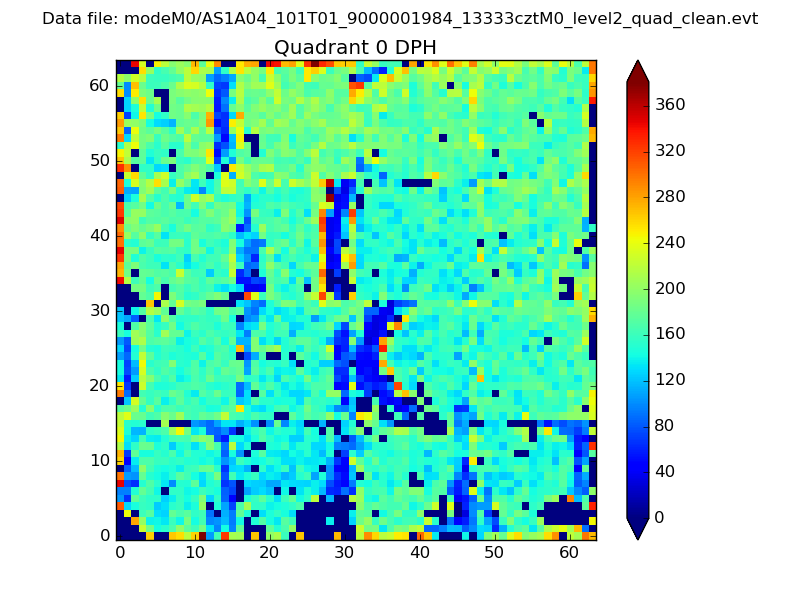 |
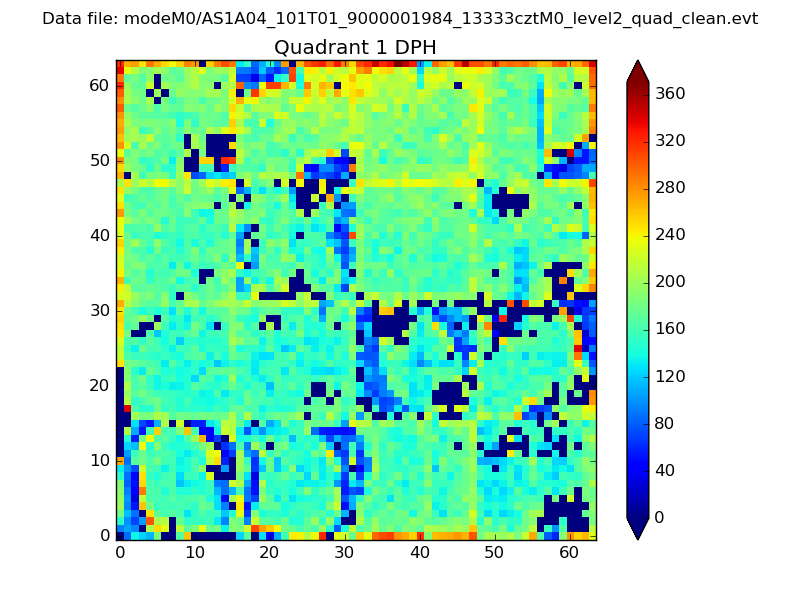 |
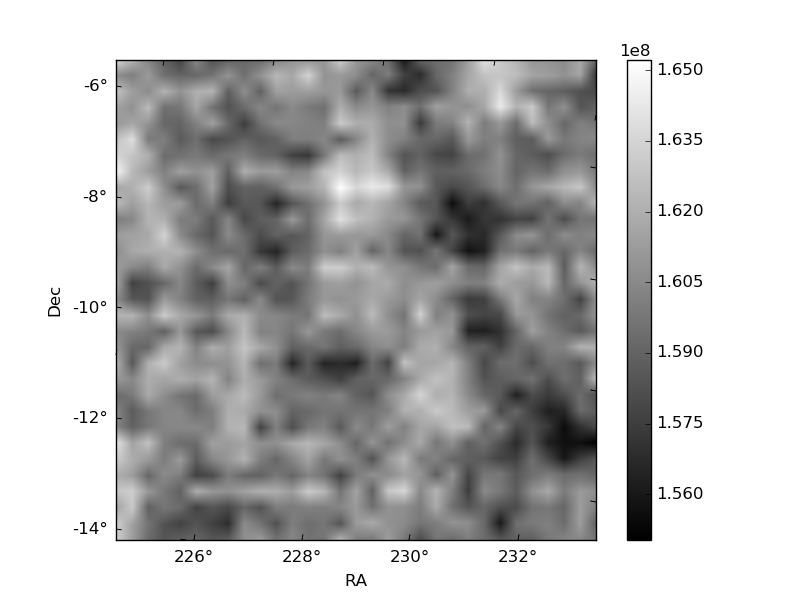
Quadrant B |
|---|---|---|---|
| Quadrant D | 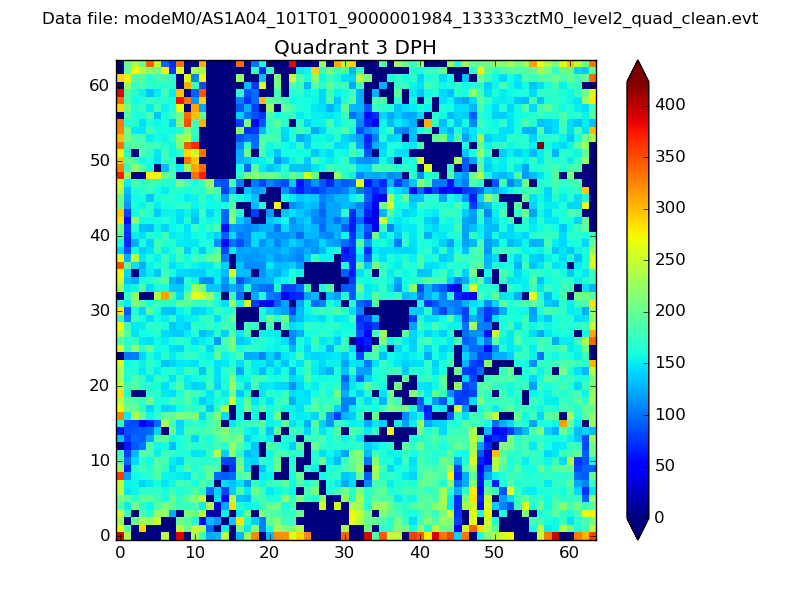 |
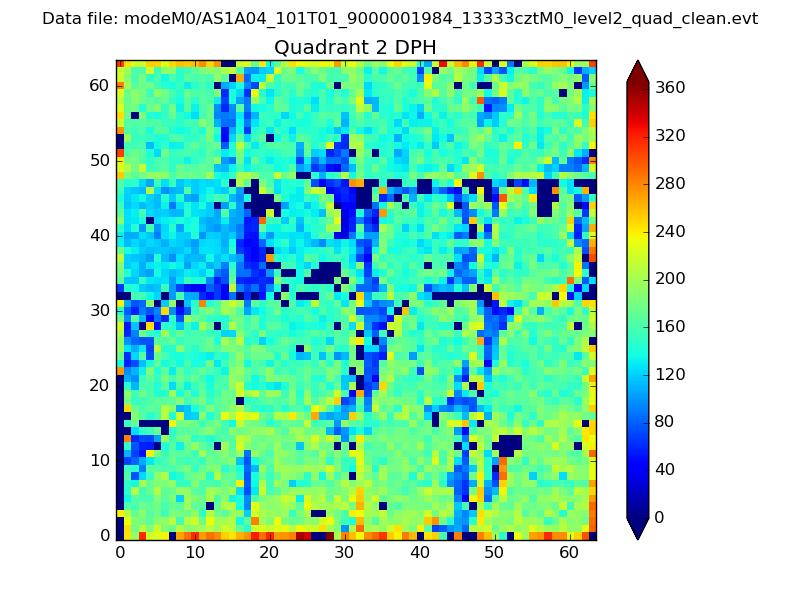 |
Quadrant C |
| Plot type | Count rate plots | Images |
|---|---|---|
| Comparison with Poisson distribution Blue bars denote a histogram of data divided into 1 sec bins. Red curve is a Poisson curve with rate = median count rate of data. |
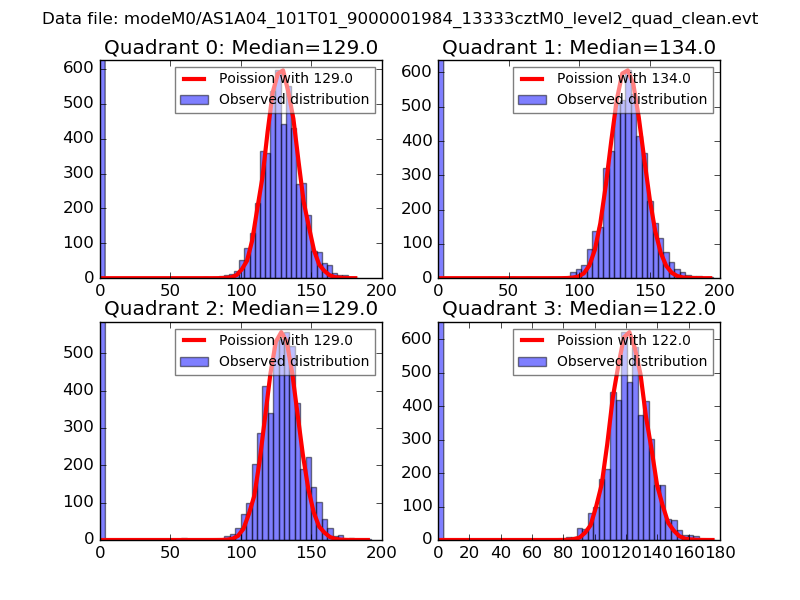 |
 |
| Quadrant-wise count rates Data is divided into 100 sec bins |
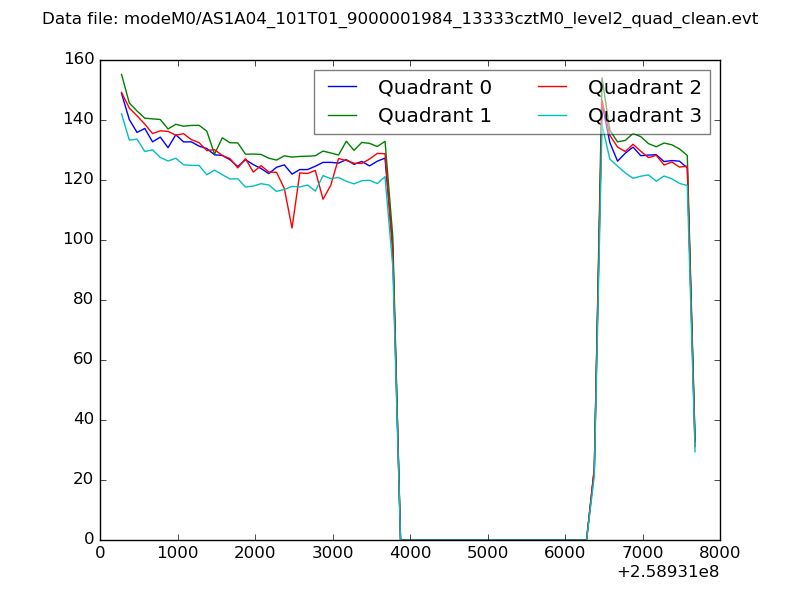 |
|
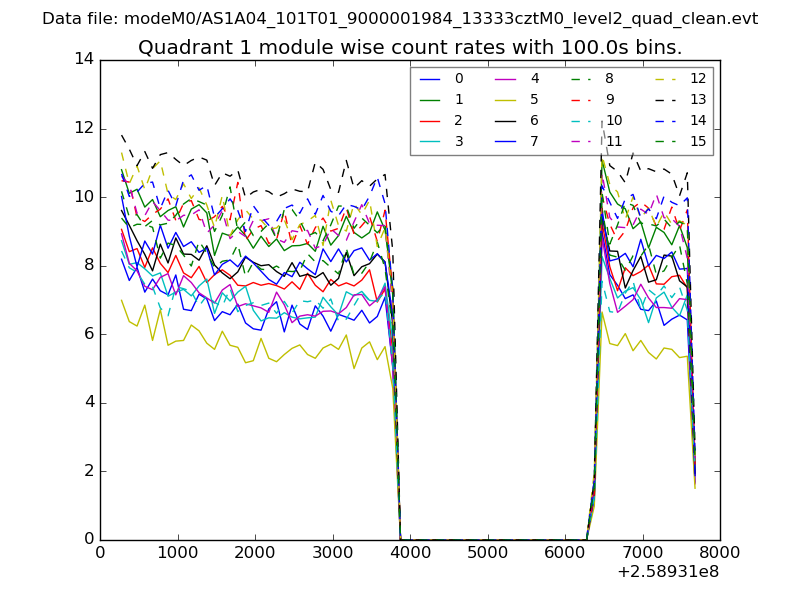
| Module-wise count rates for Quadrant A Data is divided into 100 sec bins |
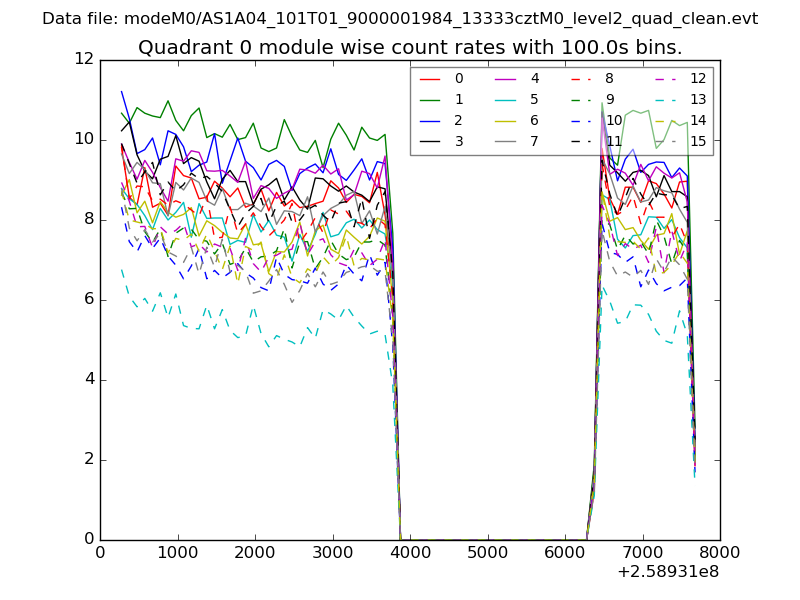 |
 |
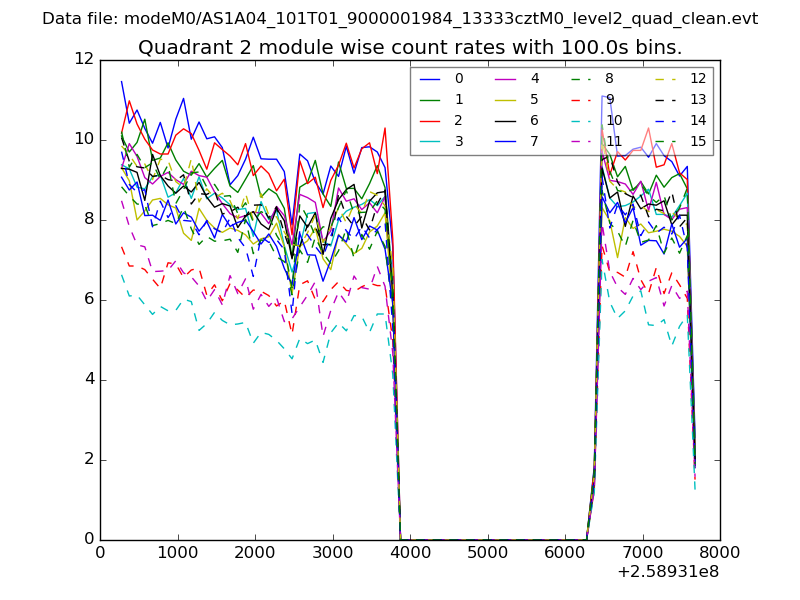
| Module-wise count rates for Quadrant B Data is divided into 100 sec bins |
 |
 |
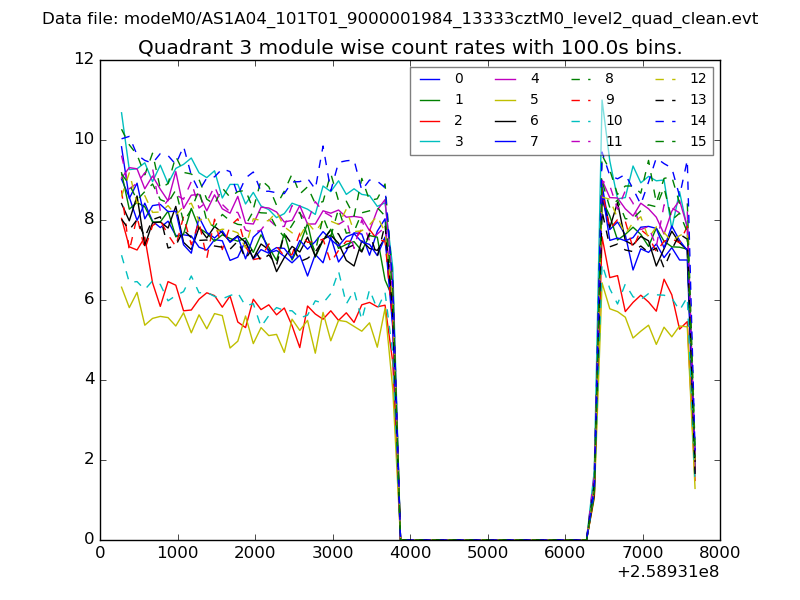
| Module-wise count rates for Quadrant C Data is divided into 100 sec bins |
 |
 |
| Module-wise count rates for Quadrant D Data is divided into 100 sec bins |
 |
 |
| Parameter | Plot |
|---|---|
| CZT HV Monitor | 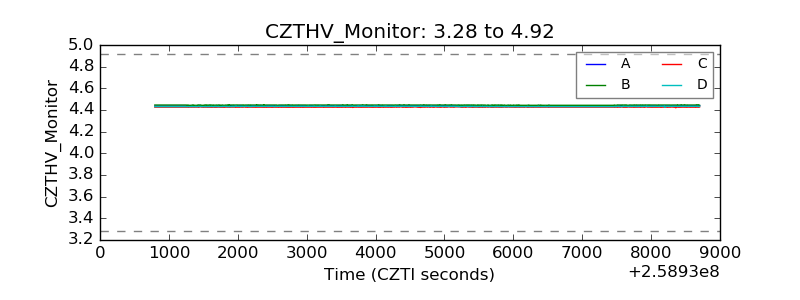 |
| D_VDD | 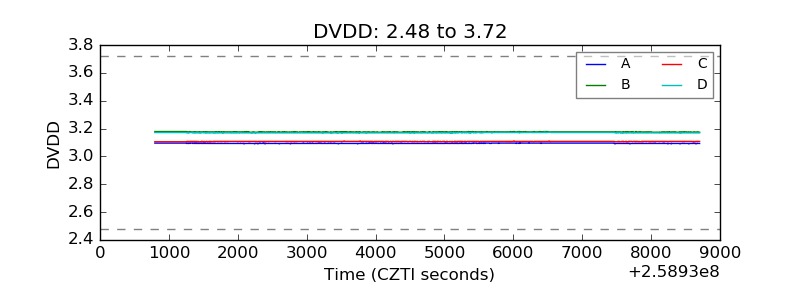 |
| Temperature 1 | 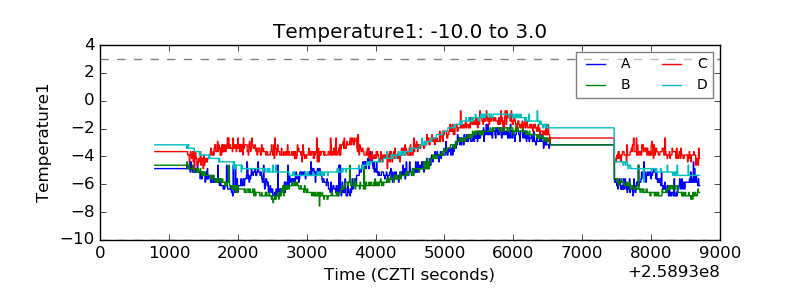 |
| Veto HV Monitor | 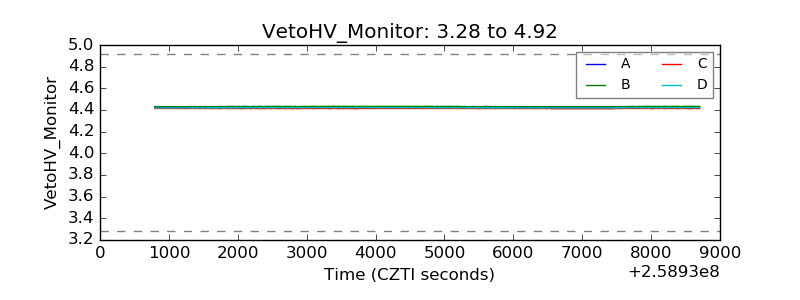 |
| Veto LLD | 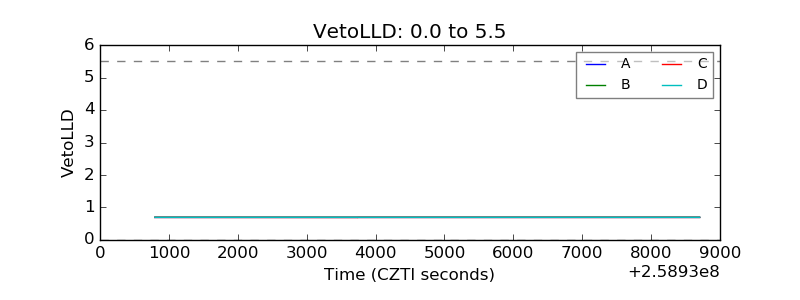 |
| Alpha Counter | 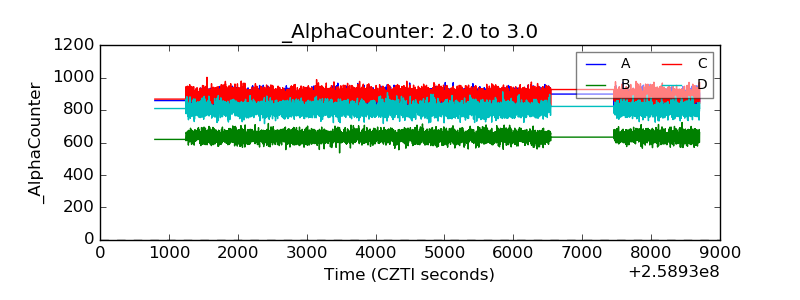 |
| _CPM_Rate | 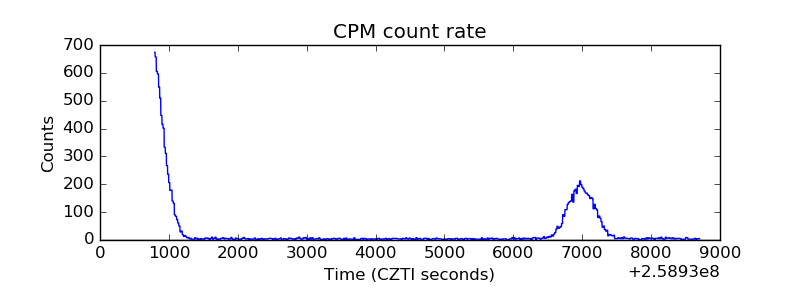 |
| CZT Counter | 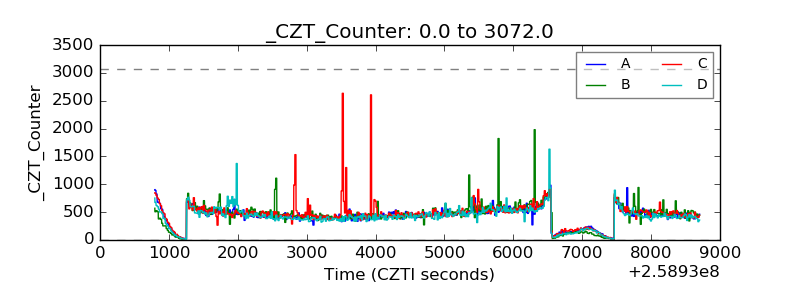 |
| +2.5 Volts monitor |  |
| +5 Volts monitor |  |
| _ROLL_ROT | 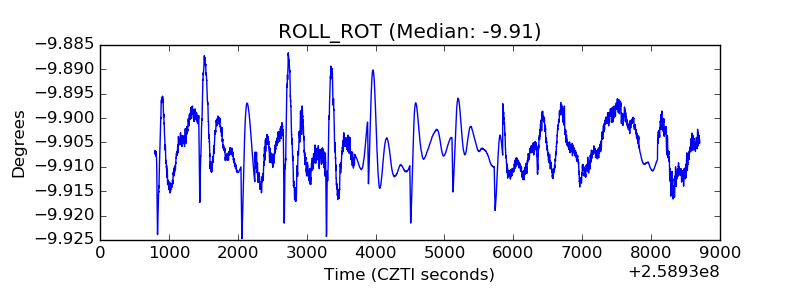 |
| _Roll_DEC | 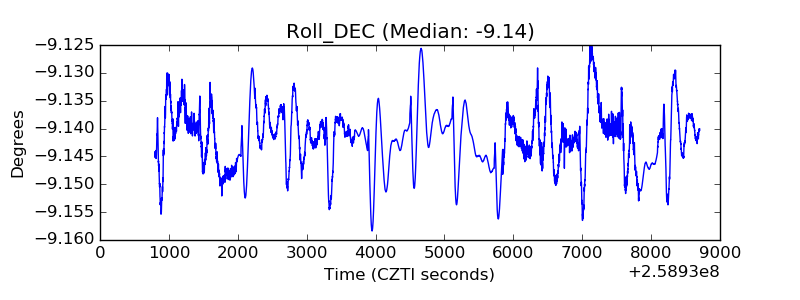 |
| _Roll_RA | 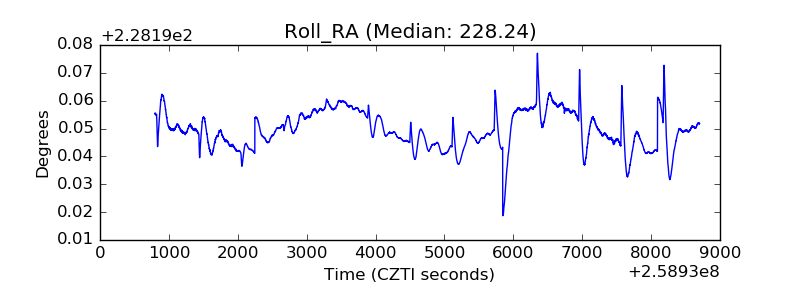 |
| Veto Counter | 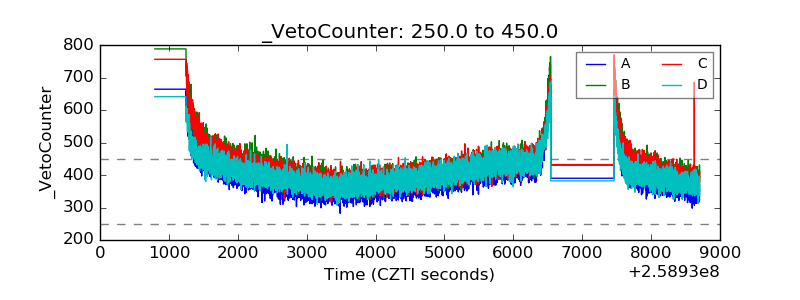 |