| Param | Original file | Final file |
|---|---|---|
| Filename | modeM0/AS1A04_101T01_9000001984_13334cztM0_level2.evt | modeM0/AS1A04_101T01_9000001984_13334cztM0_level2_quad_clean.evt |
| Size (bytes) | 485,412,480 | 99,040,320 |
| Size | 462.9 MB | 94.5 MB |
| Events in quadrant A | 3,519,392 | 624,267 |
| Events in quadrant B | 3,769,254 | 645,238 |
| Events in quadrant C | 3,548,062 | 625,977 |
| Events in quadrant D | 3,366,934 | 594,646 |
| Mode M9 | |||
|---|---|---|---|
| Quadrant | BADHDUFLAG | Total packets | Discarded packets |
| A | 0 | 13 | 0 |
| B | 0 | 13 | 0 |
| C | 0 | 13 | 0 |
| D | 0 | 13 | 0 |
| Mode SS | |||
|---|---|---|---|
| Quadrant | BADHDUFLAG | Total packets | Discarded packets |
| A | 0 | 152 | 0 |
| B | 0 | 152 | 0 |
| C | 0 | 152 | 0 |
| D | 0 | 152 | 0 |
| Mode M0 | |||
|---|---|---|---|
| Quadrant | BADHDUFLAG | Total packets | Discarded packets |
| A | 0 | 15371 | 3 |
| B | 0 | 16021 | 2 |
| C | 0 | 15205 | 2 |
| D | 0 | 15268 | 2 |
| Quadrant | Total seconds | Saturated seconds | Saturation percentage |
|---|---|---|---|
| A | 7310 | 80 | 1.094391% |
| B | 7310 | 166 | 2.270862% |
| C | 7310 | 48 | 0.656635% |
| D | 7310 | 42 | 0.574555% |
Noise dominated data is calculated using 1-second bins in cleaned event files. If a bin has >2000 counts, and if more than 50% of those come from <1% of pixels, then it is considered to be noise-dominated and hence unusable.
| Quadrant | # 1 sec bins | Bins with >0 counts | Bins with >2000 counts | High rate bins dominated by noise | Noise dominated (total time) | Noise dominated (detector-on time) | Marked lightcurve |
|---|---|---|---|---|---|---|---|
| A | 8676 | 7313 | 4 | 4 | 0.05% | 0.05% | 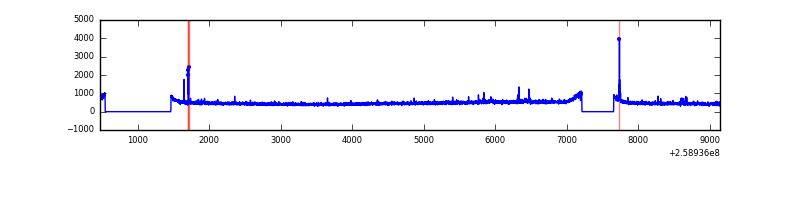 |
| B | 8676 | 7313 | 18 | 18 | 0.21% | 0.25% | 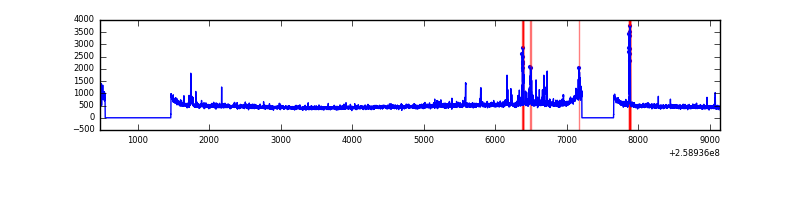 |
| C | 8676 | 7313 | 0 | 0 | 0.00% | 0.00% | 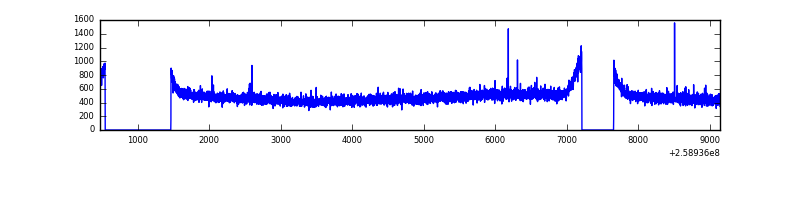 |
| D | 8676 | 7313 | 2 | 2 | 0.02% | 0.03% | 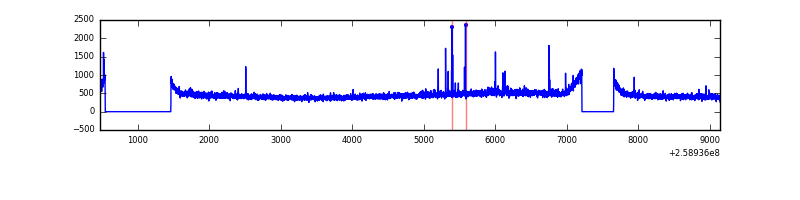 |
Top three noisy pixels from each quadrant. If the there are fewer than three noisy pixels in the level2.evt file, extra rows are filled as -1
| Pixel properties | Quadrant properties | ||||||
|---|---|---|---|---|---|---|---|
| Quadrant | DetID | PixID | Counts | Sigma | Mean | Median | Sigma |
| A | 8 | 15 | 34046 | 180.94 | 896 | 878 | 183.3 |
| A | 9 | 143 | 24148 | 126.94 | 896 | 878 | 183.3 |
| A | 12 | 96 | 13030 | 66.29 | 896 | 878 | 183.3 |
| B | 0 | 197 | 82148 | 461.26 | 904 | 880 | 176.2 |
| B | 3 | 64 | 69835 | 391.37 | 904 | 880 | 176.2 |
| B | 3 | 209 | 31441 | 173.46 | 904 | 880 | 176.2 |
| C | 3 | 233 | 113587 | 549.85 | 878 | 883 | 205.0 |
| C | 13 | 61 | 6390 | 26.87 | 878 | 883 | 205.0 |
| C | 8 | 128 | 4268 | 16.51 | 878 | 883 | 205.0 |
| D | 2 | 234 | 24553 | 112.8 | 867 | 844 | 210.2 |
| D | 14 | 206 | 18450 | 83.77 | 867 | 844 | 210.2 |
| D | 14 | 35 | 18077 | 81.99 | 867 | 844 | 210.2 |
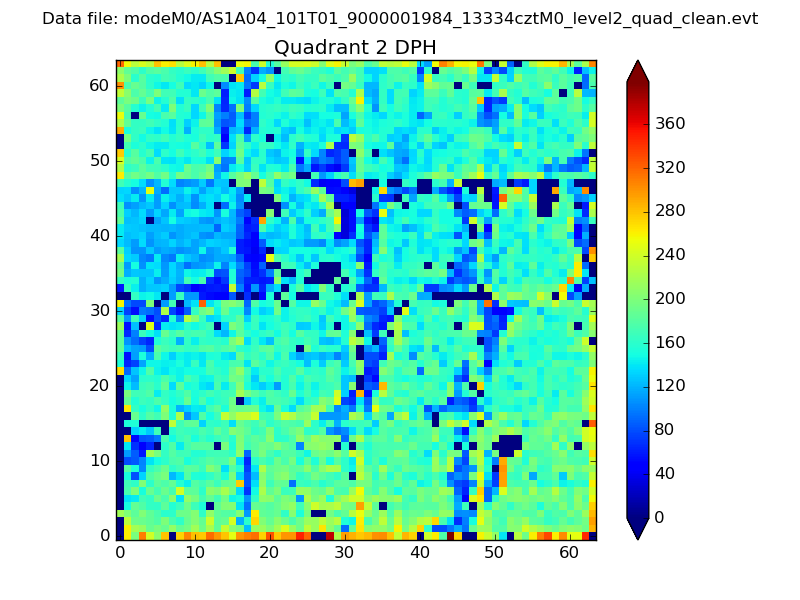
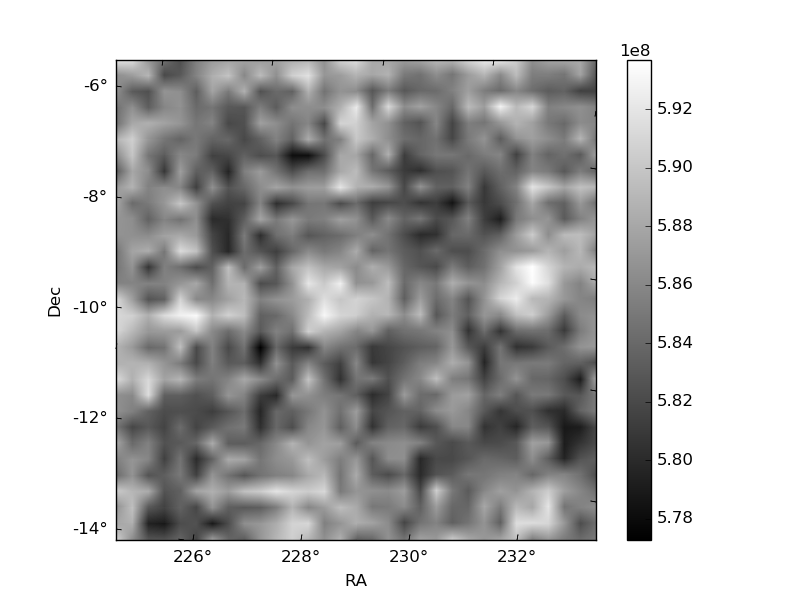
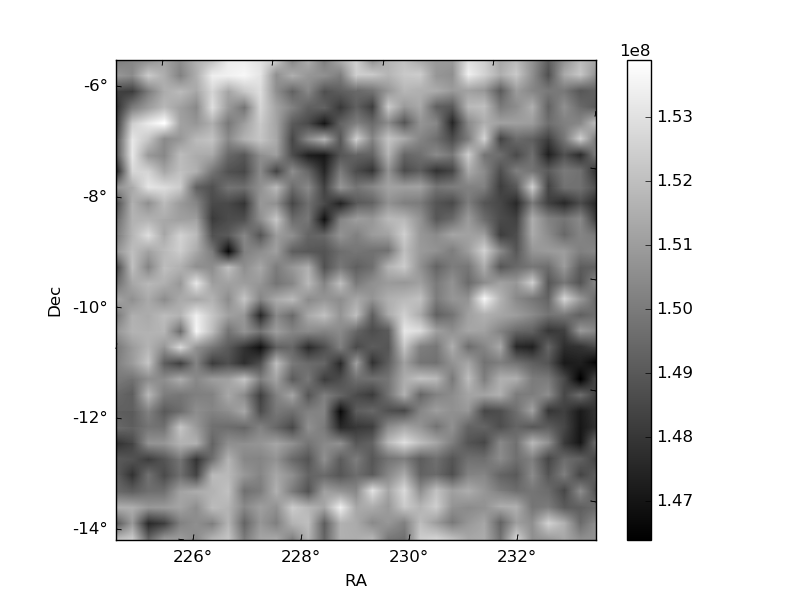
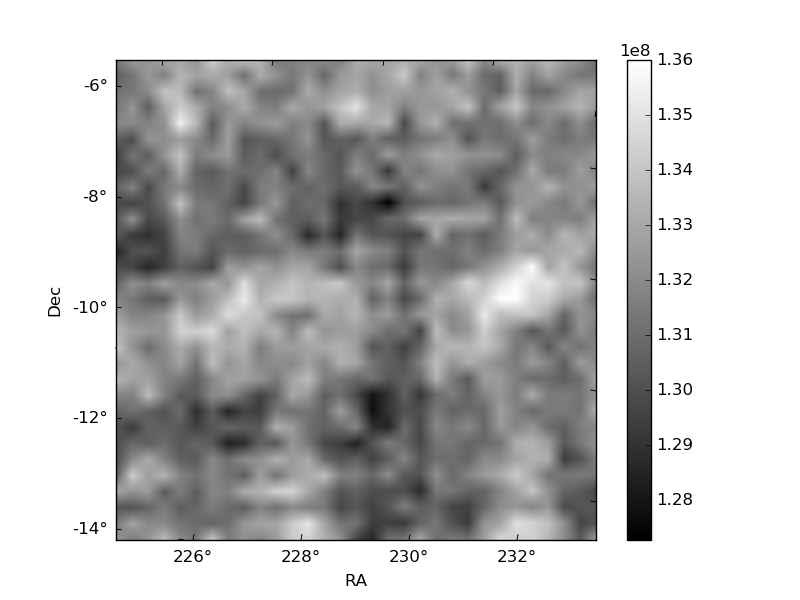
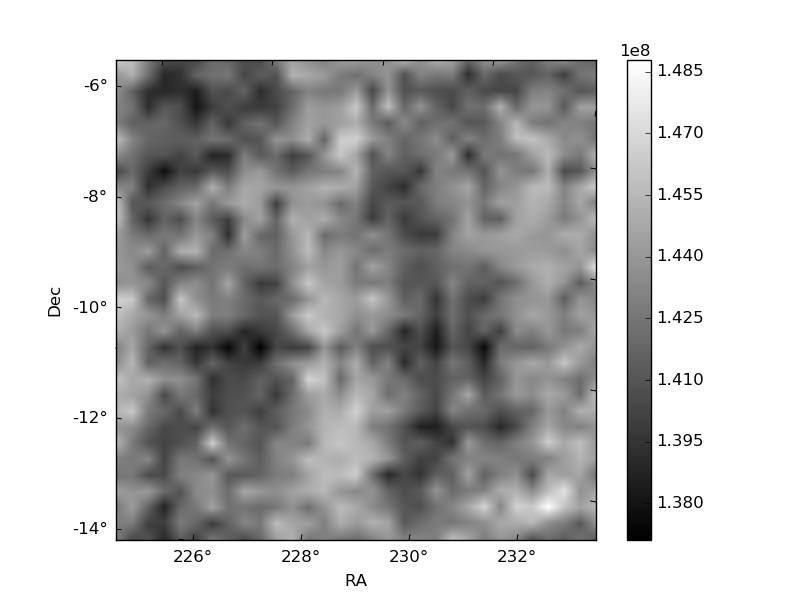
Histogram calculated using DETX and DETY for each event in the final _common_clean file
| Quadrant A | 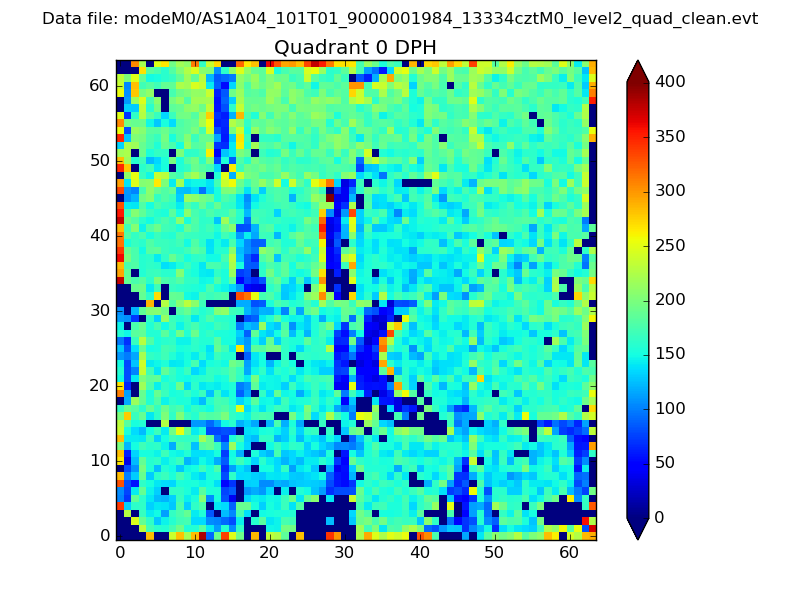 |
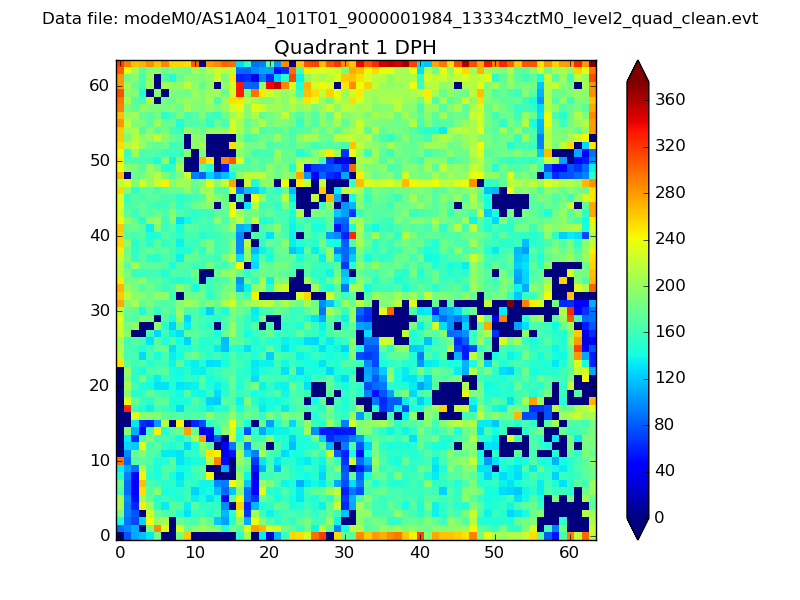 |
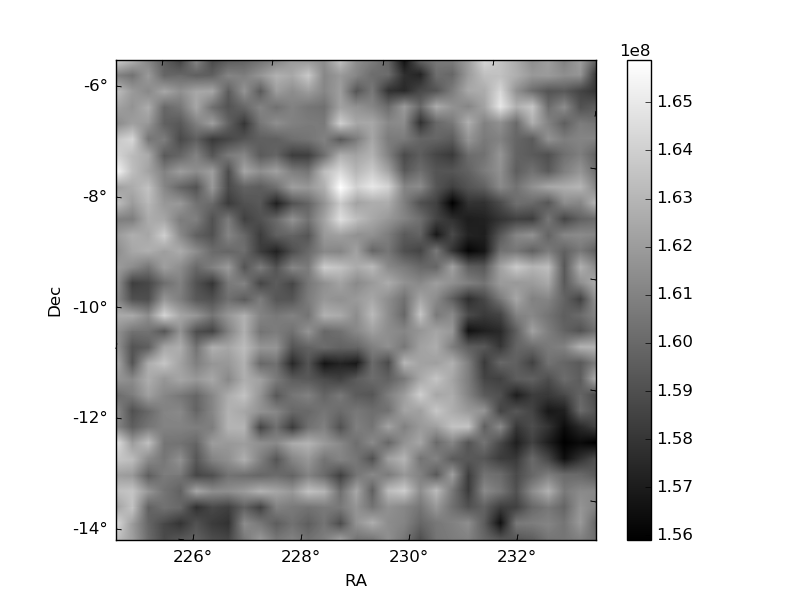
Quadrant B |
|---|---|---|---|
| Quadrant D | 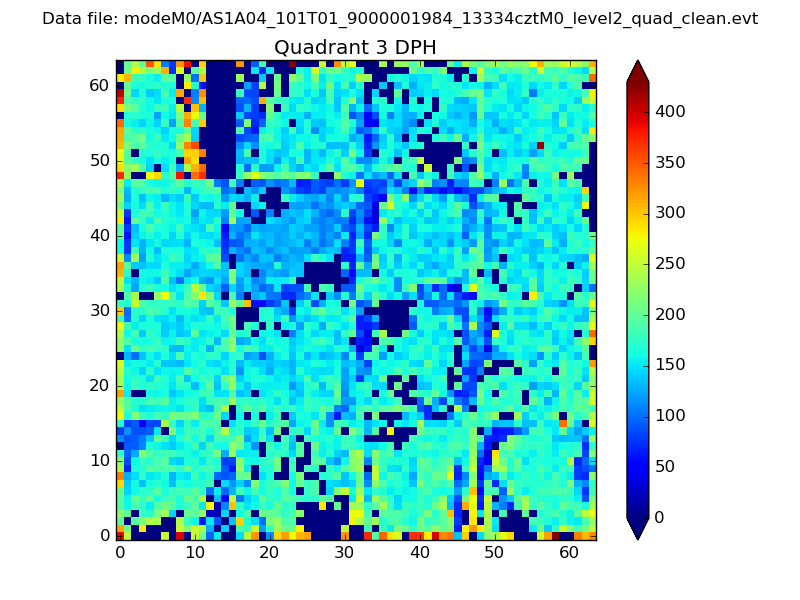 |
 |
Quadrant C |
| Plot type | Count rate plots | Images |
|---|---|---|
| Comparison with Poisson distribution Blue bars denote a histogram of data divided into 1 sec bins. Red curve is a Poisson curve with rate = median count rate of data. |
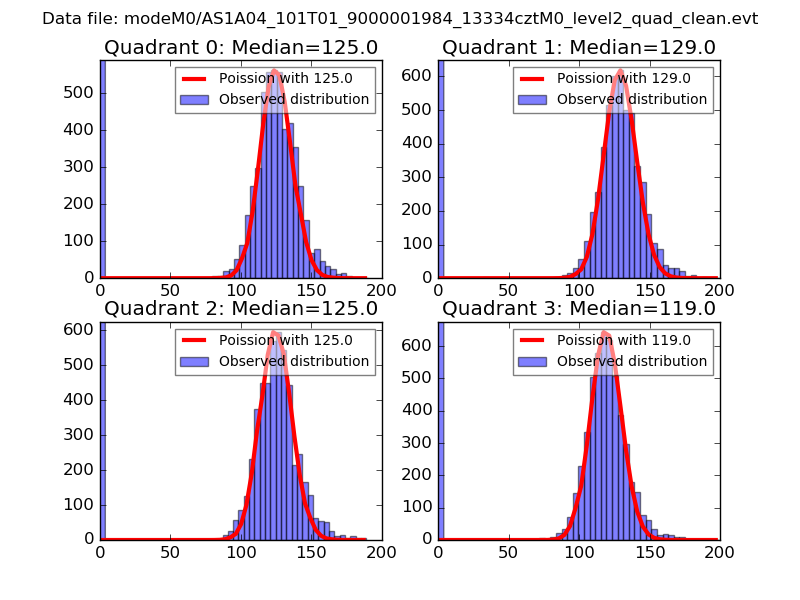 |
 |
| Quadrant-wise count rates Data is divided into 100 sec bins |
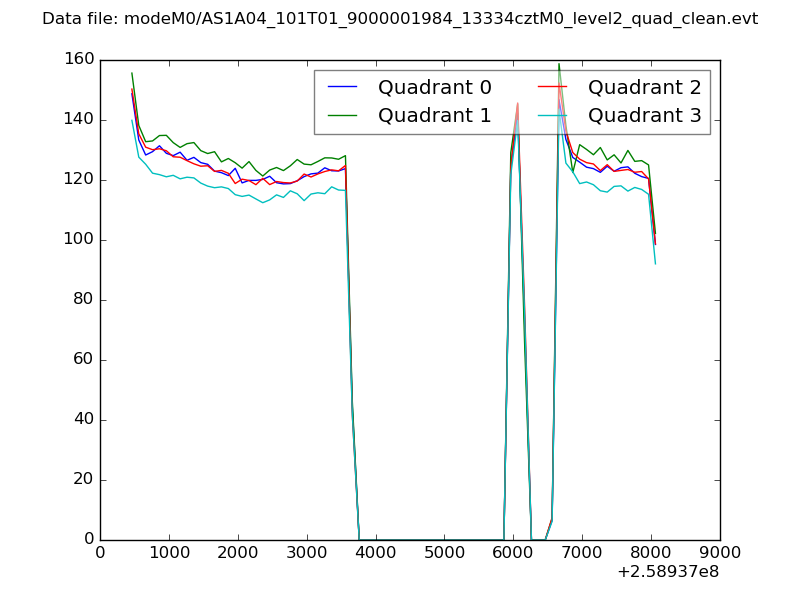 |
|
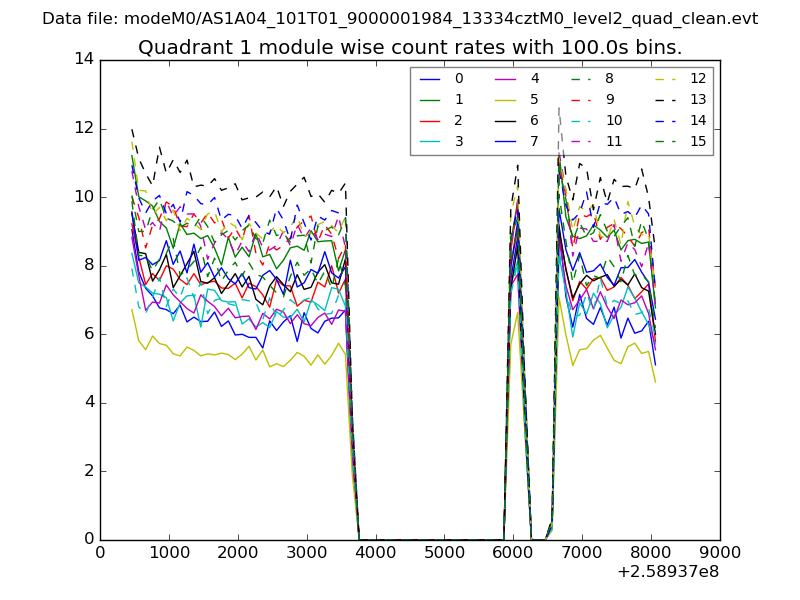
| Module-wise count rates for Quadrant A Data is divided into 100 sec bins |
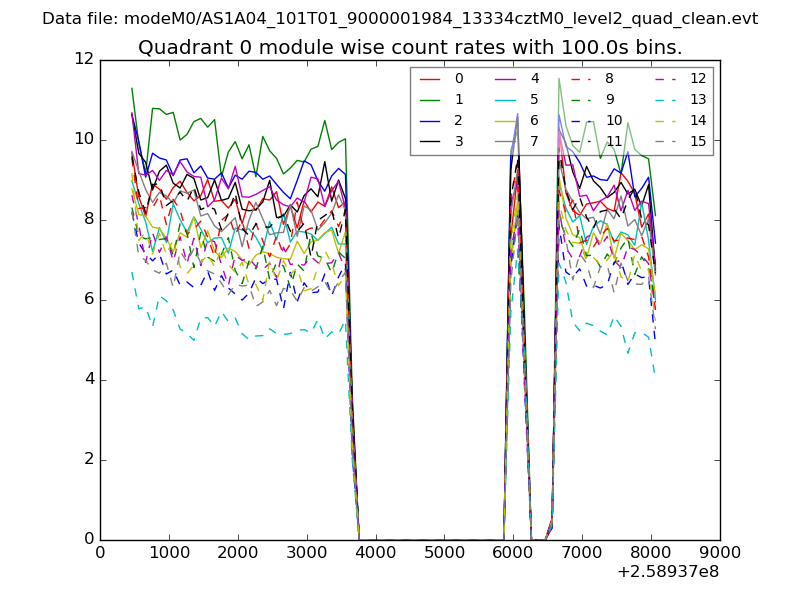 |
 |
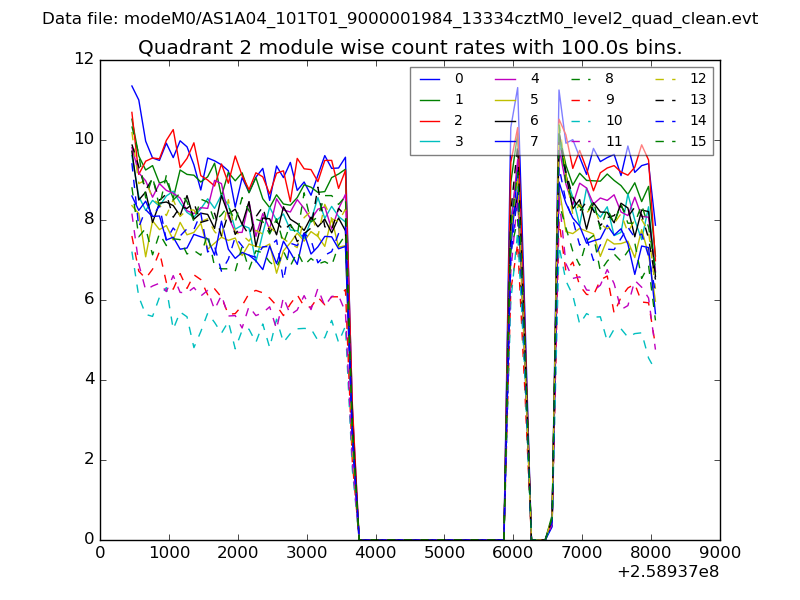
| Module-wise count rates for Quadrant B Data is divided into 100 sec bins |
 |
 |
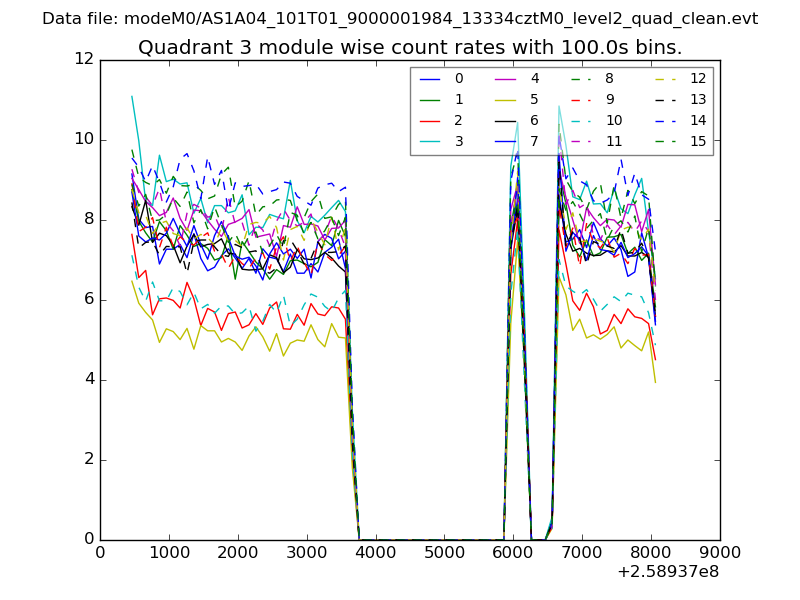
| Module-wise count rates for Quadrant C Data is divided into 100 sec bins |
 |
 |
| Module-wise count rates for Quadrant D Data is divided into 100 sec bins |
 |
 |
| Parameter | Plot |
|---|---|
| CZT HV Monitor |  |
| D_VDD | 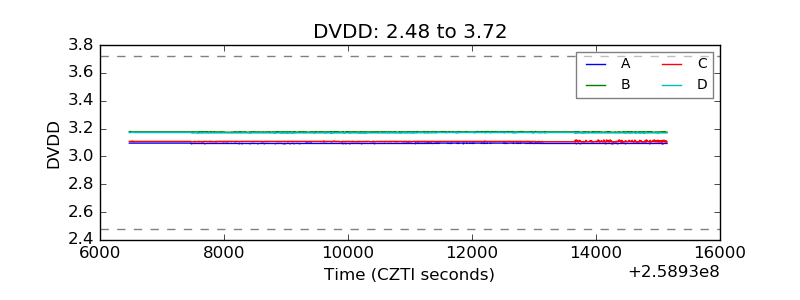 |
| Temperature 1 |  |
| Veto HV Monitor | 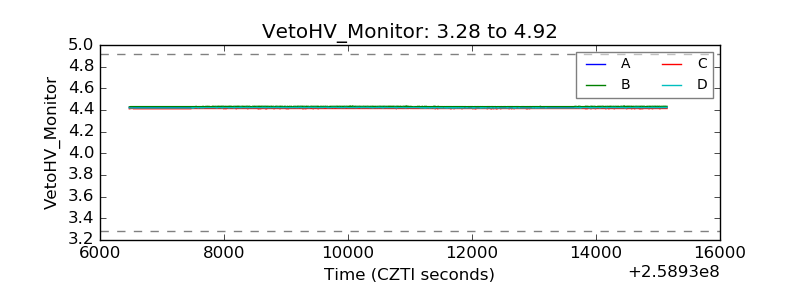 |
| Veto LLD |  |
| Alpha Counter | 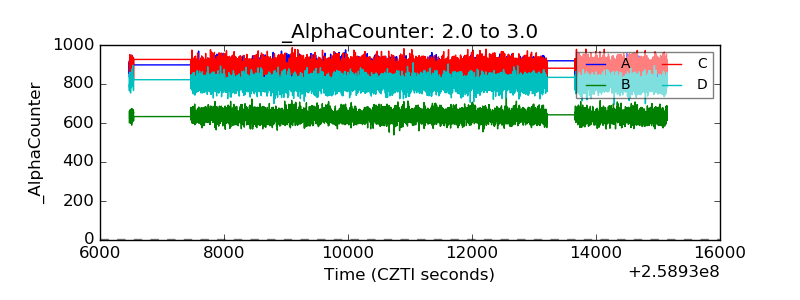 |
| _CPM_Rate | 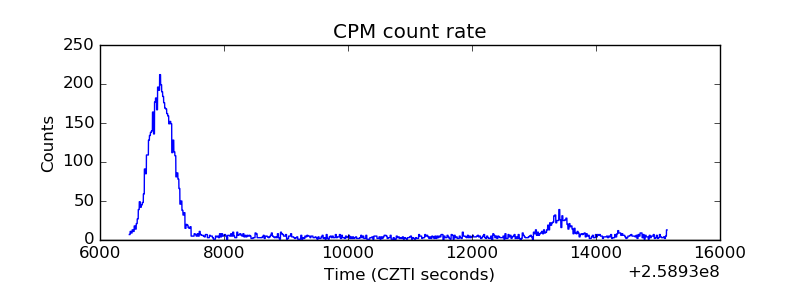 |
| CZT Counter | 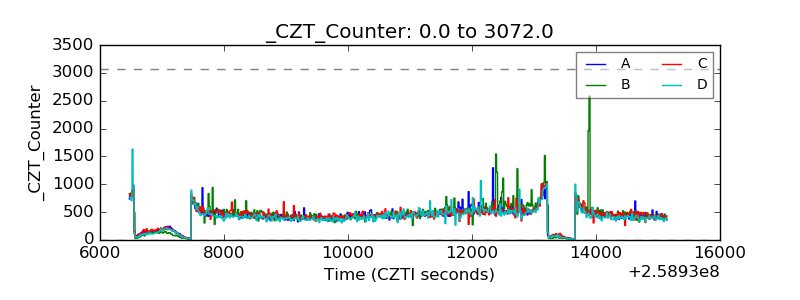 |
| +2.5 Volts monitor |  |
| +5 Volts monitor |  |
| _ROLL_ROT | 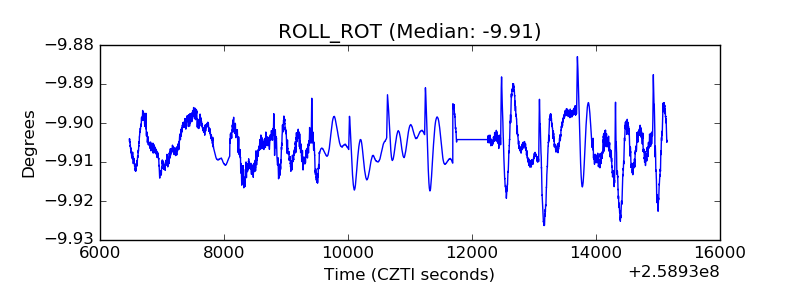 |
| _Roll_DEC | 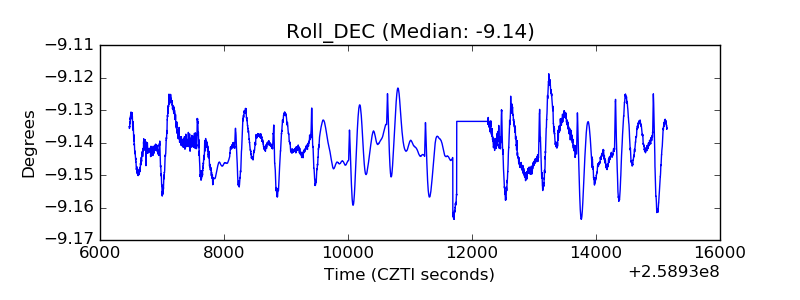 |
| _Roll_RA | 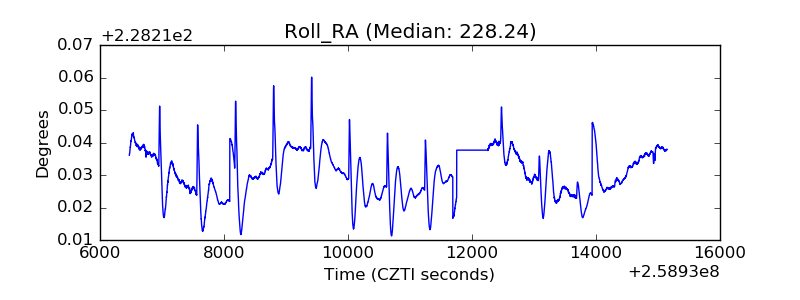 |
| Veto Counter | 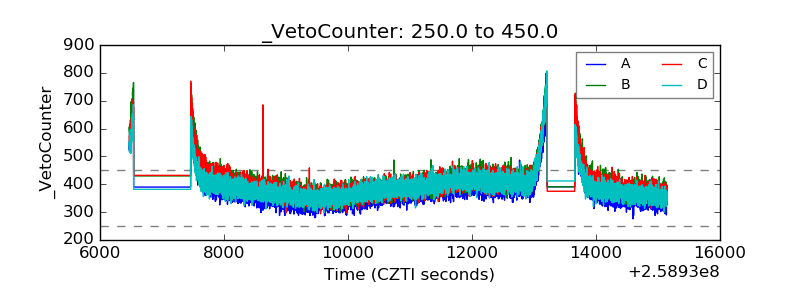 |