| Param | Original file | Final file |
|---|---|---|
| Filename | modeM0/AS1A04_101T01_9000001984_13335cztM0_level2.evt | modeM0/AS1A04_101T01_9000001984_13335cztM0_level2_quad_clean.evt |
| Size (bytes) | 604,941,120 | 119,370,240 |
| Size | 576.9 MB | 113.8 MB |
| Events in quadrant A | 4,420,959 | 748,288 |
| Events in quadrant B | 4,638,737 | 772,229 |
| Events in quadrant C | 4,459,131 | 754,082 |
| Events in quadrant D | 4,191,904 | 716,686 |
| Mode M9 | |||
|---|---|---|---|
| Quadrant | BADHDUFLAG | Total packets | Discarded packets |
| A | 0 | 4 | 0 |
| B | 0 | 4 | 0 |
| C | 0 | 4 | 0 |
| D | 0 | 4 | 0 |
| Mode SS | |||
|---|---|---|---|
| Quadrant | BADHDUFLAG | Total packets | Discarded packets |
| A | 0 | 184 | 0 |
| B | 0 | 184 | 0 |
| C | 0 | 184 | 0 |
| D | 0 | 184 | 0 |
| Mode M0 | |||
|---|---|---|---|
| Quadrant | BADHDUFLAG | Total packets | Discarded packets |
| A | 0 | 19089 | 5 |
| B | 0 | 19604 | 4 |
| C | 0 | 19095 | 4 |
| D | 0 | 18828 | 4 |
| Quadrant | Total seconds | Saturated seconds | Saturation percentage |
|---|---|---|---|
| A | 8980 | 148 | 1.648107% |
| B | 8980 | 257 | 2.861915% |
| C | 8980 | 113 | 1.258352% |
| D | 8980 | 75 | 0.835189% |
Noise dominated data is calculated using 1-second bins in cleaned event files. If a bin has >2000 counts, and if more than 50% of those come from <1% of pixels, then it is considered to be noise-dominated and hence unusable.
| Quadrant | # 1 sec bins | Bins with >0 counts | Bins with >2000 counts | High rate bins dominated by noise | Noise dominated (total time) | Noise dominated (detector-on time) | Marked lightcurve |
|---|---|---|---|---|---|---|---|
| A | 9481 | 8985 | 9 | 9 | 0.09% | 0.10% | 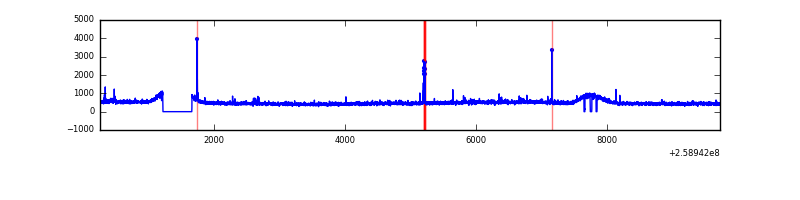 |
| B | 9481 | 8985 | 18 | 18 | 0.19% | 0.20% | 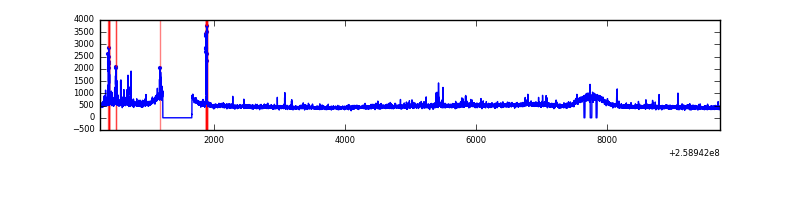 |
| C | 9481 | 8985 | 9 | 9 | 0.09% | 0.10% |  |
| D | 9481 | 8985 | 0 | 0 | 0.00% | 0.00% | 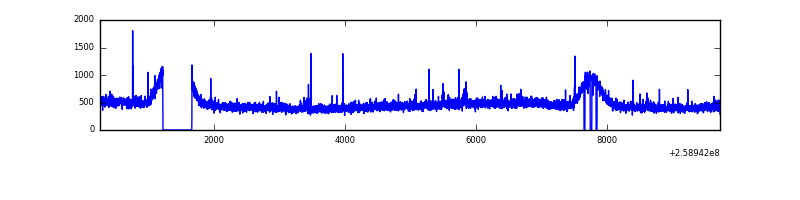 |
Top three noisy pixels from each quadrant. If the there are fewer than three noisy pixels in the level2.evt file, extra rows are filled as -1
| Pixel properties | Quadrant properties | ||||||
|---|---|---|---|---|---|---|---|
| Quadrant | DetID | PixID | Counts | Sigma | Mean | Median | Sigma |
| A | 12 | 96 | 36752 | 154.03 | 1116 | 1089 | 231.5 |
| A | 15 | 69 | 29989 | 124.82 | 1116 | 1089 | 231.5 |
| A | 8 | 15 | 23420 | 96.45 | 1116 | 1089 | 231.5 |
| B | 0 | 197 | 82788 | 370.21 | 1125 | 1095 | 220.7 |
| B | 3 | 64 | 50877 | 225.6 | 1125 | 1095 | 220.7 |
| B | 0 | 189 | 39742 | 175.14 | 1125 | 1095 | 220.7 |
| C | 3 | 233 | 89494 | 345.04 | 1094 | 1100 | 256.2 |
| C | 15 | 208 | 80726 | 310.82 | 1094 | 1100 | 256.2 |
| C | 8 | 128 | 12770 | 45.55 | 1094 | 1100 | 256.2 |
| D | 2 | 234 | 32307 | 116.81 | 1085 | 1050 | 267.6 |
| D | 5 | 222 | 23607 | 84.3 | 1085 | 1050 | 267.6 |
| D | 2 | 136 | 18843 | 66.49 | 1085 | 1050 | 267.6 |
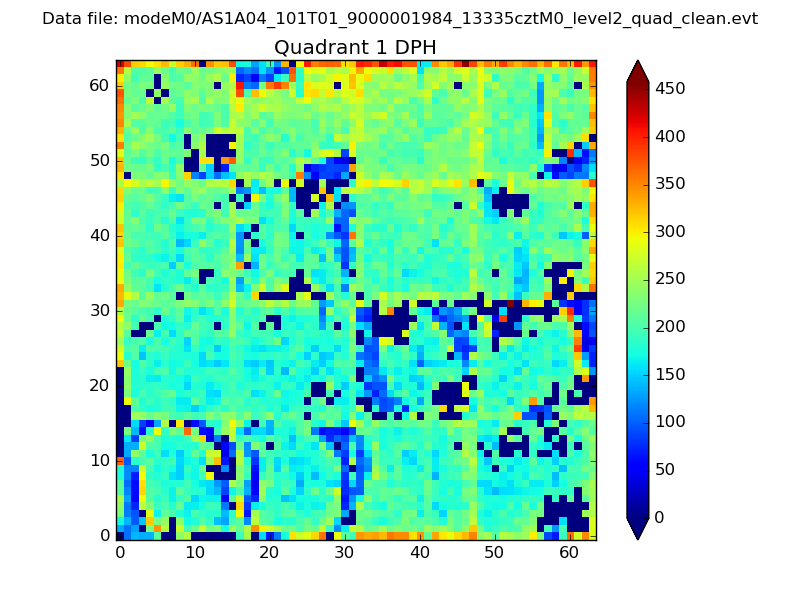
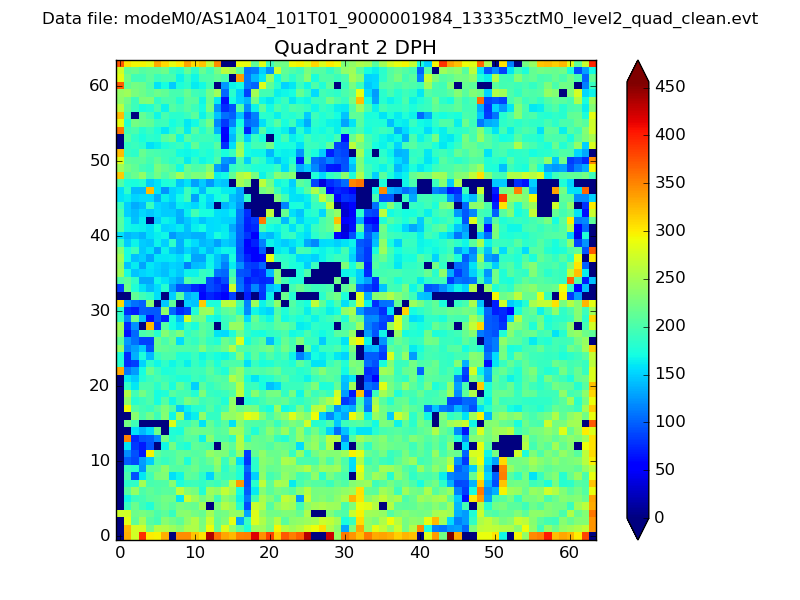
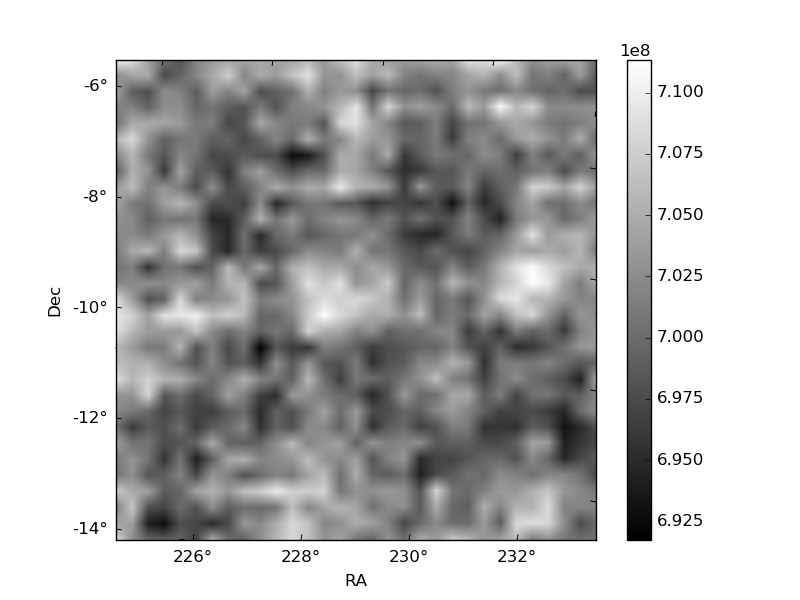
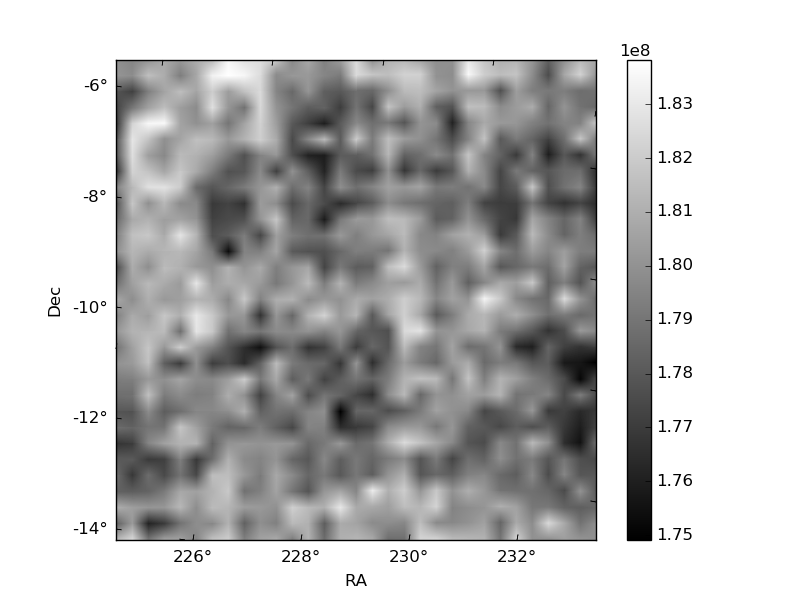
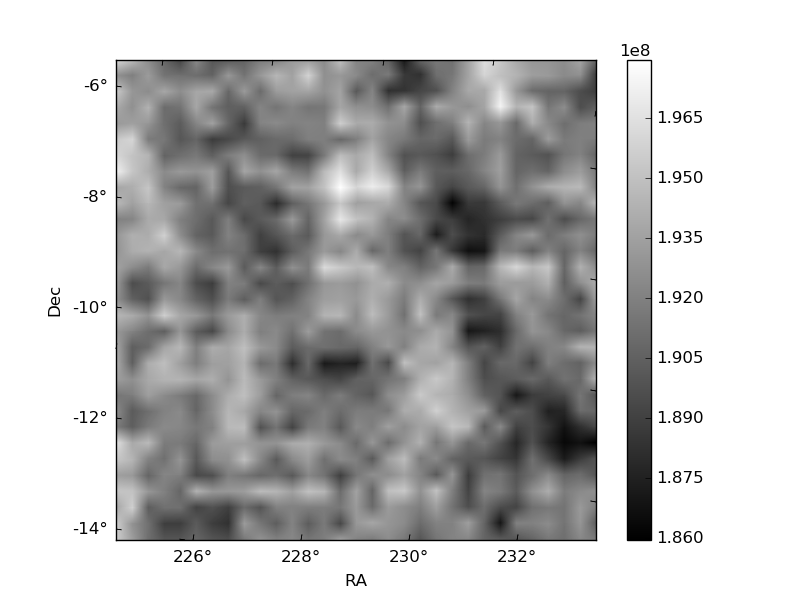
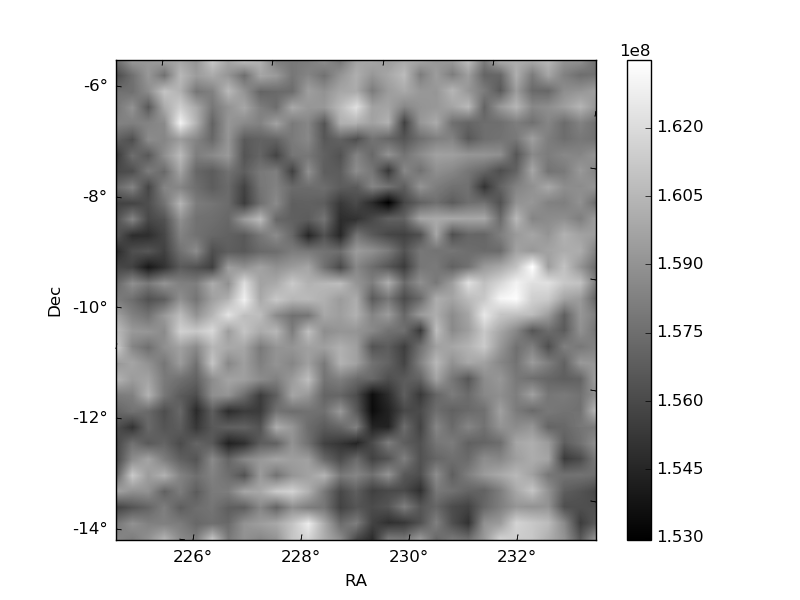
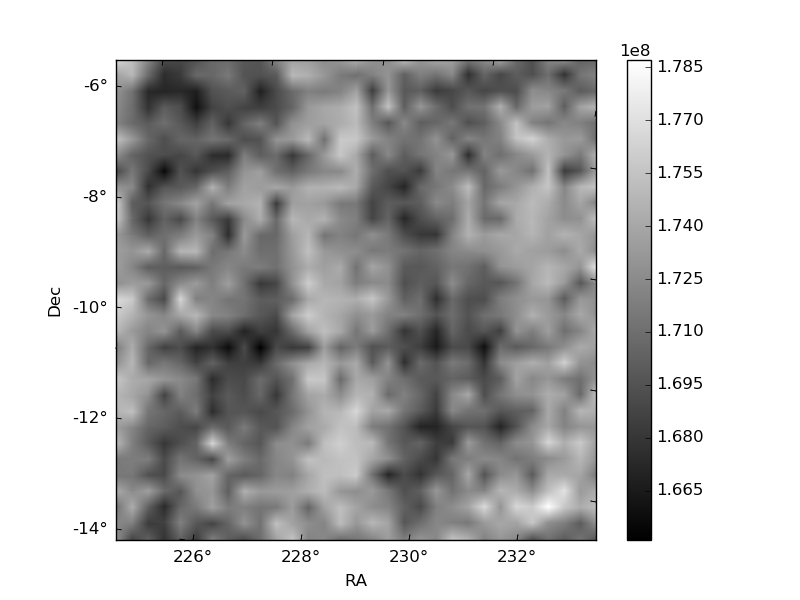
Histogram calculated using DETX and DETY for each event in the final _common_clean file
| Quadrant A | 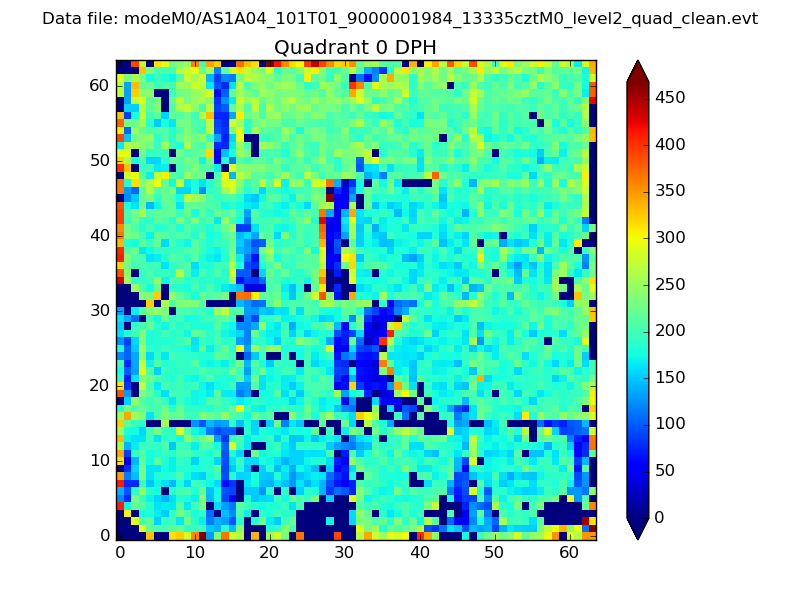 |
 |
Quadrant B |
|---|---|---|---|
| Quadrant D | 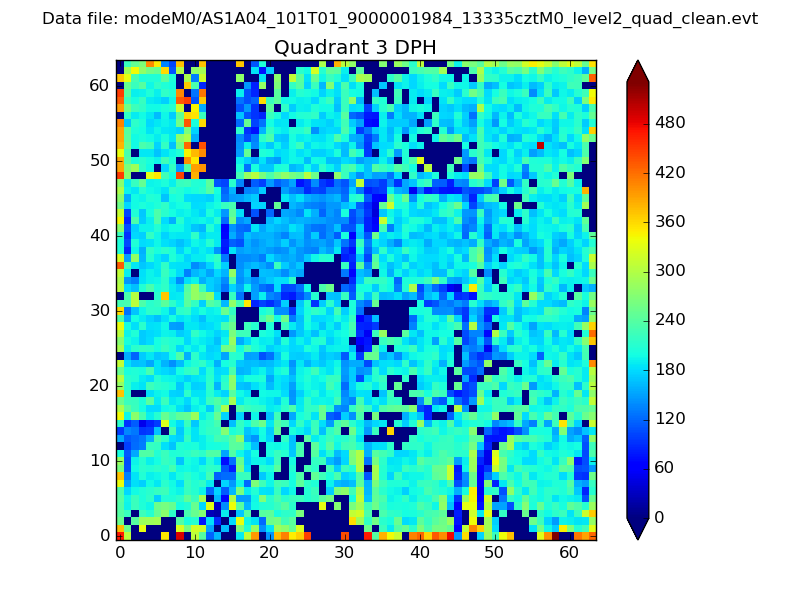 |
 |
Quadrant C |
| Plot type | Count rate plots | Images |
|---|---|---|
| Comparison with Poisson distribution Blue bars denote a histogram of data divided into 1 sec bins. Red curve is a Poisson curve with rate = median count rate of data. |
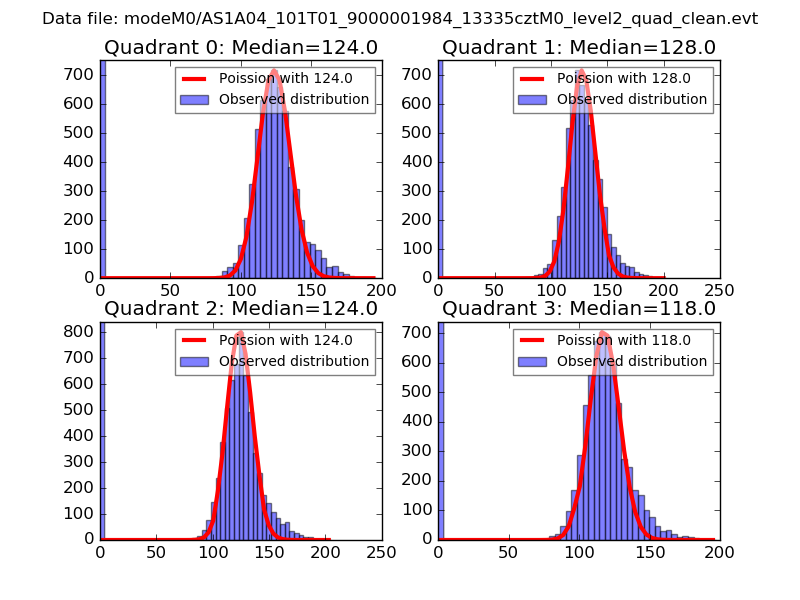 |
 |
| Quadrant-wise count rates Data is divided into 100 sec bins |
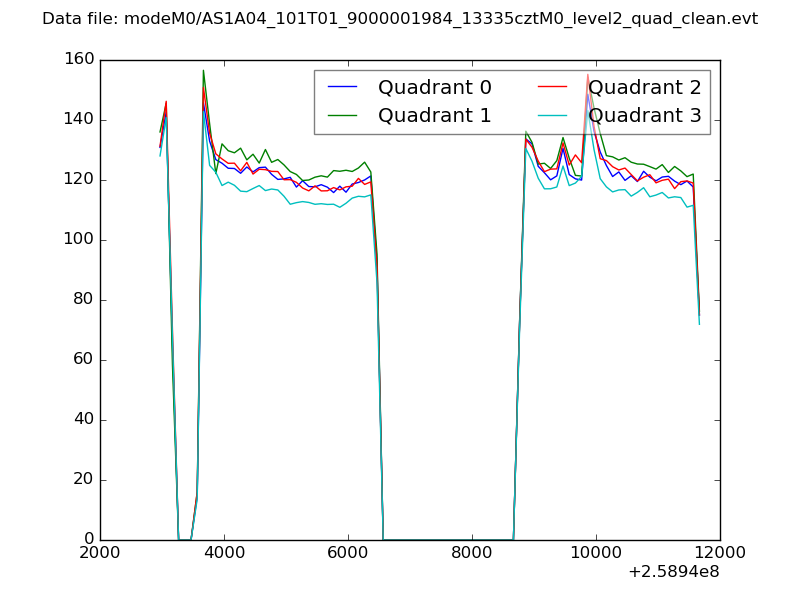 |
|
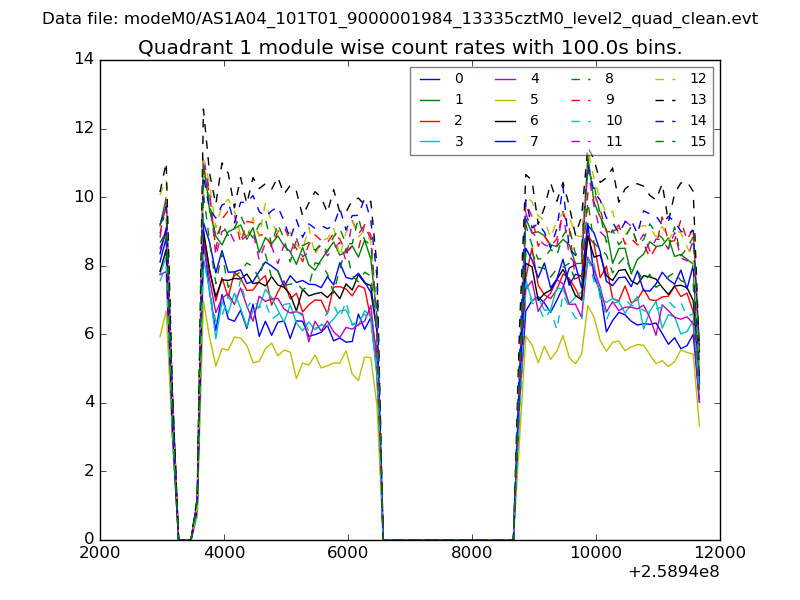
| Module-wise count rates for Quadrant A Data is divided into 100 sec bins |
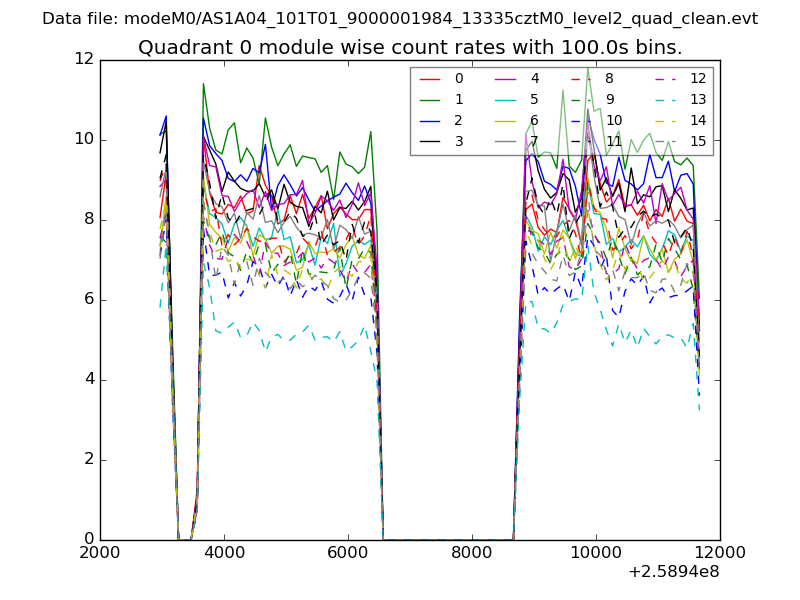 |
 |
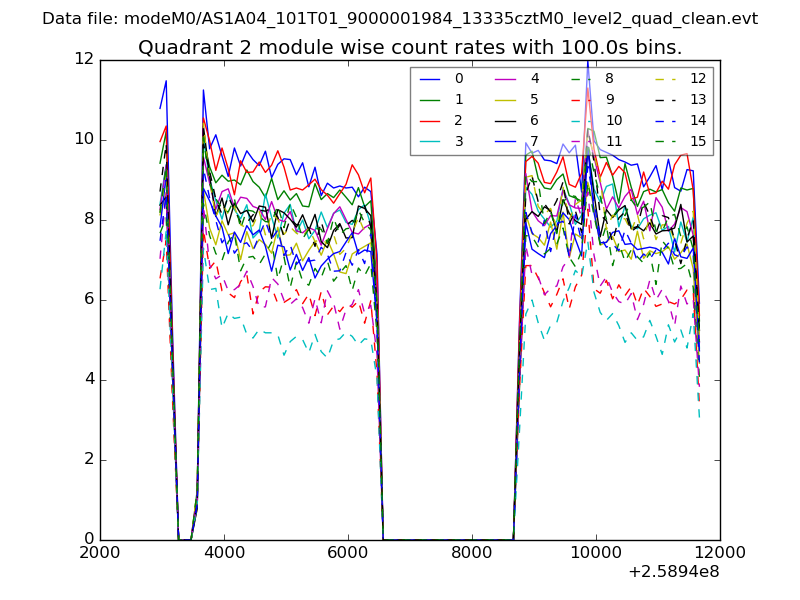
| Module-wise count rates for Quadrant B Data is divided into 100 sec bins |
 |
 |
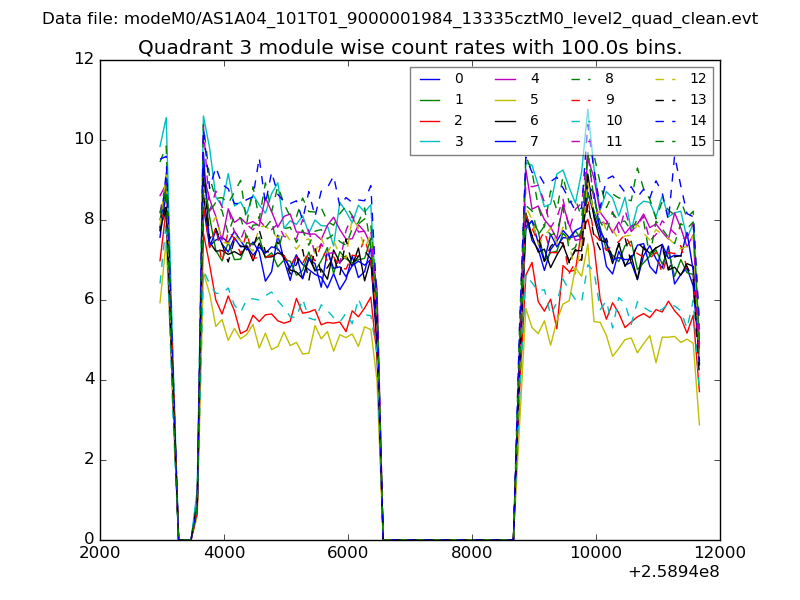
| Module-wise count rates for Quadrant C Data is divided into 100 sec bins |
 |
 |
| Module-wise count rates for Quadrant D Data is divided into 100 sec bins |
 |
 |
| Parameter | Plot |
|---|---|
| CZT HV Monitor | 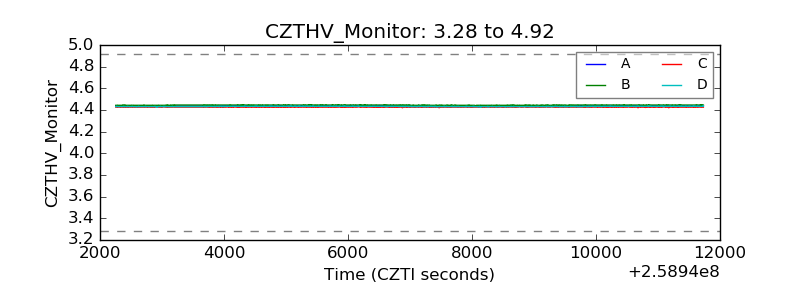 |
| D_VDD | 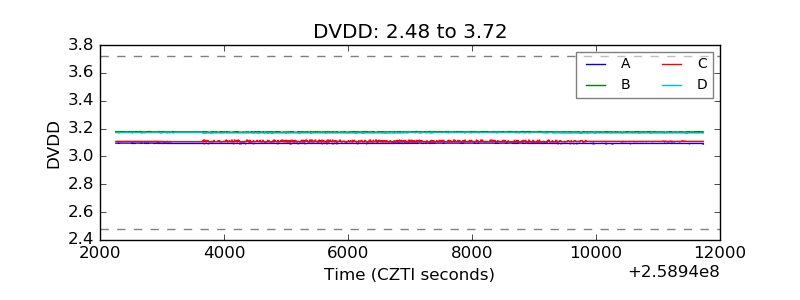 |
| Temperature 1 |  |
| Veto HV Monitor | 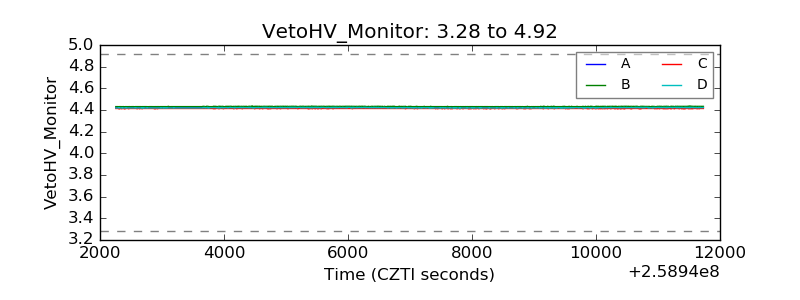 |
| Veto LLD | 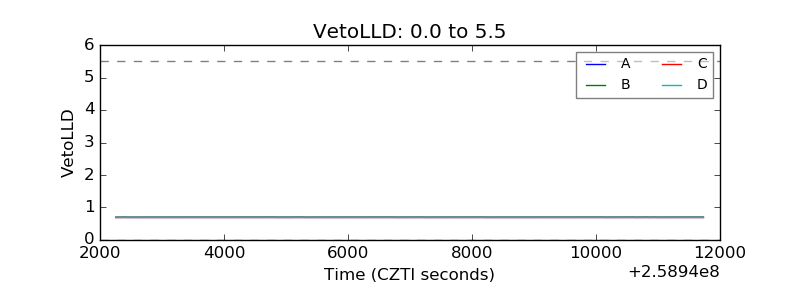 |
| Alpha Counter | 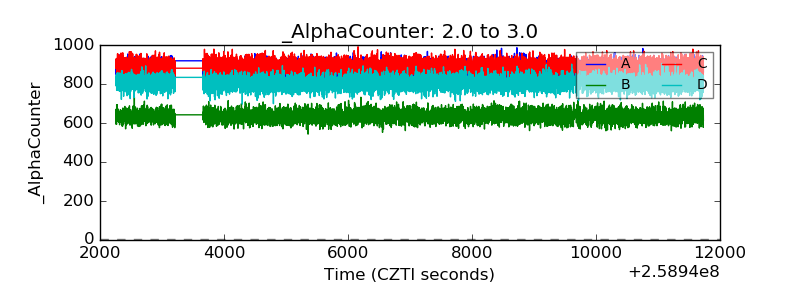 |
| _CPM_Rate | 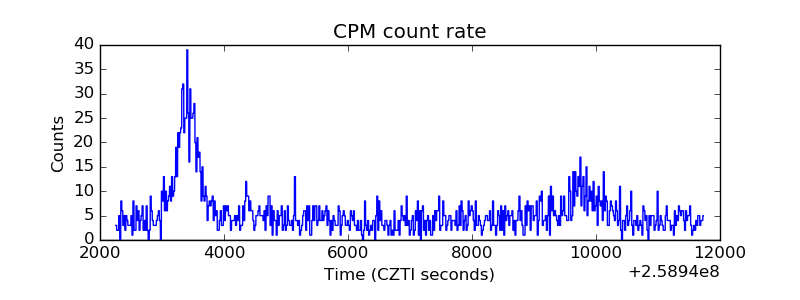 |
| CZT Counter | 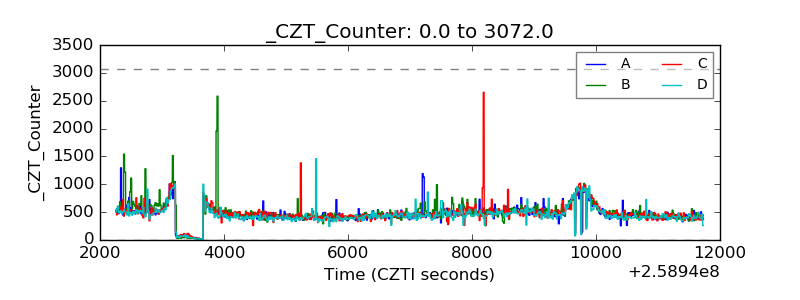 |
| +2.5 Volts monitor |  |
| +5 Volts monitor | 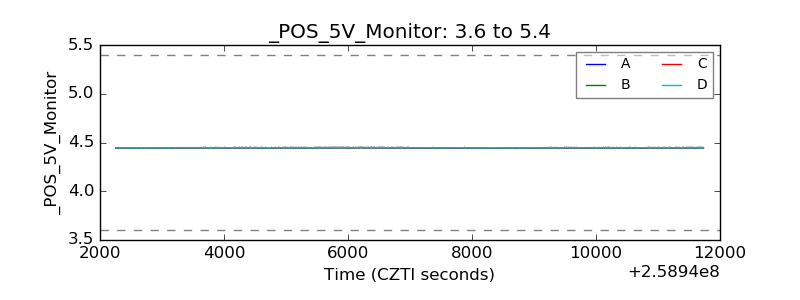 |
| _ROLL_ROT | 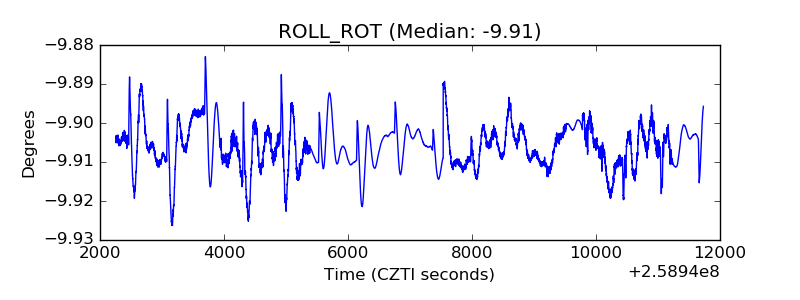 |
| _Roll_DEC | 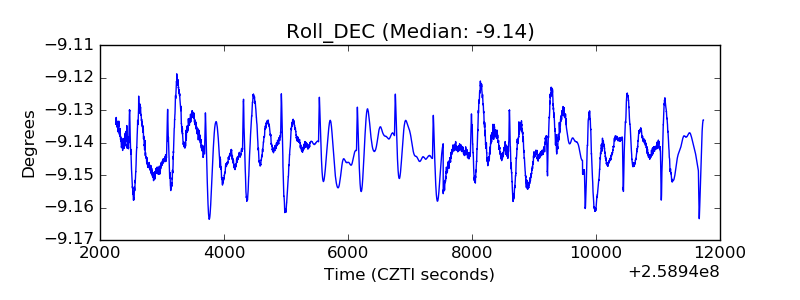 |
| _Roll_RA | 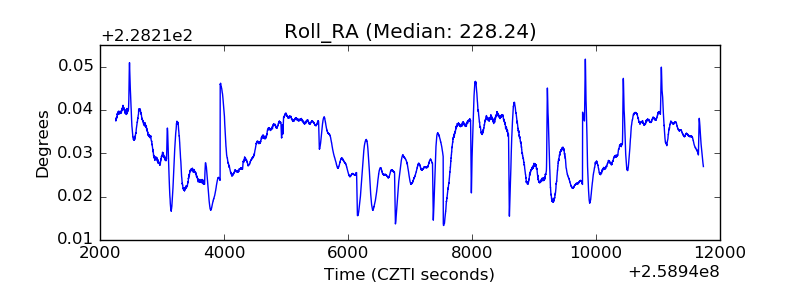 |
| Veto Counter | 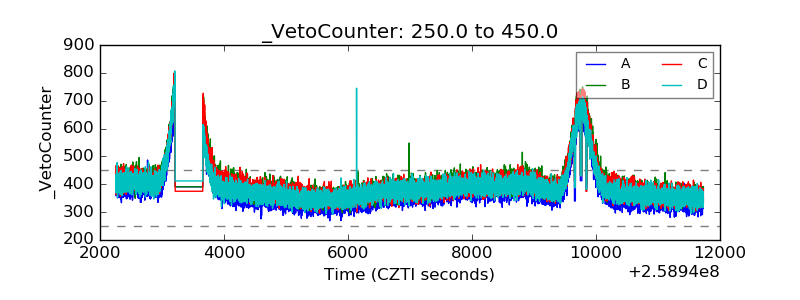 |