| Param | Original file | Final file |
|---|---|---|
| Filename | modeM0/AS1A04_101T01_9000001984_13339cztM0_level2.evt | modeM0/AS1A04_101T01_9000001984_13339cztM0_level2_quad_clean.evt |
| Size (bytes) | 453,389,760 | 90,884,160 |
| Size | 432.4 MB | 86.7 MB |
| Events in quadrant A | 3,295,205 | 569,537 |
| Events in quadrant B | 3,414,494 | 587,555 |
| Events in quadrant C | 3,309,388 | 574,656 |
| Events in quadrant D | 3,248,704 | 545,786 |
| Mode M9 | |||
|---|---|---|---|
| Quadrant | BADHDUFLAG | Total packets | Discarded packets |
| A | 0 | 2 | 0 |
| B | 0 | 1 | 0 |
| C | 0 | 1 | 0 |
| D | 0 | 1 | 0 |
| Mode SS | |||
|---|---|---|---|
| Quadrant | BADHDUFLAG | Total packets | Discarded packets |
| A | 0 | 138 | 0 |
| B | 0 | 138 | 0 |
| C | 0 | 138 | 0 |
| D | 0 | 138 | 0 |
| Mode M0 | |||
|---|---|---|---|
| Quadrant | BADHDUFLAG | Total packets | Discarded packets |
| A | 0 | 14266 | 3 |
| B | 0 | 14514 | 3 |
| C | 0 | 14300 | 3 |
| D | 0 | 14418 | 3 |
| Quadrant | Total seconds | Saturated seconds | Saturation percentage |
|---|---|---|---|
| A | 6812 | 149 | 2.187317% |
| B | 6812 | 210 | 3.082795% |
| C | 6812 | 101 | 1.482678% |
| D | 6812 | 85 | 1.247798% |
Noise dominated data is calculated using 1-second bins in cleaned event files. If a bin has >2000 counts, and if more than 50% of those come from <1% of pixels, then it is considered to be noise-dominated and hence unusable.
| Quadrant | # 1 sec bins | Bins with >0 counts | Bins with >2000 counts | High rate bins dominated by noise | Noise dominated (total time) | Noise dominated (detector-on time) | Marked lightcurve |
|---|---|---|---|---|---|---|---|
| A | 6868 | 6816 | 1 | 1 | 0.01% | 0.01% | 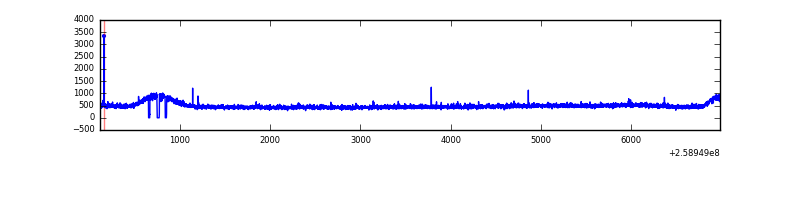 |
| B | 6868 | 6816 | 5 | 5 | 0.07% | 0.07% | 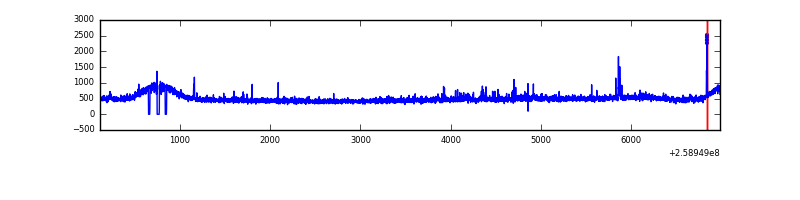 |
| C | 6868 | 6816 | 0 | 0 | 0.00% | 0.00% | 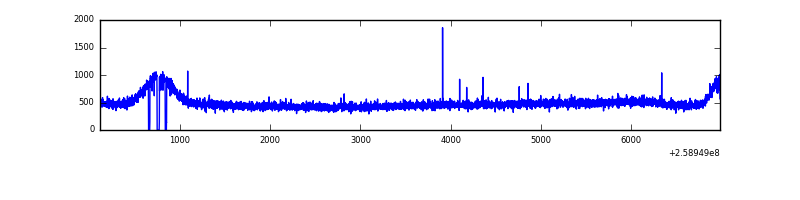 |
| D | 6868 | 6816 | 0 | 0 | 0.00% | 0.00% | 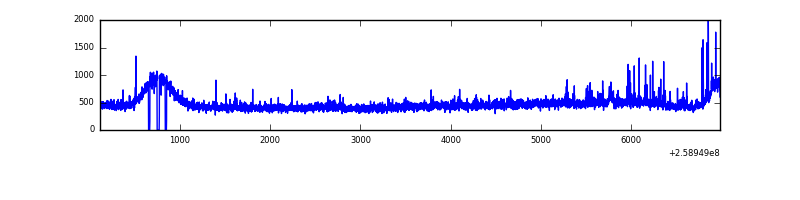 |
Top three noisy pixels from each quadrant. If the there are fewer than three noisy pixels in the level2.evt file, extra rows are filled as -1
| Pixel properties | Quadrant properties | ||||||
|---|---|---|---|---|---|---|---|
| Quadrant | DetID | PixID | Counts | Sigma | Mean | Median | Sigma |
| A | 1 | 162 | 17327 | 94.39 | 846 | 824 | 174.8 |
| A | 0 | 226 | 7680 | 39.21 | 846 | 824 | 174.8 |
| A | 12 | 96 | 7151 | 36.19 | 846 | 824 | 174.8 |
| B | 3 | 64 | 36119 | 212.43 | 851 | 827 | 166.1 |
| B | 3 | 209 | 22563 | 130.83 | 851 | 827 | 166.1 |
| B | 12 | 111 | 19499 | 112.39 | 851 | 827 | 166.1 |
| C | 3 | 233 | 63976 | 323.41 | 829 | 832 | 195.2 |
| C | 6 | 96 | 7463 | 33.96 | 829 | 832 | 195.2 |
| C | 13 | 61 | 5937 | 26.15 | 829 | 832 | 195.2 |
| D | 1 | 52 | 80221 | 392.23 | 824 | 797 | 202.5 |
| D | 2 | 234 | 26172 | 125.31 | 824 | 797 | 202.5 |
| D | 8 | 195 | 22848 | 108.9 | 824 | 797 | 202.5 |
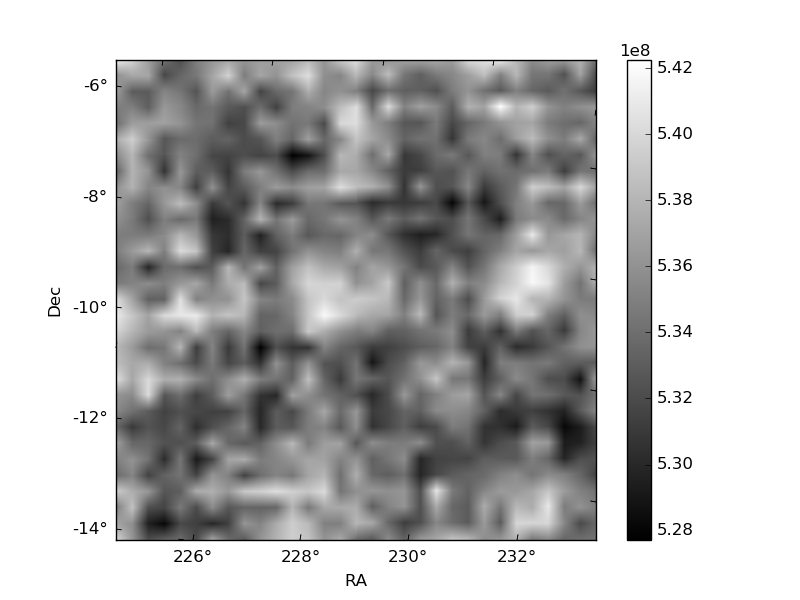
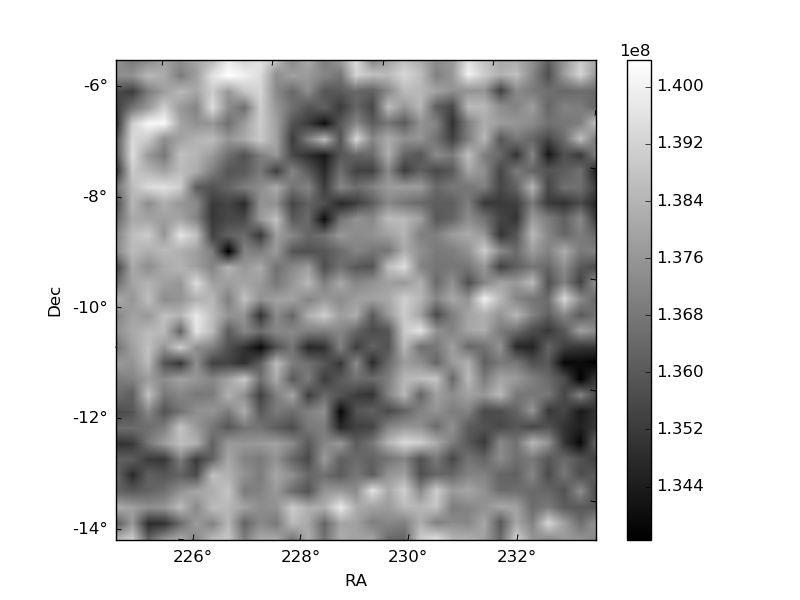
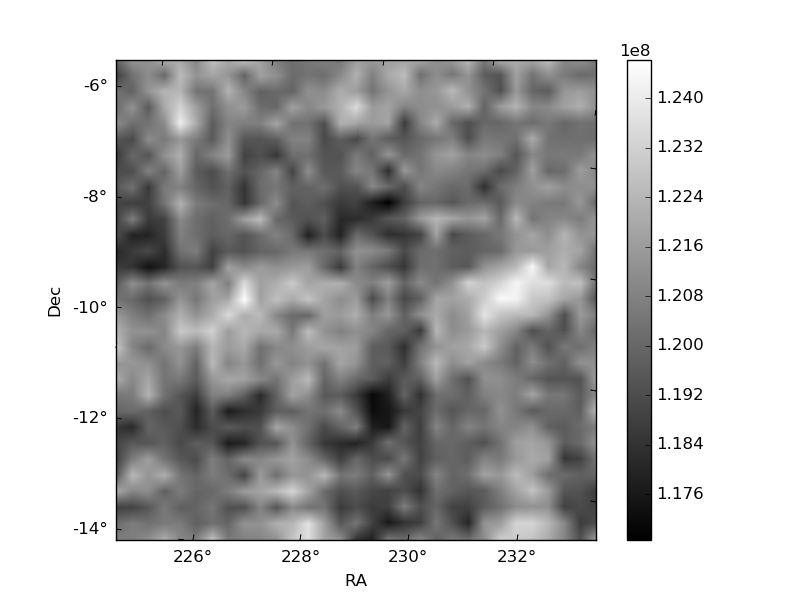
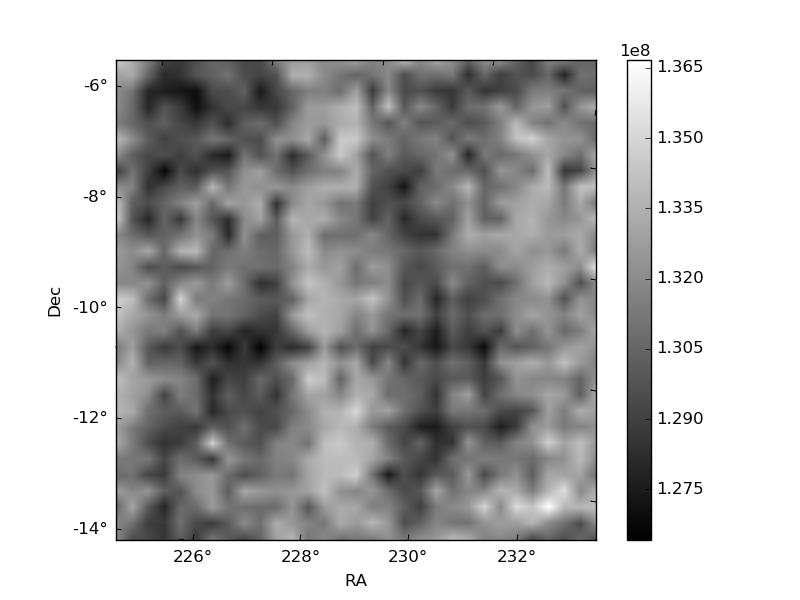
Histogram calculated using DETX and DETY for each event in the final _common_clean file
| Quadrant A | 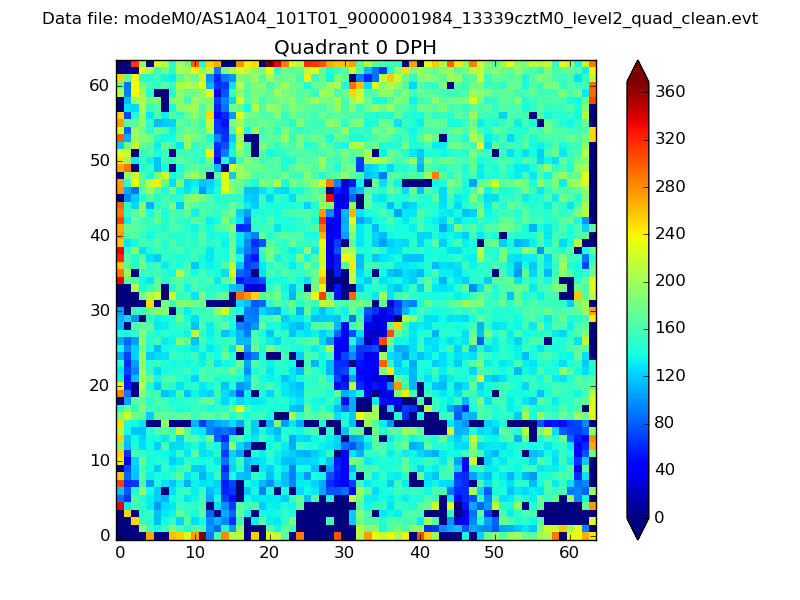 |
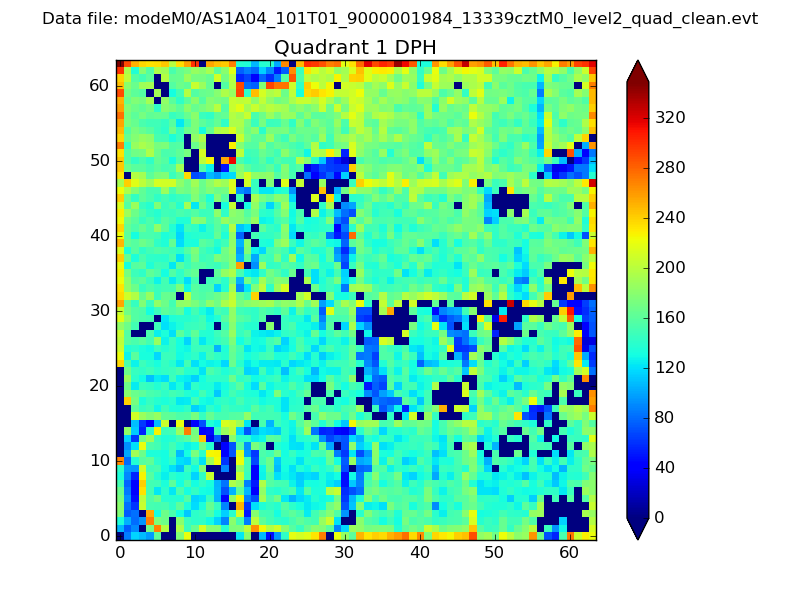 |
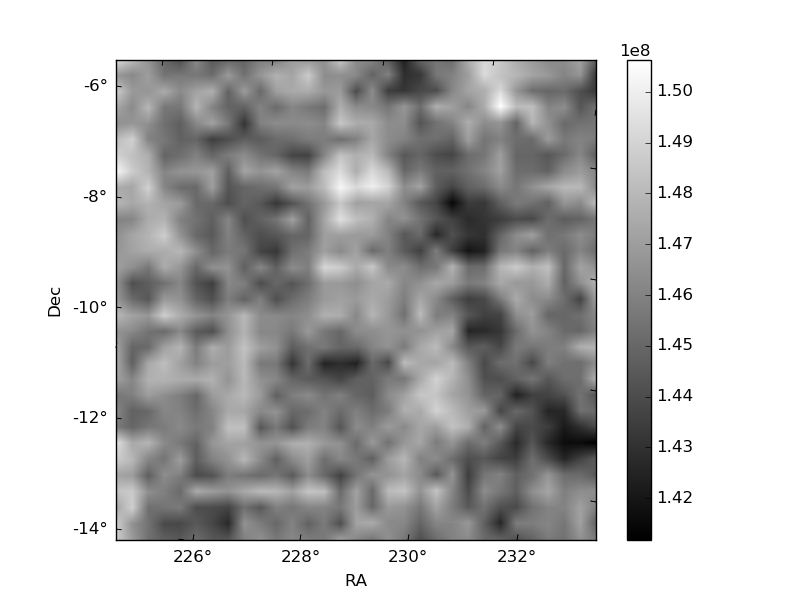
Quadrant B |
|---|---|---|---|
| Quadrant D | 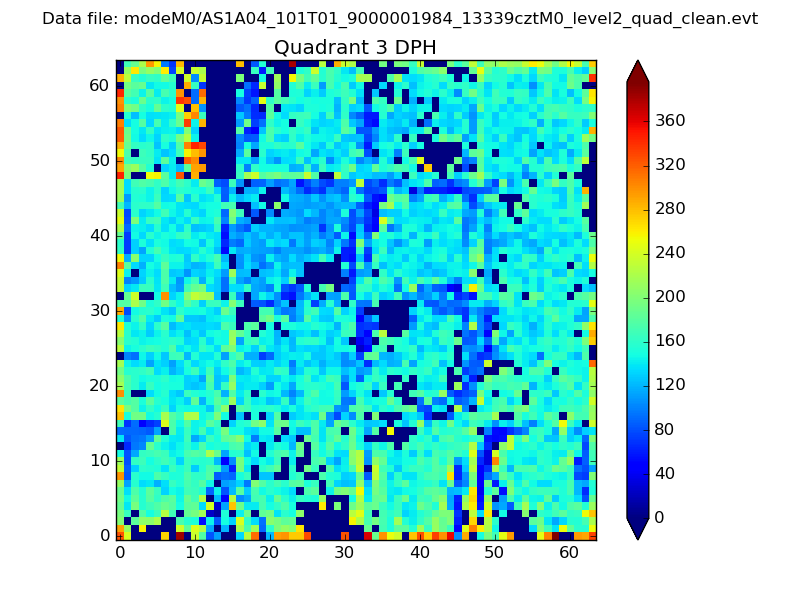 |
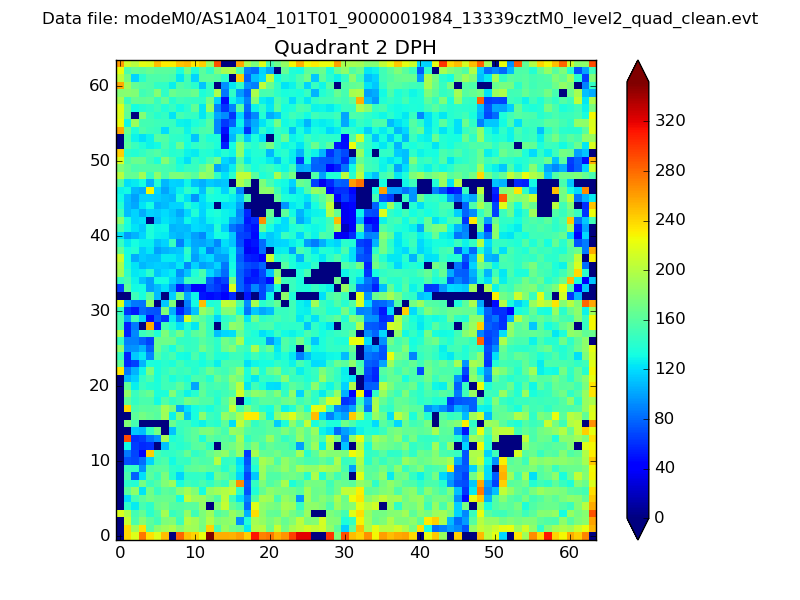 |
Quadrant C |
| Plot type | Count rate plots | Images |
|---|---|---|
| Comparison with Poisson distribution Blue bars denote a histogram of data divided into 1 sec bins. Red curve is a Poisson curve with rate = median count rate of data. |
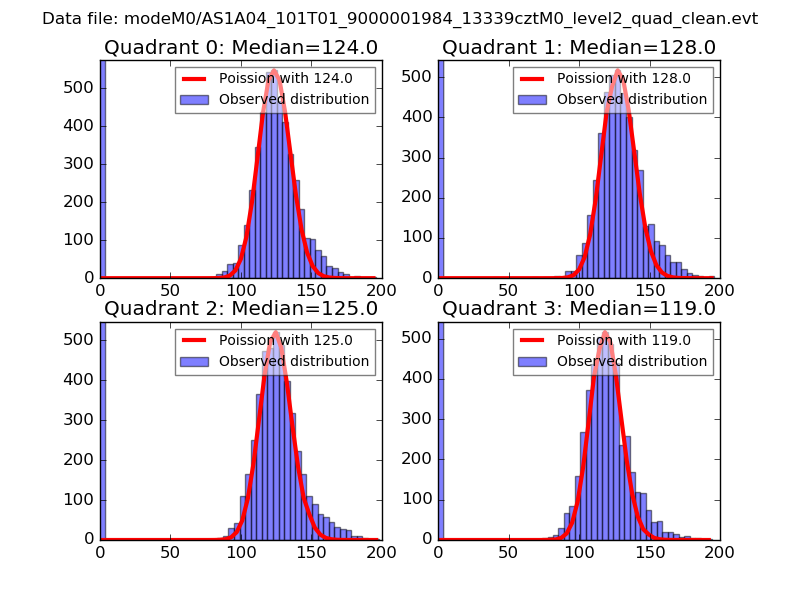 |
 |
| Quadrant-wise count rates Data is divided into 100 sec bins |
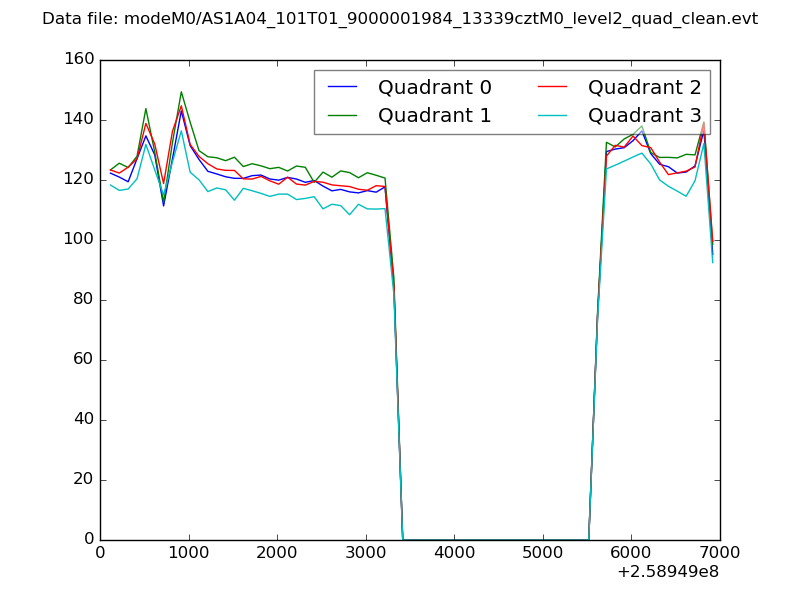 |
|
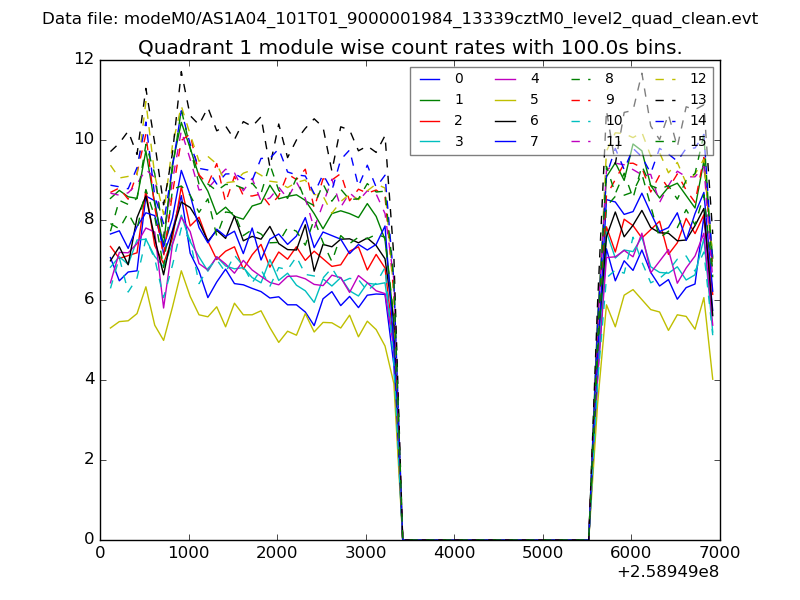
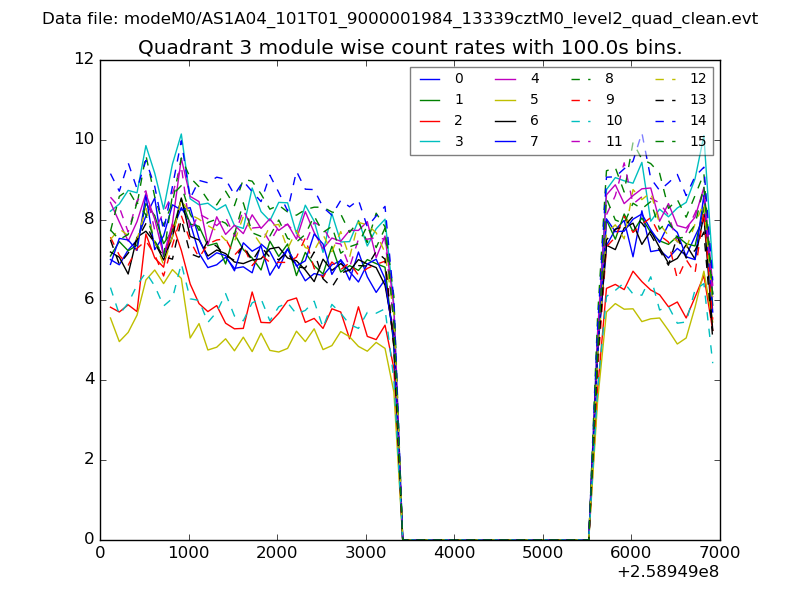
| Module-wise count rates for Quadrant A Data is divided into 100 sec bins |
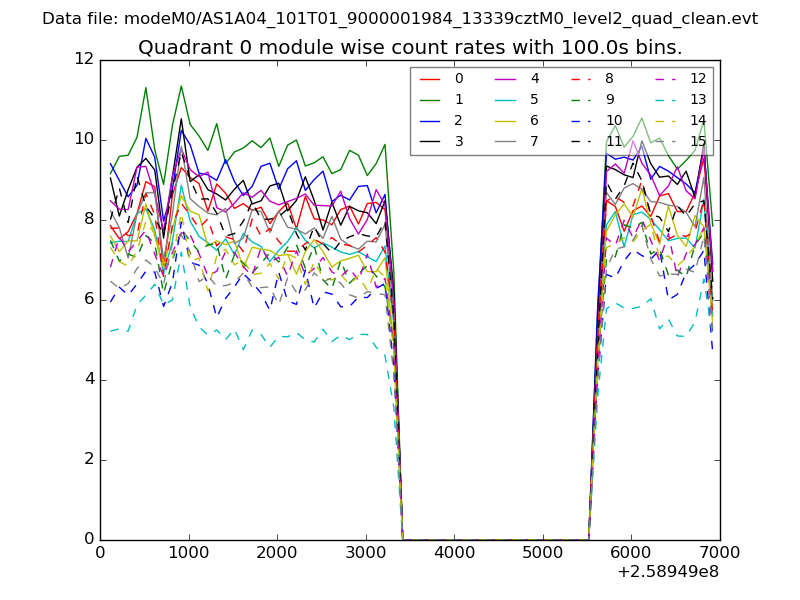 |
 |
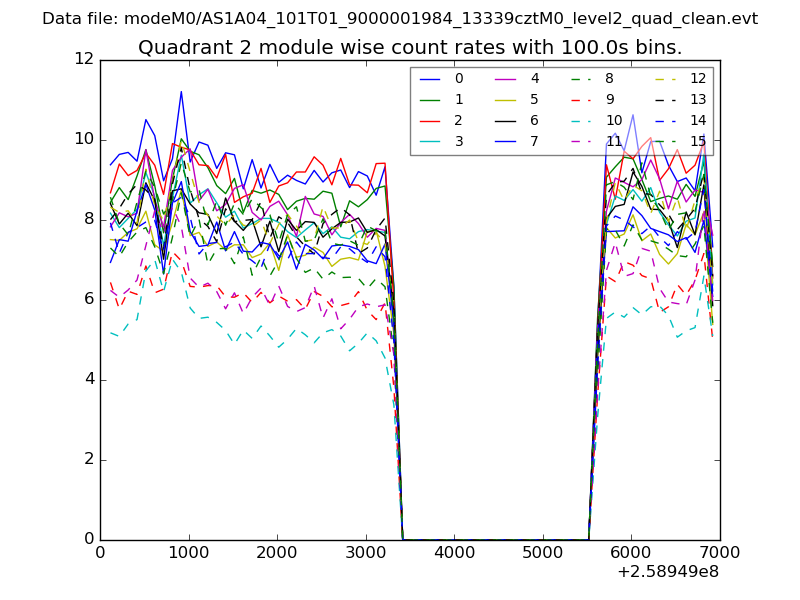
| Module-wise count rates for Quadrant B Data is divided into 100 sec bins |
 |
 |
| Module-wise count rates for Quadrant C Data is divided into 100 sec bins |
 |
 |
| Module-wise count rates for Quadrant D Data is divided into 100 sec bins |
 |
 |
| Parameter | Plot |
|---|---|
| CZT HV Monitor | 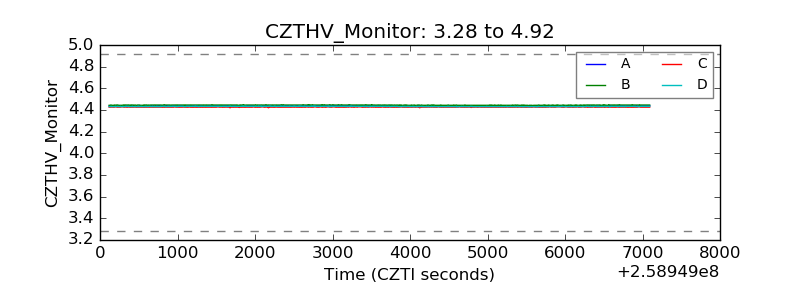 |
| D_VDD | 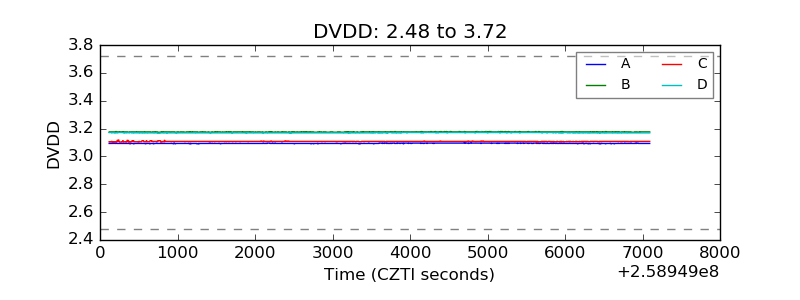 |
| Temperature 1 | 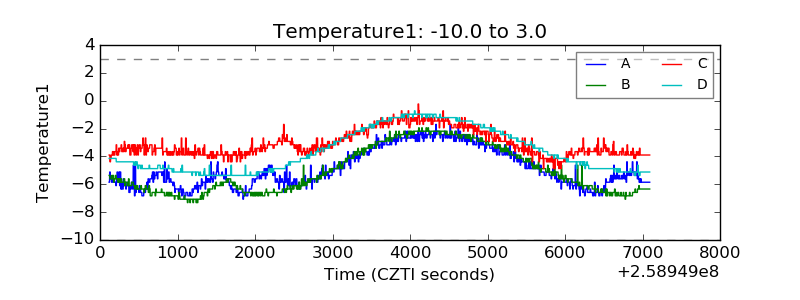 |
| Veto HV Monitor | 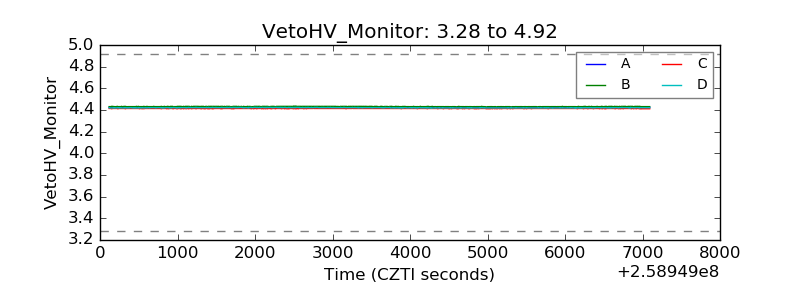 |
| Veto LLD |  |
| Alpha Counter | 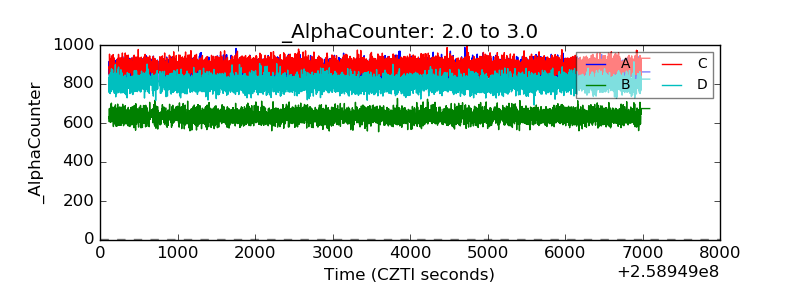 |
| _CPM_Rate | 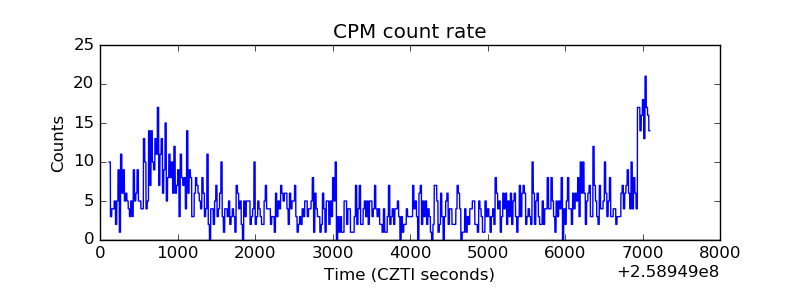 |
| CZT Counter | 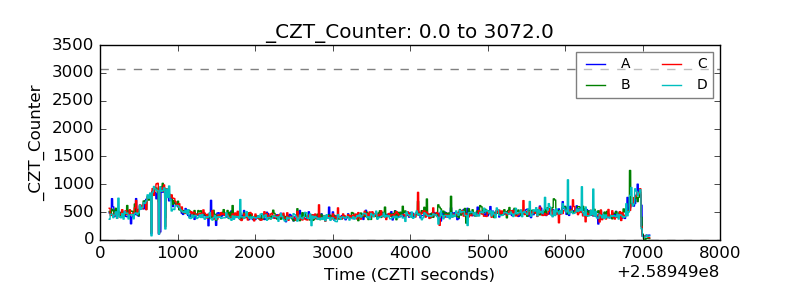 |
| +2.5 Volts monitor |  |
| +5 Volts monitor | 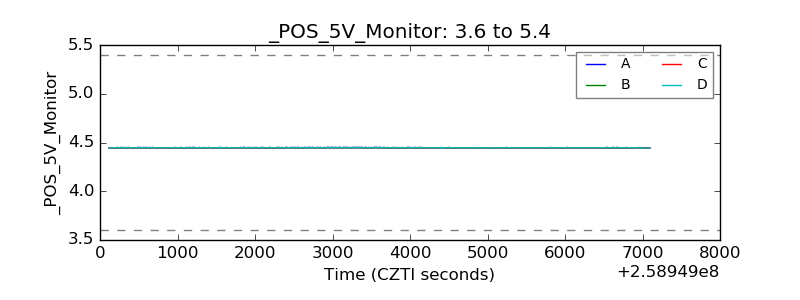 |
| _ROLL_ROT | 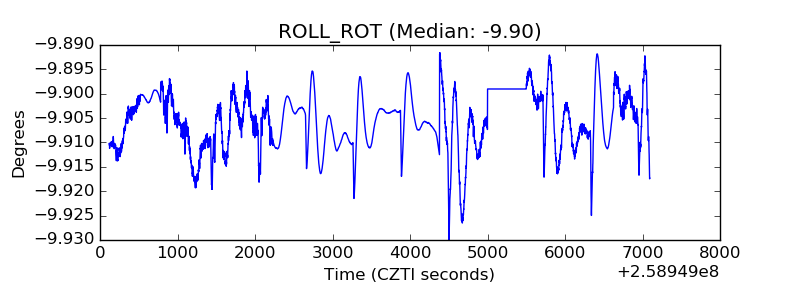 |
| _Roll_DEC | 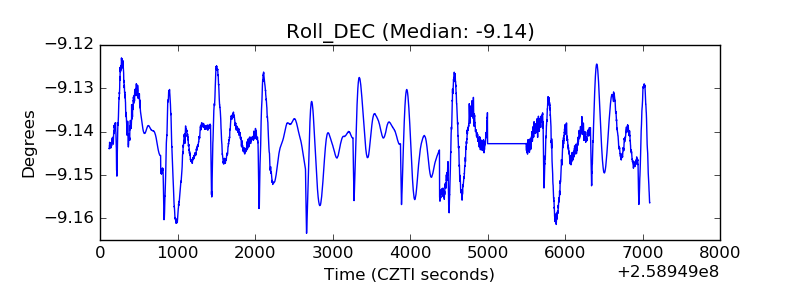 |
| _Roll_RA | 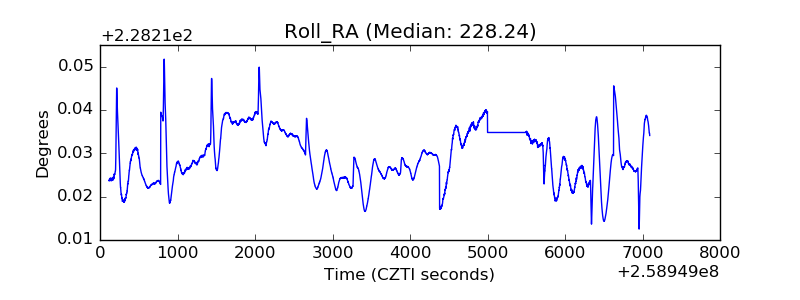 |
| Veto Counter | 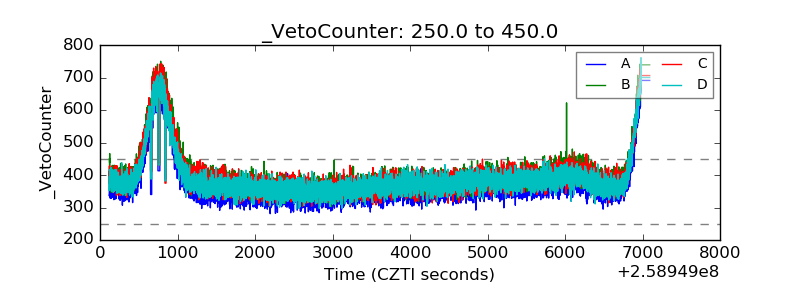 |