| Param | Original file | Final file |
|---|---|---|
| Filename | modeM0/AS1A04_101T01_9000001984_13342cztM0_level2.evt | modeM0/AS1A04_101T01_9000001984_13342cztM0_level2_quad_clean.evt |
| Size (bytes) | 211,570,560 | 20,577,600 |
| Size | 201.8 MB | 19.6 MB |
| Events in quadrant A | 1,463,381 | 100,752 |
| Events in quadrant B | 1,731,151 | 102,845 |
| Events in quadrant C | 1,390,017 | 101,500 |
| Events in quadrant D | 1,610,594 | 96,899 |
| Mode SS | |||
|---|---|---|---|
| Quadrant | BADHDUFLAG | Total packets | Discarded packets |
| A | 0 | 62 | 0 |
| B | 0 | 62 | 0 |
| C | 0 | 62 | 0 |
| D | 0 | 62 | 0 |
| Mode M0 | |||
|---|---|---|---|
| Quadrant | BADHDUFLAG | Total packets | Discarded packets |
| A | 0 | 6379 | 1 |
| B | 0 | 7105 | 0 |
| C | 0 | 6195 | 0 |
| D | 0 | 6879 | 0 |
| Quadrant | Total seconds | Saturated seconds | Saturation percentage |
|---|---|---|---|
| A | 3093 | 17 | 0.549628% |
| B | 3093 | 19 | 0.614290% |
| C | 3093 | 2 | 0.064662% |
| D | 3093 | 17 | 0.549628% |
Noise dominated data is calculated using 1-second bins in cleaned event files. If a bin has >2000 counts, and if more than 50% of those come from <1% of pixels, then it is considered to be noise-dominated and hence unusable.
| Quadrant | # 1 sec bins | Bins with >0 counts | Bins with >2000 counts | High rate bins dominated by noise | Noise dominated (total time) | Noise dominated (detector-on time) | Marked lightcurve |
|---|---|---|---|---|---|---|---|
| A | 3096 | 3095 | 12 | 12 | 0.39% | 0.39% | 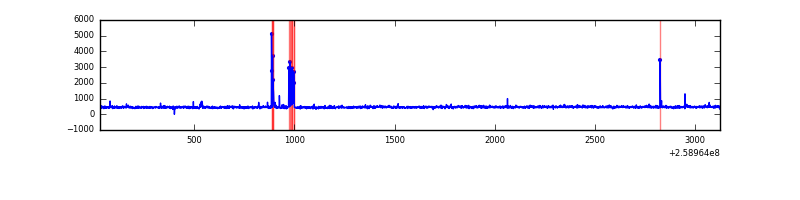 |
| B | 3096 | 3095 | 5 | 5 | 0.16% | 0.16% | 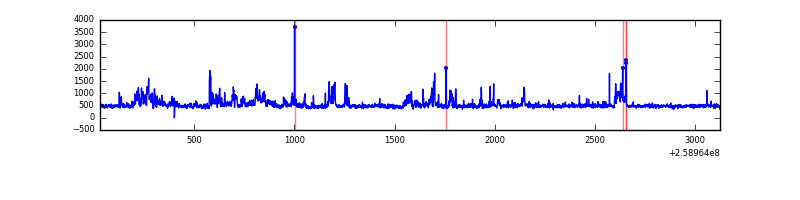 |
| C | 3096 | 3095 | 0 | 0 | 0.00% | 0.00% |  |
| D | 3096 | 3095 | 14 | 14 | 0.45% | 0.45% | 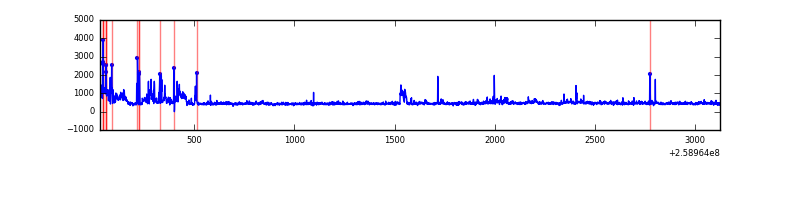 |
Top three noisy pixels from each quadrant. If the there are fewer than three noisy pixels in the level2.evt file, extra rows are filled as -1
| Pixel properties | Quadrant properties | ||||||
|---|---|---|---|---|---|---|---|
| Quadrant | DetID | PixID | Counts | Sigma | Mean | Median | Sigma |
| A | 15 | 69 | 60614 | 803.76 | 357 | 348 | 75.0 |
| A | 8 | 15 | 14715 | 191.61 | 357 | 348 | 75.0 |
| A | 1 | 162 | 7220 | 91.65 | 357 | 348 | 75.0 |
| B | 0 | 219 | 212727 | 2996.96 | 357 | 349 | 70.9 |
| B | 3 | 64 | 52328 | 733.5 | 357 | 349 | 70.9 |
| B | 4 | 142 | 38256 | 534.92 | 357 | 349 | 70.9 |
| C | 3 | 233 | 34063 | 415.13 | 347 | 349 | 81.2 |
| C | 13 | 61 | 2506 | 26.56 | 347 | 349 | 81.2 |
| C | 14 | 234 | 1672 | 16.29 | 347 | 349 | 81.2 |
| D | 1 | 52 | 204256 | 2374.84 | 347 | 336 | 85.9 |
| D | 5 | 222 | 36912 | 425.96 | 347 | 336 | 85.9 |
| D | 8 | 195 | 28925 | 332.95 | 347 | 336 | 85.9 |
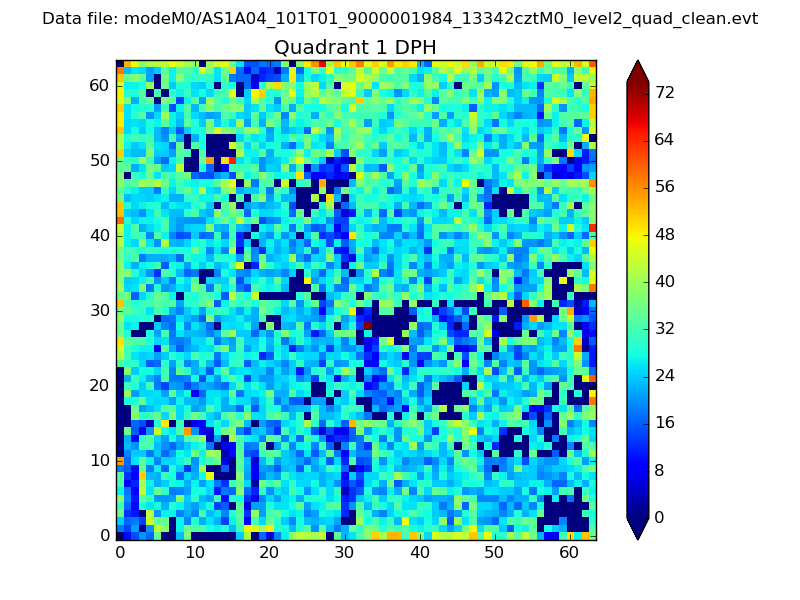
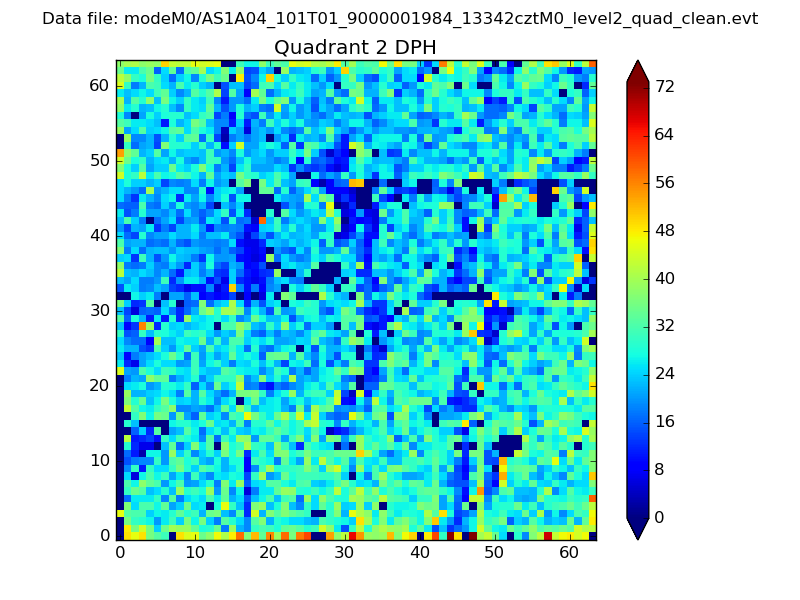
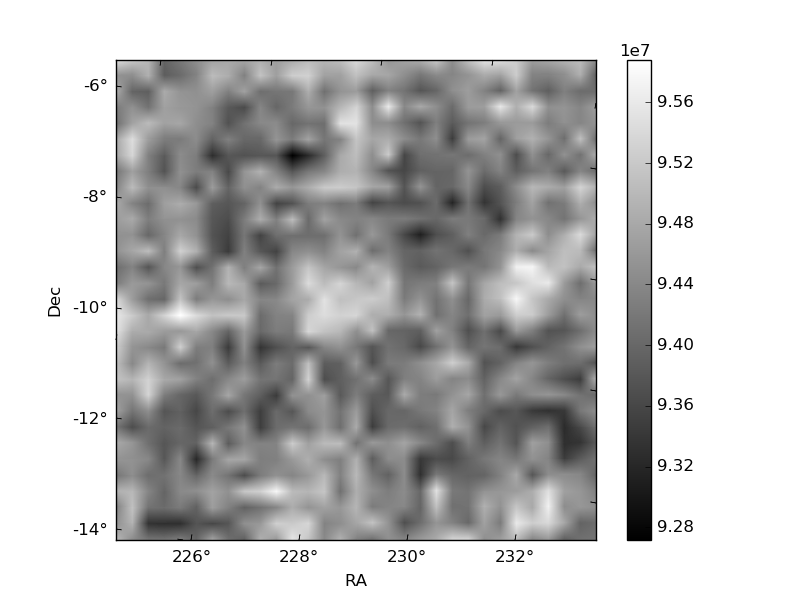
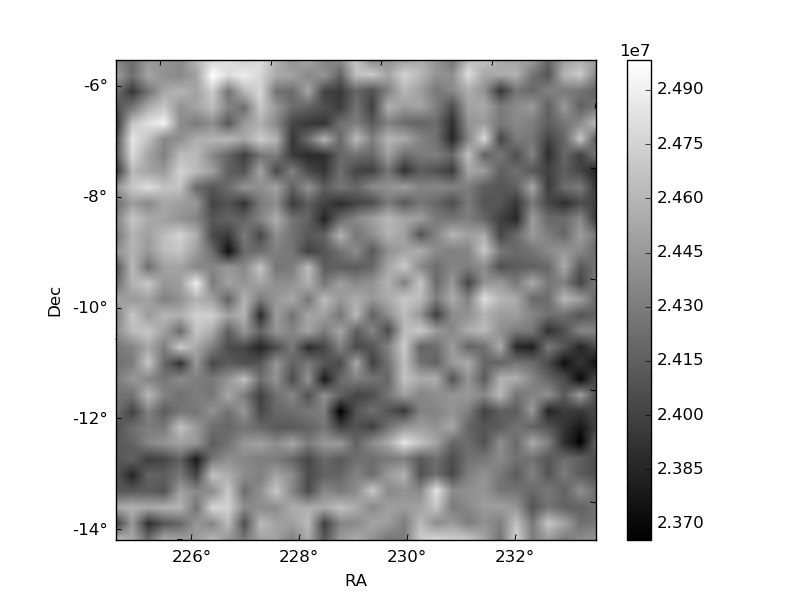
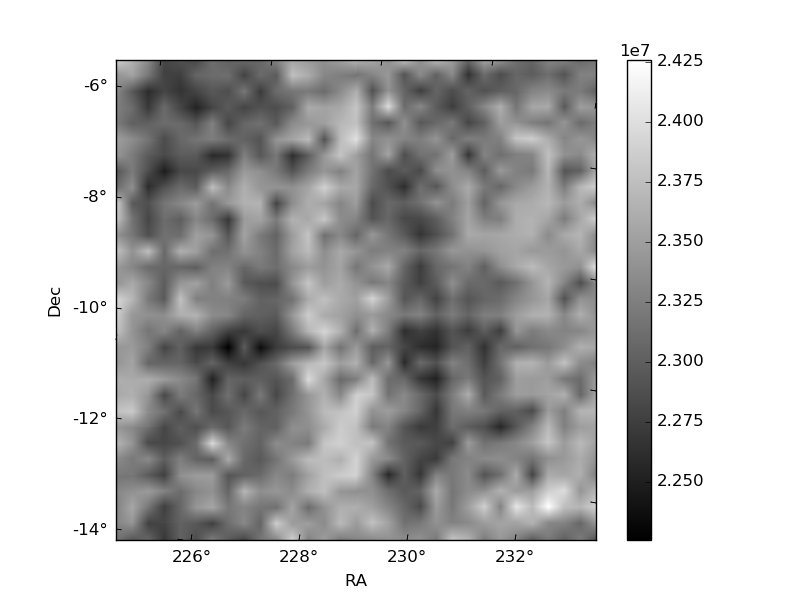
Histogram calculated using DETX and DETY for each event in the final _common_clean file
| Quadrant A | 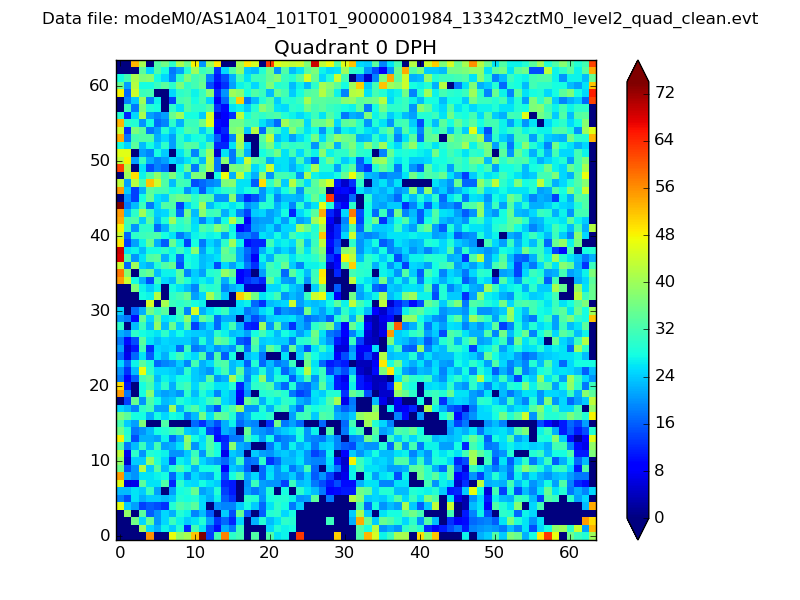 |
 |
Quadrant B |
|---|---|---|---|
| Quadrant D | 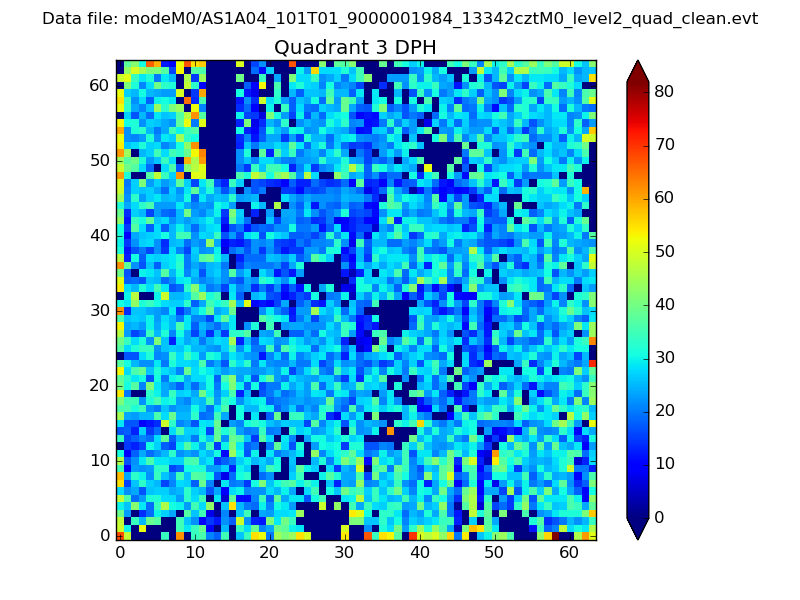 |
 |
Quadrant C |
| Plot type | Count rate plots | Images |
|---|---|---|
| Comparison with Poisson distribution Blue bars denote a histogram of data divided into 1 sec bins. Red curve is a Poisson curve with rate = median count rate of data. |
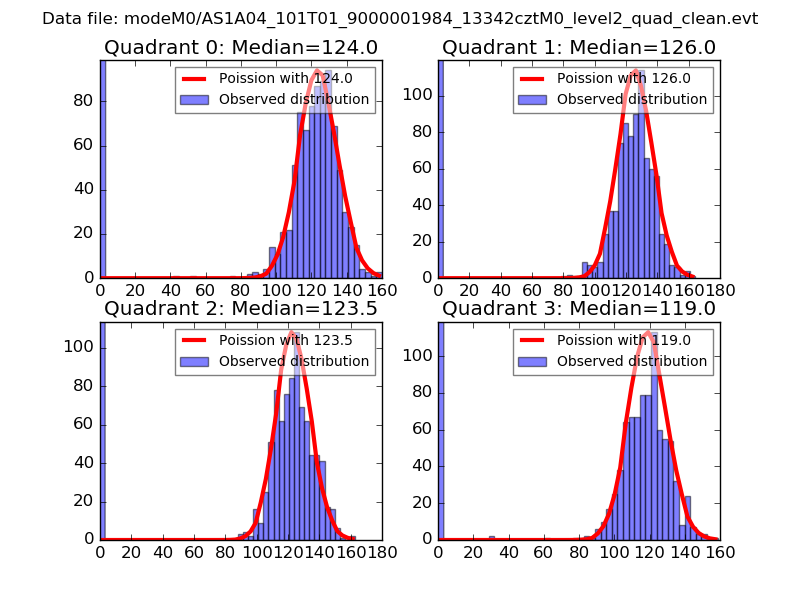 |
 |
| Quadrant-wise count rates Data is divided into 100 sec bins |
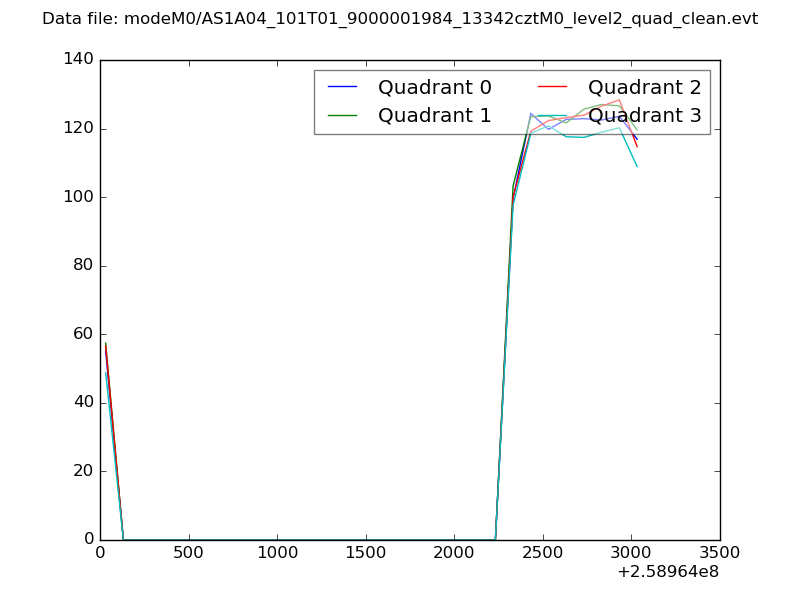 |
|
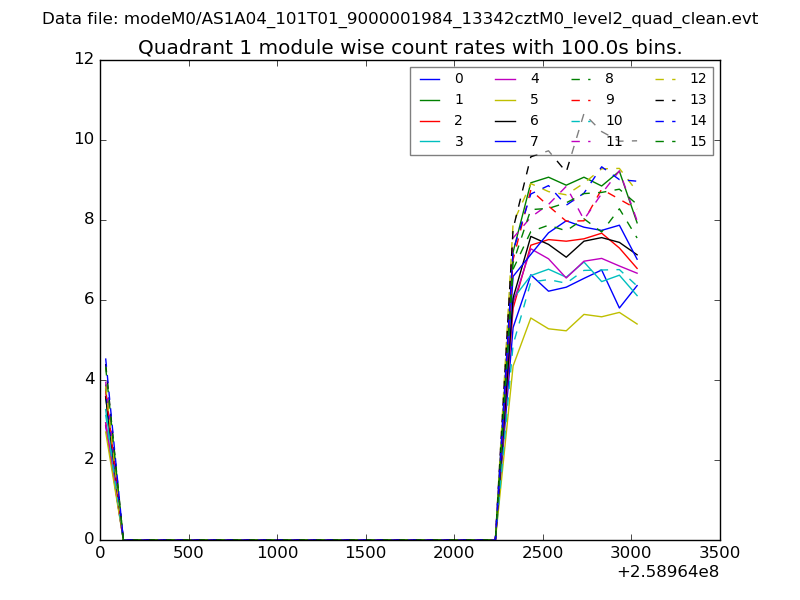
| Module-wise count rates for Quadrant A Data is divided into 100 sec bins |
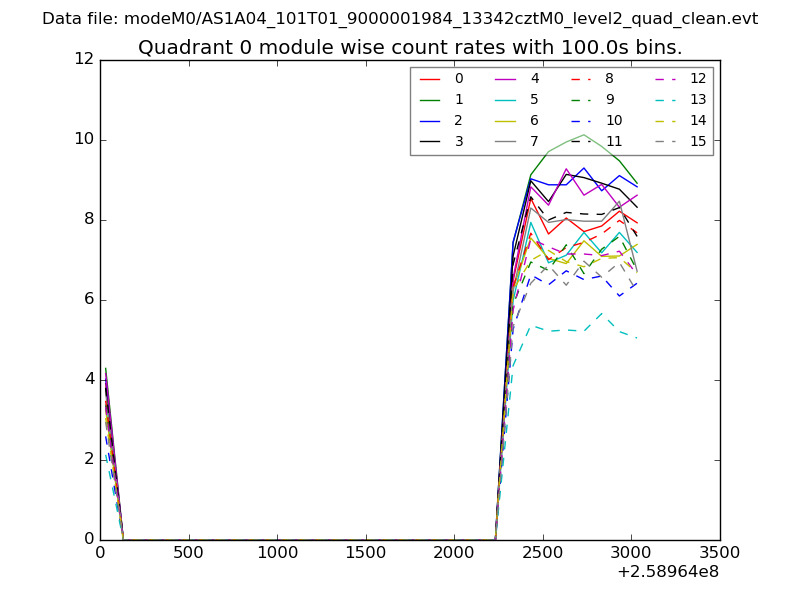 |
 |
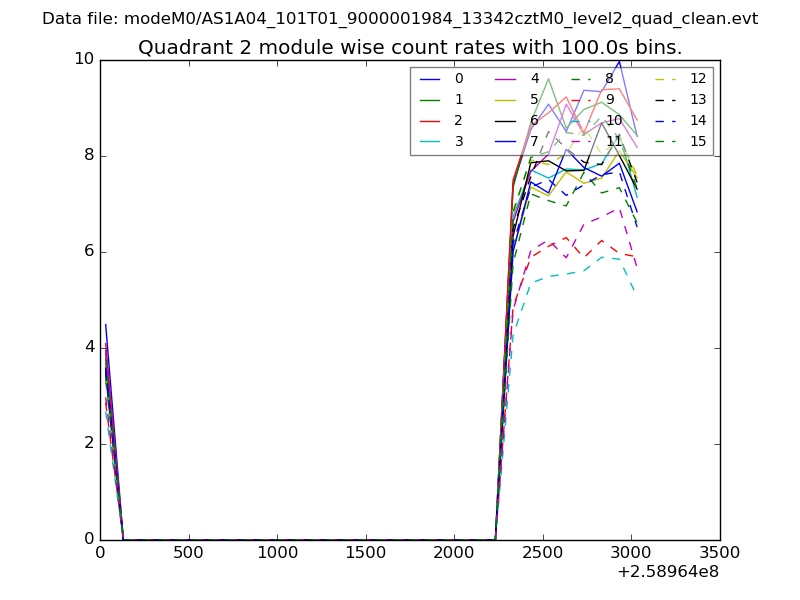
| Module-wise count rates for Quadrant B Data is divided into 100 sec bins |
 |
 |
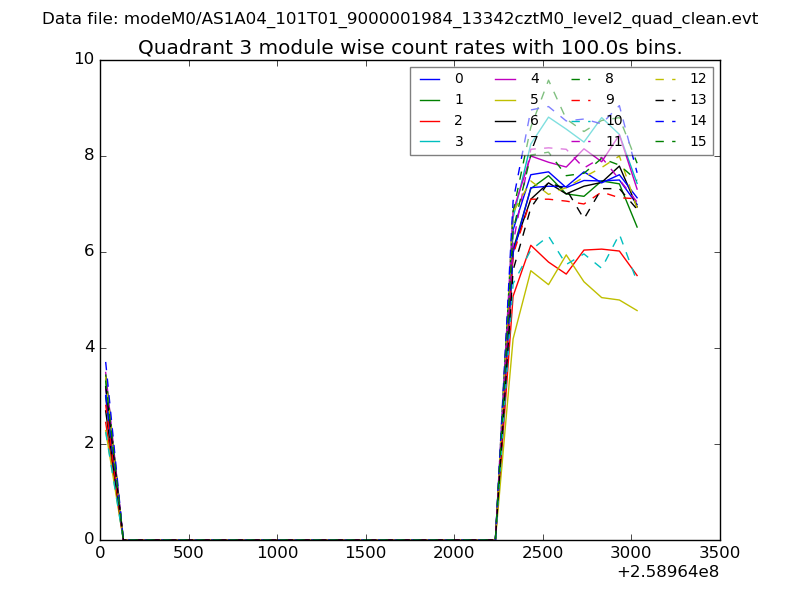
| Module-wise count rates for Quadrant C Data is divided into 100 sec bins |
 |
 |
| Module-wise count rates for Quadrant D Data is divided into 100 sec bins |
 |
 |
| Parameter | Plot |
|---|---|
| CZT HV Monitor | 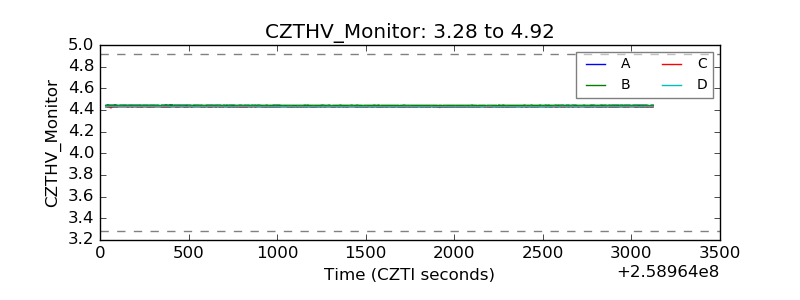 |
| D_VDD | 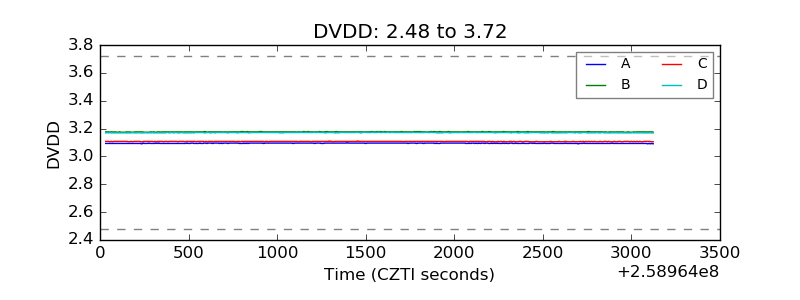 |
| Temperature 1 | 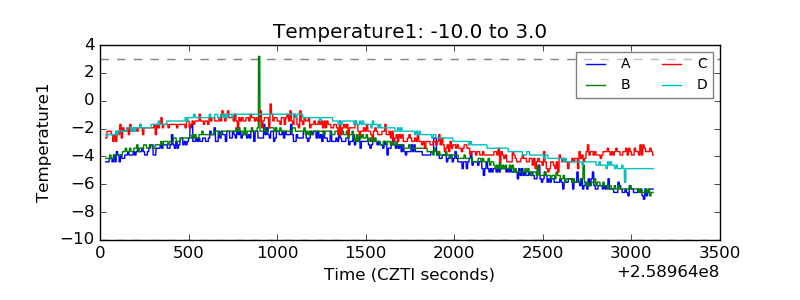 |
| Veto HV Monitor |  |
| Veto LLD | 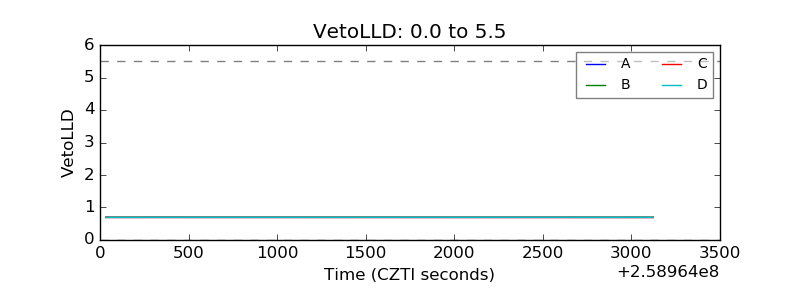 |
| Alpha Counter | 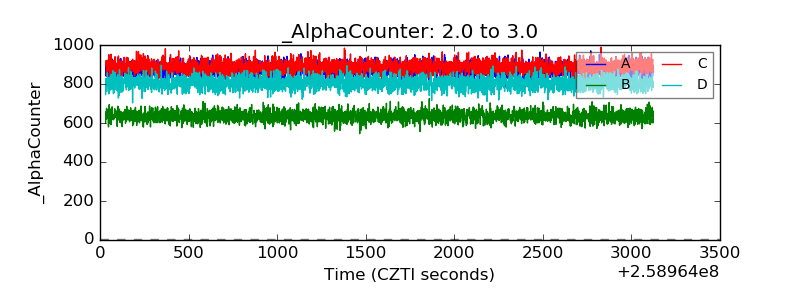 |
| _CPM_Rate | 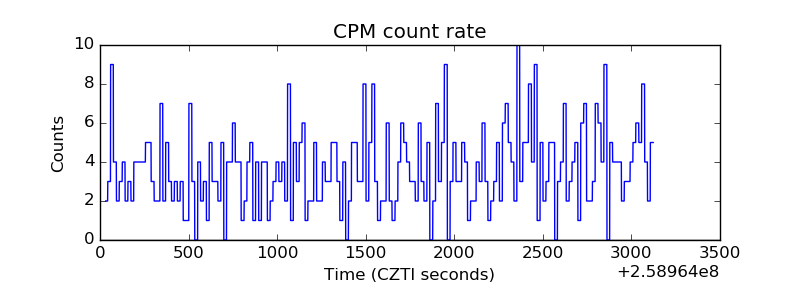 |
| CZT Counter | 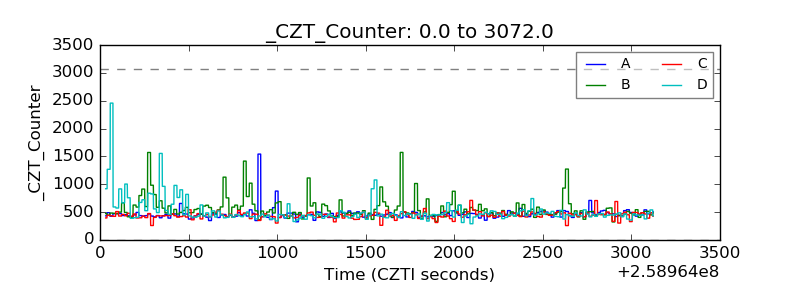 |
| +2.5 Volts monitor |  |
| +5 Volts monitor | 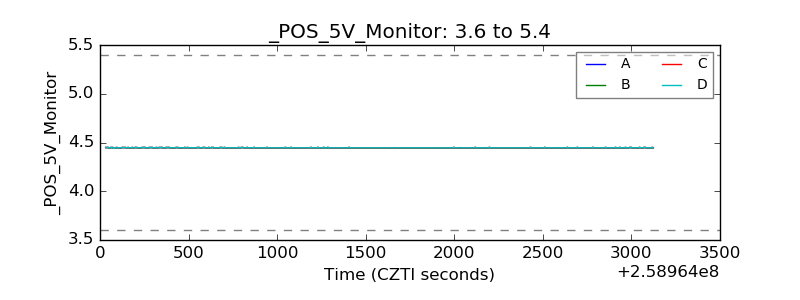 |
| _ROLL_ROT | 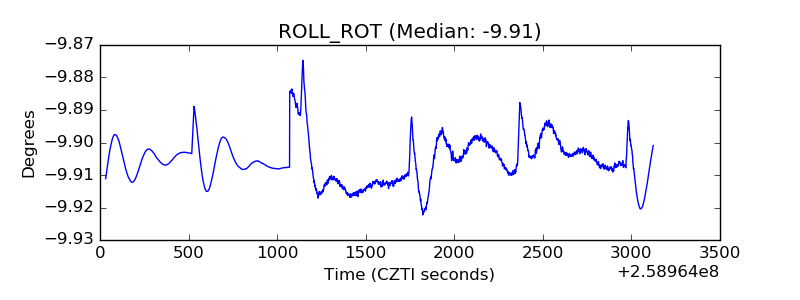 |
| _Roll_DEC | 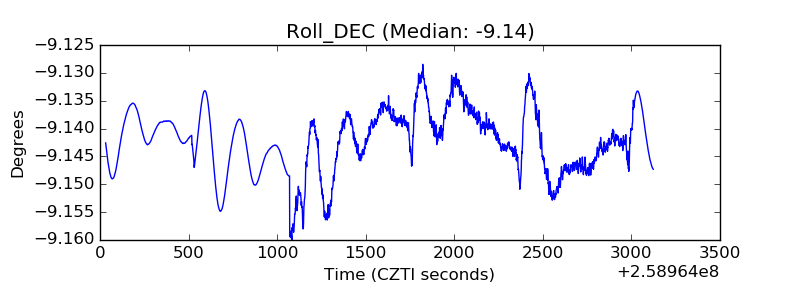 |
| _Roll_RA | 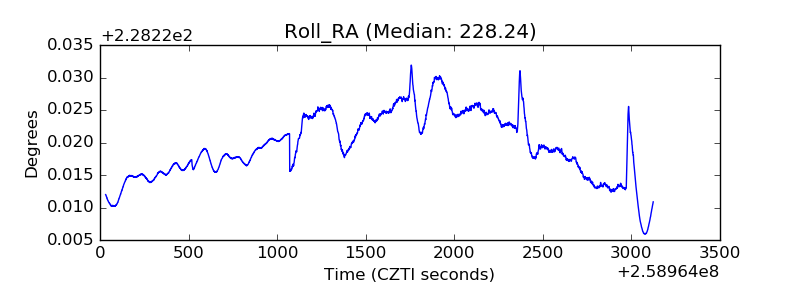 |
| Veto Counter | 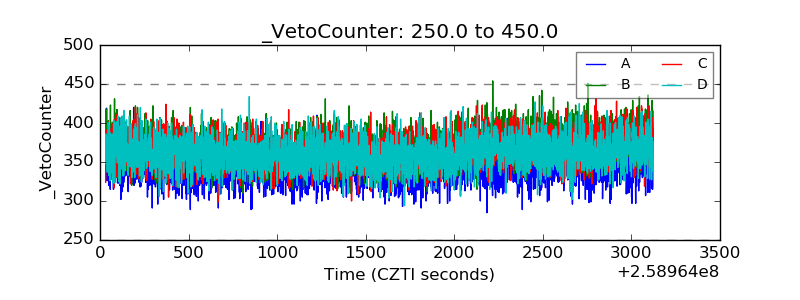 |