| Param | Original file | Final file |
|---|---|---|
| Filename | modeM0/AS1A04_196T04_9000001982cztM0_level2.fits | modeM0/AS1A04_196T04_9000001982cztM0_level2_quad_clean.evt |
| Size (bytes) | 56,433,600 | 50,028,480 |
| Size | 53.8 MB | 47.7 MB |
| Events in quadrant A | 346,912 | 286,064 |
| Events in quadrant B | 337,312 | 293,086 |
| Events in quadrant C | 345,140 | 289,355 |
| Events in quadrant D | 298,598 | 264,317 |
| Mode M9 | |||
|---|---|---|---|
| Quadrant | BADHDUFLAG | Total packets | Discarded packets |
| A | 0 | 14 | 0 |
| B | 0 | 14 | 0 |
| C | 0 | 14 | 0 |
| D | 0 | 14 | 0 |
| Mode SS | |||
|---|---|---|---|
| Quadrant | BADHDUFLAG | Total packets | Discarded packets |
| A | 0 | 112 | 0 |
| B | 0 | 112 | 0 |
| C | 0 | 112 | 0 |
| D | 0 | 112 | 0 |
| Mode M0 | |||
|---|---|---|---|
| Quadrant | BADHDUFLAG | Total packets | Discarded packets |
| A | 0 | 12138 | 0 |
| B | 0 | 11840 | 0 |
| C | 0 | 11523 | 0 |
| D | 0 | 12045 | 0 |
| Quadrant | Total seconds | Saturated seconds | Saturation percentage |
|---|---|---|---|
| A | 5445 | 25 | 0.459137% |
| B | 5445 | 27 | 0.495868% |
| C | 5445 | 14 | 0.257117% |
| D | 5445 | 35 | 0.642792% |
Noise dominated data is calculated using 1-second bins in cleaned event files. If a bin has >2000 counts, and if more than 50% of those come from <1% of pixels, then it is considered to be noise-dominated and hence unusable.
| Quadrant | # 1 sec bins | Bins with >0 counts | Bins with >2000 counts | High rate bins dominated by noise | Noise dominated (total time) | Noise dominated (detector-on time) | Marked lightcurve |
|---|---|---|---|---|---|---|---|
| A | 6860 | 5445 | 0 | 0 | 0.00% | 0.00% |  |
| B | 6860 | 5445 | 0 | 0 | 0.00% | 0.00% |  |
| C | 6860 | 5445 | 0 | 0 | 0.00% | 0.00% |  |
| D | 6860 | 5445 | 0 | 0 | 0.00% | 0.00% | 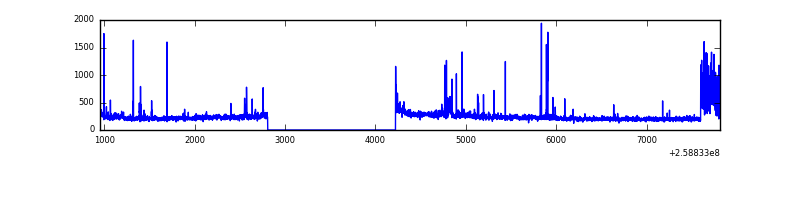 |
Top three noisy pixels from each quadrant. If the there are fewer than three noisy pixels in the level2.evt file, extra rows are filled as -1
| Pixel properties | Quadrant properties | ||||||
|---|---|---|---|---|---|---|---|
| Quadrant | DetID | PixID | Counts | Sigma | Mean | Median | Sigma |
| A | 14 | 188 | 337 | 10.31 | 90 | 85 | 24.4 |
| A | 0 | 29 | 319 | 9.58 | 90 | 85 | 24.4 |
| A | 14 | 204 | 295 | 8.59 | 90 | 85 | 24.4 |
| B | 2 | 9 | 274 | 9.46 | 89 | 85 | 20.0 |
| B | 3 | 17 | 236 | 7.56 | 89 | 85 | 20.0 |
| B | 12 | 226 | 217 | 6.61 | 89 | 85 | 20.0 |
| C | 12 | 242 | 243 | 6.26 | 91 | 86 | 25.1 |
| C | 3 | 126 | 237 | 6.02 | 91 | 86 | 25.1 |
| C | 12 | 241 | 234 | 5.9 | 91 | 86 | 25.1 |
| D | 4 | 246 | 234 | 6.41 | 85 | 78 | 24.3 |
| D | 6 | 8 | 222 | 5.92 | 85 | 78 | 24.3 |
| D | 10 | 189 | 220 | 5.83 | 85 | 78 | 24.3 |
Histogram calculated using DETX and DETY for each event in the final _common_clean file
| Quadrant A |  |
 |
Quadrant B |
|---|---|---|---|
| Quadrant D |  |
 |
Quadrant C |
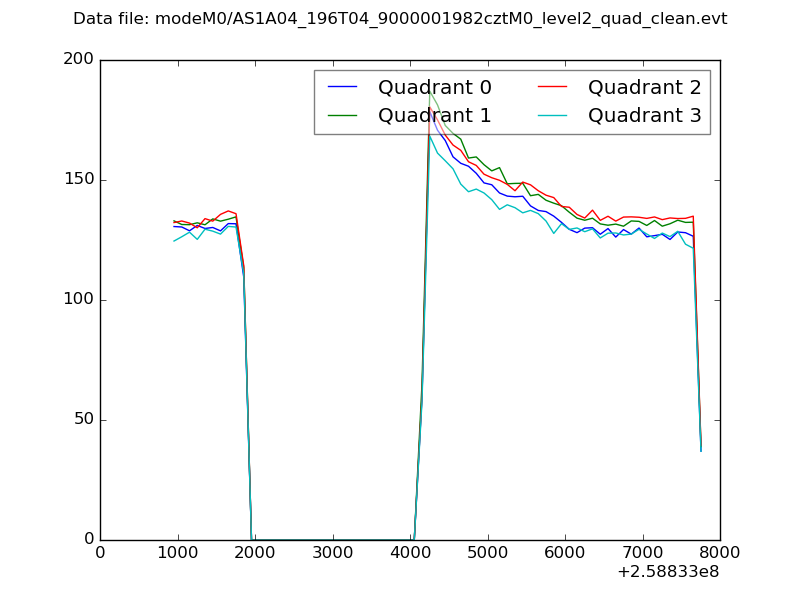
| Plot type | Count rate plots | Images |
|---|---|---|
| Comparison with Poisson distribution Blue bars denote a histogram of data divided into 1 sec bins. Red curve is a Poisson curve with rate = median count rate of data. |
 |
 |
| Quadrant-wise count rates Data is divided into 100 sec bins |
 |
|
| Module-wise count rates for Quadrant A Data is divided into 100 sec bins |
 |
 |
| Module-wise count rates for Quadrant B Data is divided into 100 sec bins |
 |
 |
| Module-wise count rates for Quadrant C Data is divided into 100 sec bins |
 |
 |
| Module-wise count rates for Quadrant D Data is divided into 100 sec bins |
 |
 |
| Parameter | Plot |
|---|---|
| CZT HV Monitor |  |
| D_VDD | 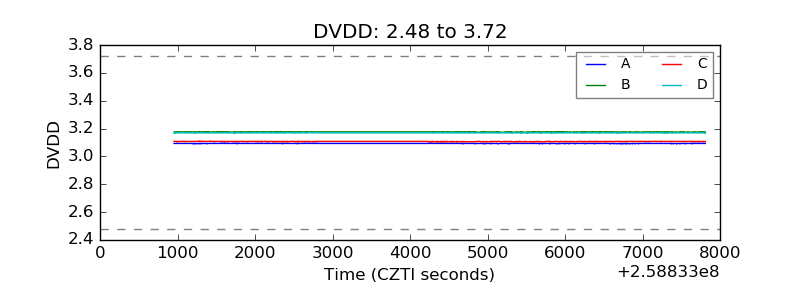 |
| Temperature 1 |  |
| Veto HV Monitor |  |
| Veto LLD |  |
| Alpha Counter |  |
| _CPM_Rate |  |
| CZT Counter |  |
| +2.5 Volts monitor |  |
| +5 Volts monitor |  |
| _ROLL_ROT | 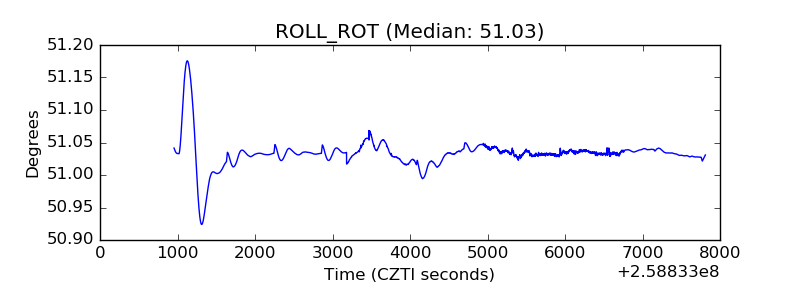 |
| _Roll_DEC |  |
| _Roll_RA |  |
| Veto Counter |  |