| Param | Original file | Final file |
|---|---|---|
| Filename | modeM0/AS1A04_196T04_9000001982_13316cztM0_level2.evt | modeM0/AS1A04_196T04_9000001982_13316cztM0_level2_quad_clean.evt |
| Size (bytes) | 232,159,680 | 51,304,320 |
| Size | 221.4 MB | 48.9 MB |
| Events in quadrant A | 1,746,808 | 329,844 |
| Events in quadrant B | 1,760,064 | 342,075 |
| Events in quadrant C | 1,658,880 | 338,064 |
| Events in quadrant D | 1,649,264 | 319,076 |
| Mode M9 | |||
|---|---|---|---|
| Quadrant | BADHDUFLAG | Total packets | Discarded packets |
| A | 0 | 14 | 0 |
| B | 0 | 14 | 0 |
| C | 0 | 14 | 0 |
| D | 0 | 14 | 0 |
| Mode SS | |||
|---|---|---|---|
| Quadrant | BADHDUFLAG | Total packets | Discarded packets |
| A | 0 | 66 | 0 |
| B | 0 | 66 | 0 |
| C | 0 | 66 | 0 |
| D | 0 | 66 | 0 |
| Mode M0 | |||
|---|---|---|---|
| Quadrant | BADHDUFLAG | Total packets | Discarded packets |
| A | 0 | 7250 | 2 |
| B | 0 | 7217 | 1 |
| C | 0 | 6925 | 1 |
| D | 0 | 6920 | 1 |
| Quadrant | Total seconds | Saturated seconds | Saturation percentage |
|---|---|---|---|
| A | 3150 | 24 | 0.761905% |
| B | 3150 | 24 | 0.761905% |
| C | 3150 | 13 | 0.412698% |
| D | 3150 | 16 | 0.507937% |
Noise dominated data is calculated using 1-second bins in cleaned event files. If a bin has >2000 counts, and if more than 50% of those come from <1% of pixels, then it is considered to be noise-dominated and hence unusable.
| Quadrant | # 1 sec bins | Bins with >0 counts | Bins with >2000 counts | High rate bins dominated by noise | Noise dominated (total time) | Noise dominated (detector-on time) | Marked lightcurve |
|---|---|---|---|---|---|---|---|
| A | 4566 | 3152 | 0 | 0 | 0.00% | 0.00% | 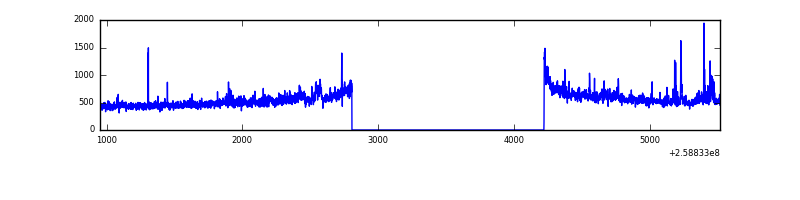 |
| B | 4566 | 3152 | 0 | 0 | 0.00% | 0.00% | 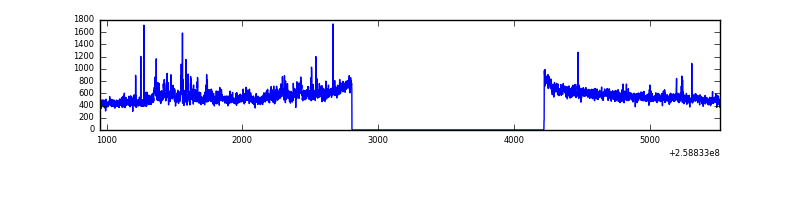 |
| C | 4566 | 3152 | 3 | 3 | 0.07% | 0.10% | 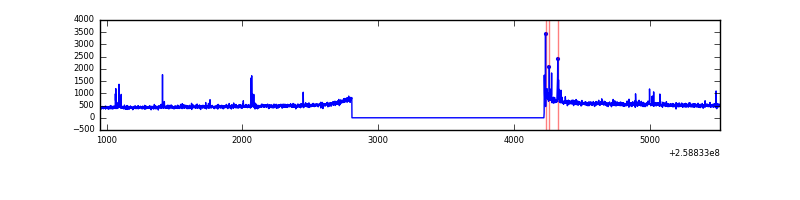 |
| D | 4566 | 3152 | 2 | 2 | 0.04% | 0.06% | 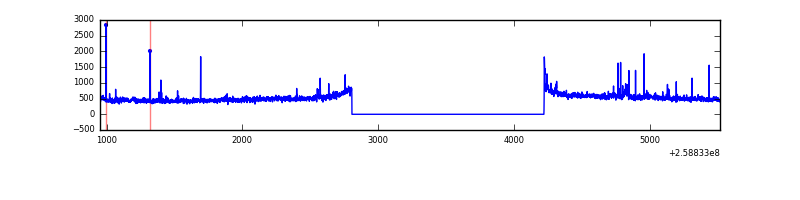 |
Top three noisy pixels from each quadrant. If the there are fewer than three noisy pixels in the level2.evt file, extra rows are filled as -1
| Pixel properties | Quadrant properties | ||||||
|---|---|---|---|---|---|---|---|
| Quadrant | DetID | PixID | Counts | Sigma | Mean | Median | Sigma |
| A | 8 | 15 | 117442 | 1369.87 | 418 | 410 | 85.4 |
| A | 1 | 162 | 6585 | 72.27 | 418 | 410 | 85.4 |
| A | 15 | 69 | 6104 | 66.64 | 418 | 410 | 85.4 |
| B | 0 | 244 | 92682 | 1143.17 | 420 | 410 | 80.7 |
| B | 0 | 214 | 11974 | 143.27 | 420 | 410 | 80.7 |
| B | 12 | 111 | 9142 | 108.18 | 420 | 410 | 80.7 |
| C | 6 | 96 | 39188 | 407.3 | 410 | 413 | 95.2 |
| C | 14 | 234 | 17276 | 177.13 | 410 | 413 | 95.2 |
| C | 13 | 61 | 2910 | 26.23 | 410 | 413 | 95.2 |
| D | 8 | 195 | 52374 | 527.26 | 407 | 397 | 98.6 |
| D | 14 | 35 | 25891 | 258.62 | 407 | 397 | 98.6 |
| D | 5 | 222 | 11179 | 109.37 | 407 | 397 | 98.6 |
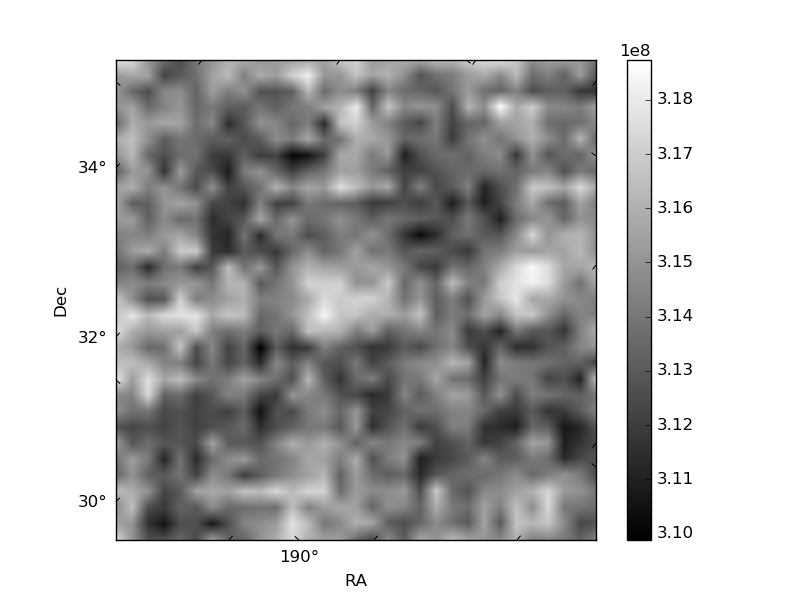
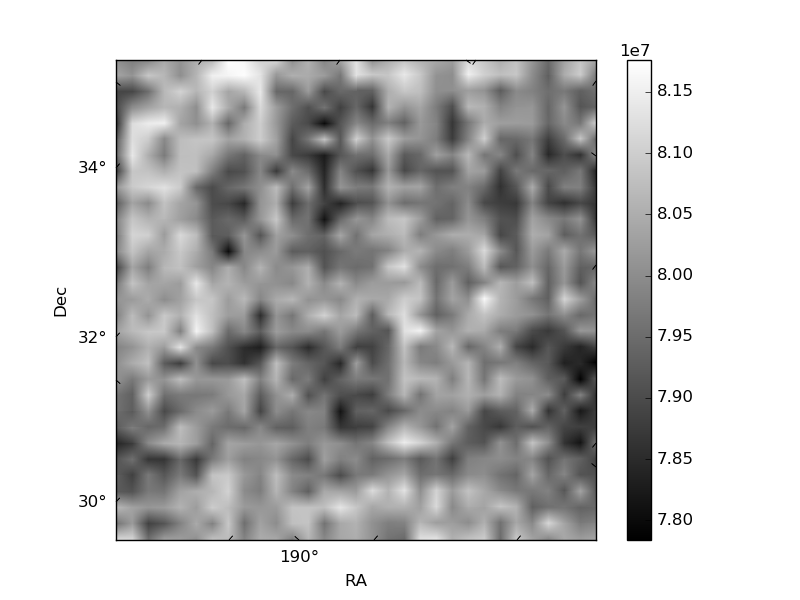
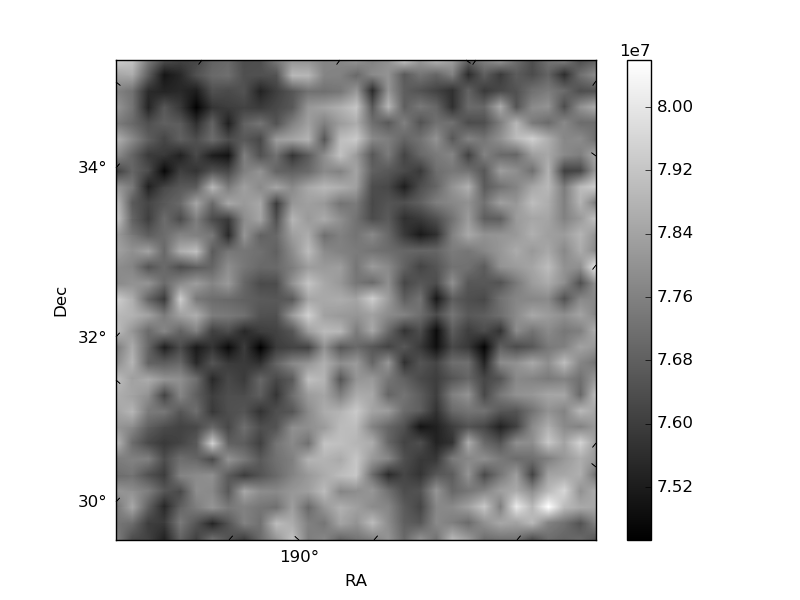
Histogram calculated using DETX and DETY for each event in the final _common_clean file
| Quadrant A | 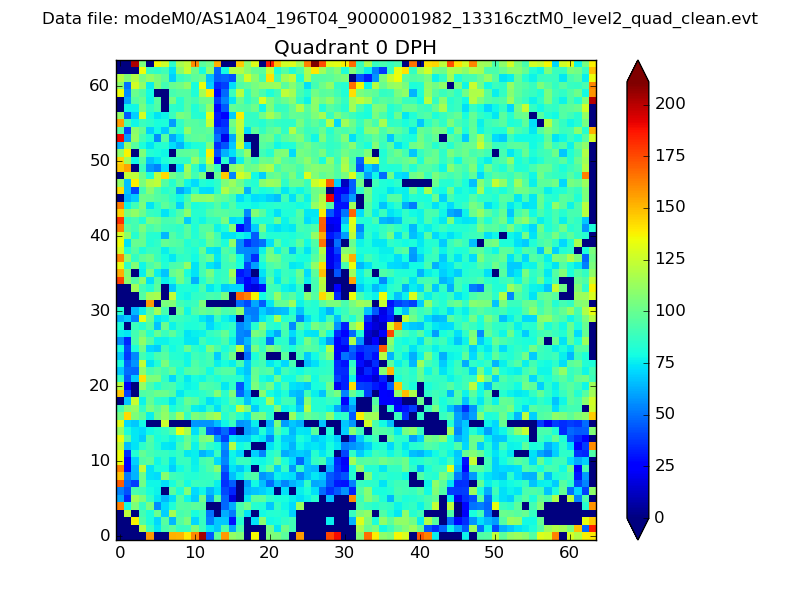 |
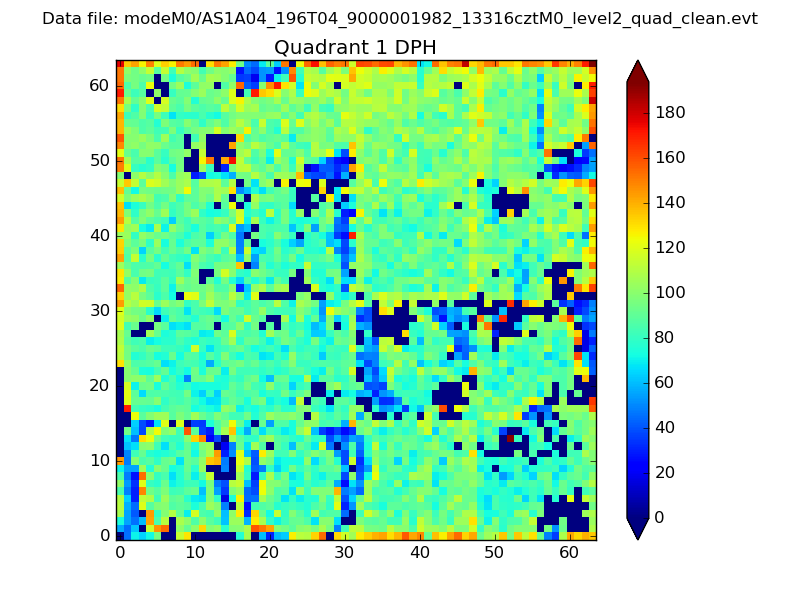 |
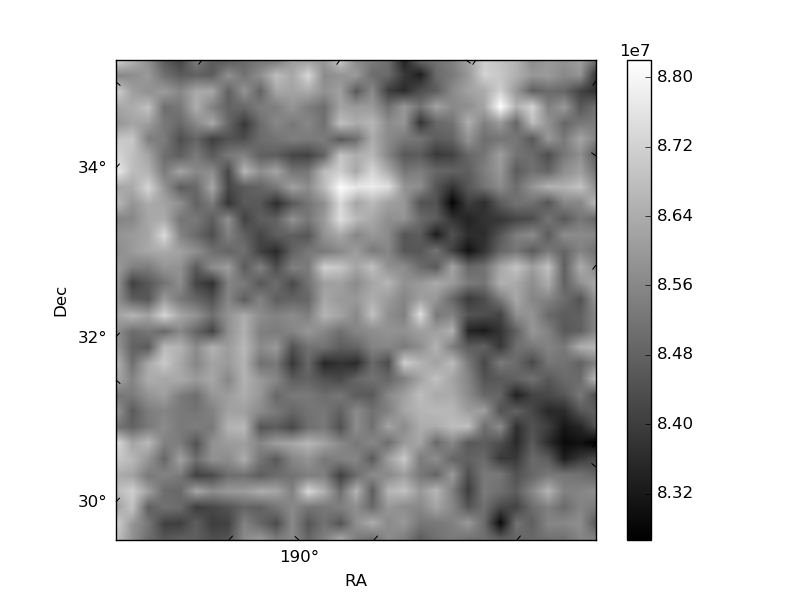
Quadrant B |
|---|---|---|---|
| Quadrant D | 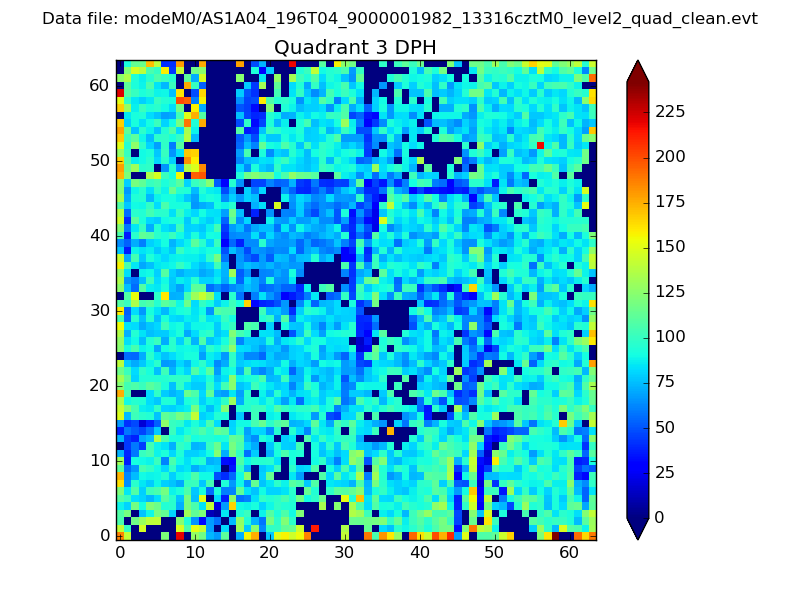 |
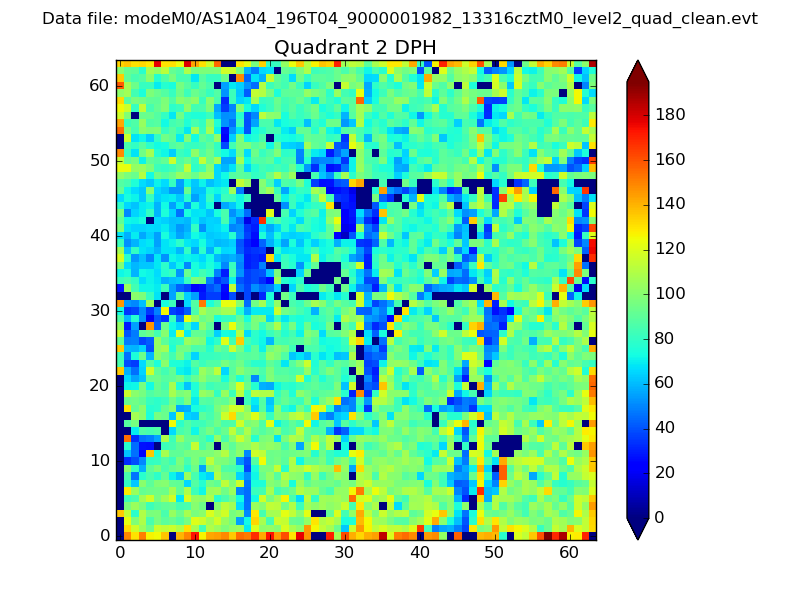 |
Quadrant C |
| Plot type | Count rate plots | Images |
|---|---|---|
| Comparison with Poisson distribution Blue bars denote a histogram of data divided into 1 sec bins. Red curve is a Poisson curve with rate = median count rate of data. |
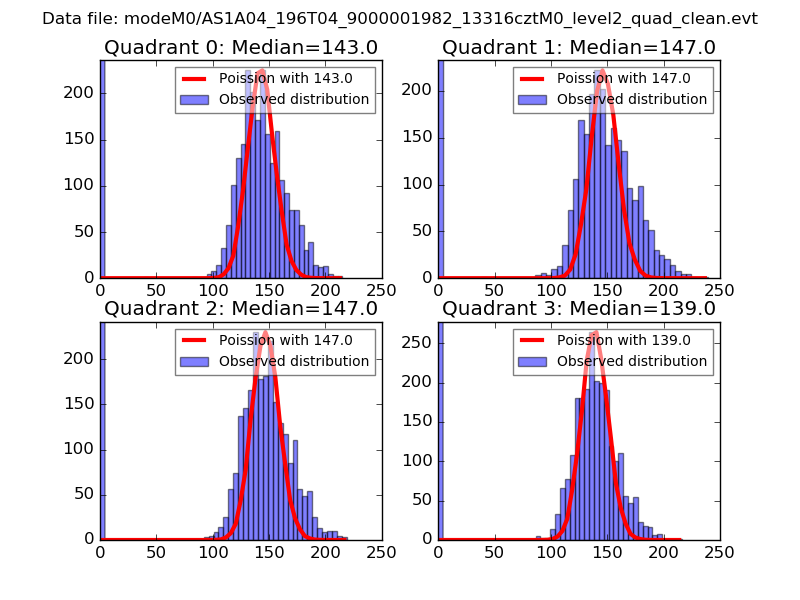 |
 |
| Quadrant-wise count rates Data is divided into 100 sec bins |
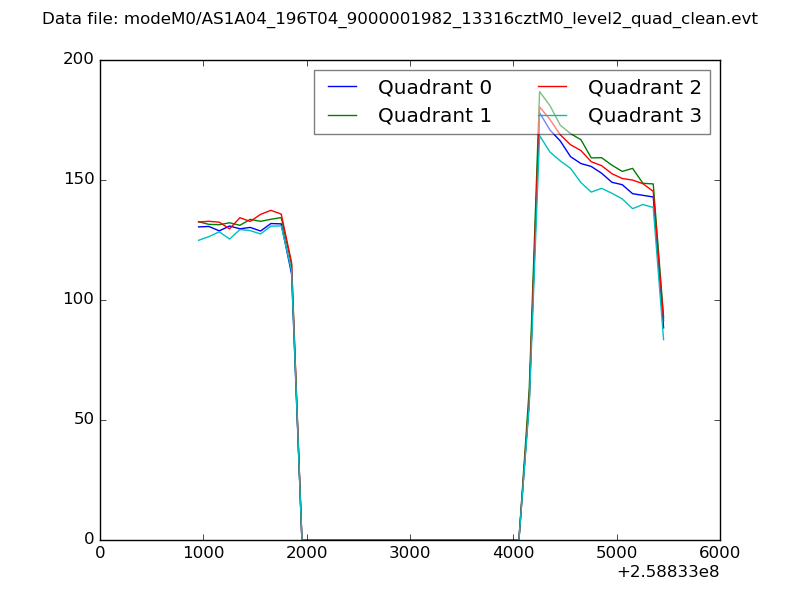 |
|
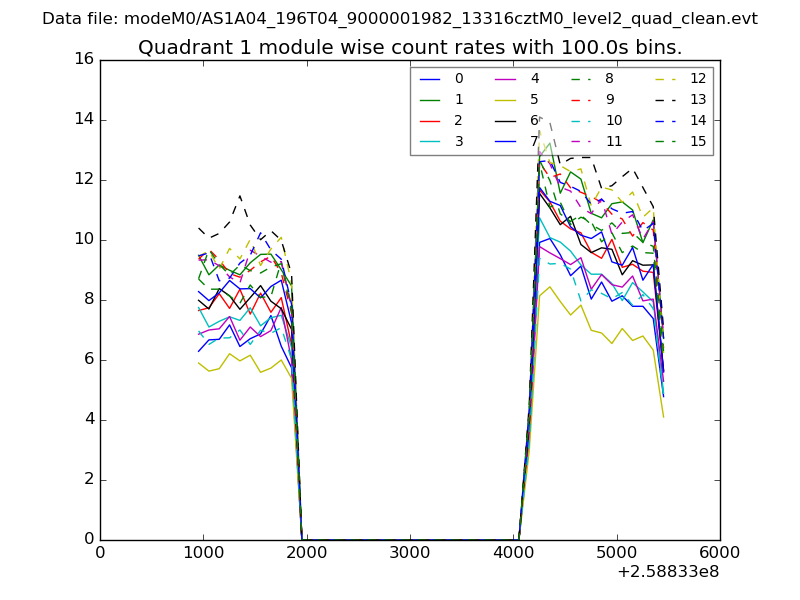
| Module-wise count rates for Quadrant A Data is divided into 100 sec bins |
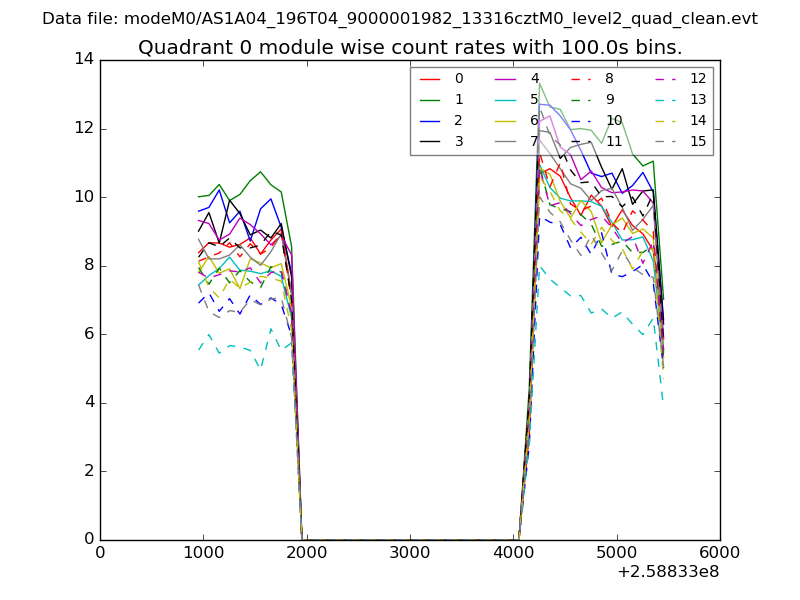 |
 |
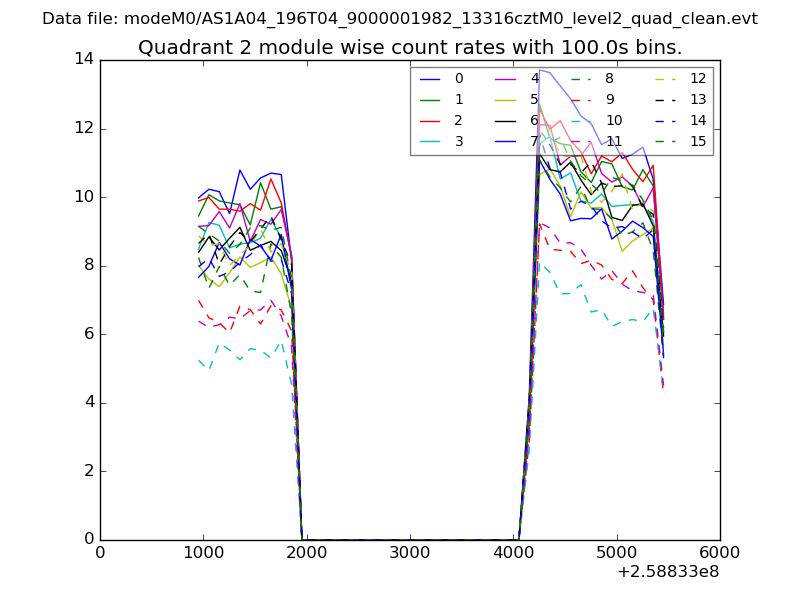
| Module-wise count rates for Quadrant B Data is divided into 100 sec bins |
 |
 |
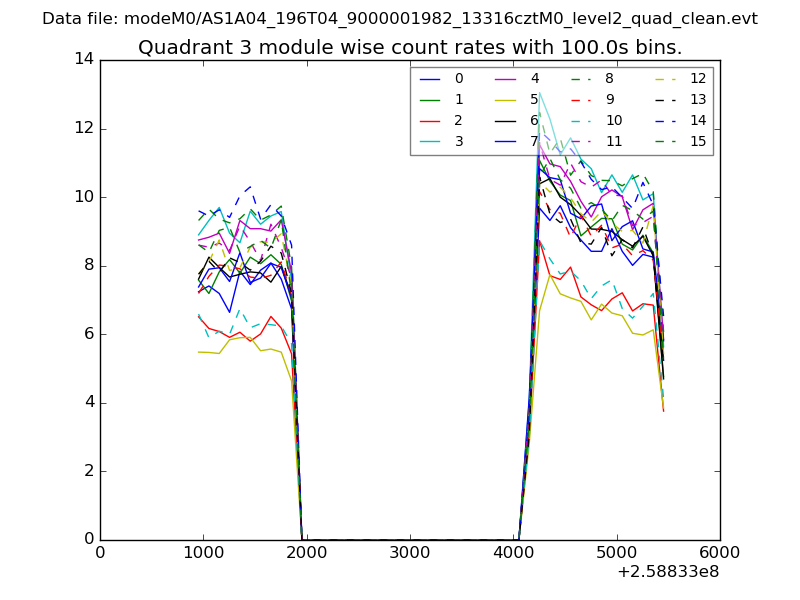
| Module-wise count rates for Quadrant C Data is divided into 100 sec bins |
 |
 |
| Module-wise count rates for Quadrant D Data is divided into 100 sec bins |
 |
 |
| Parameter | Plot |
|---|---|
| CZT HV Monitor | 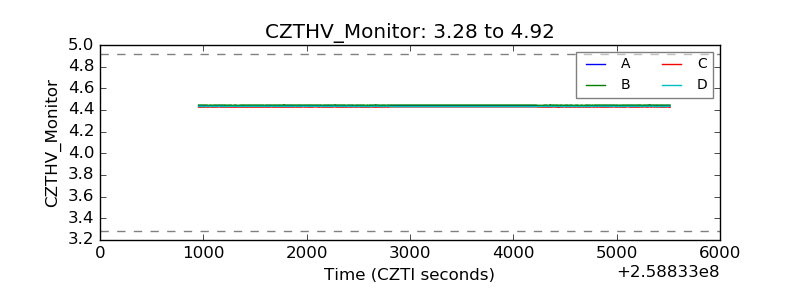 |
| D_VDD | 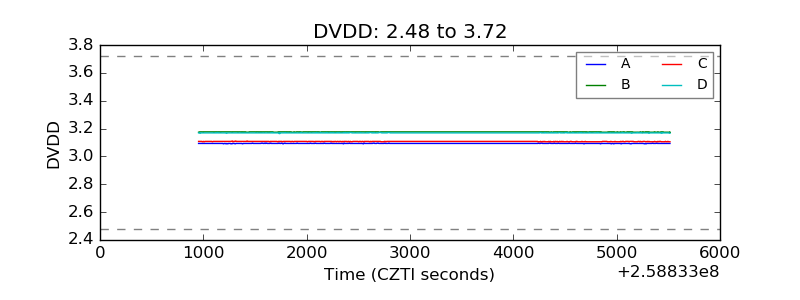 |
| Temperature 1 | 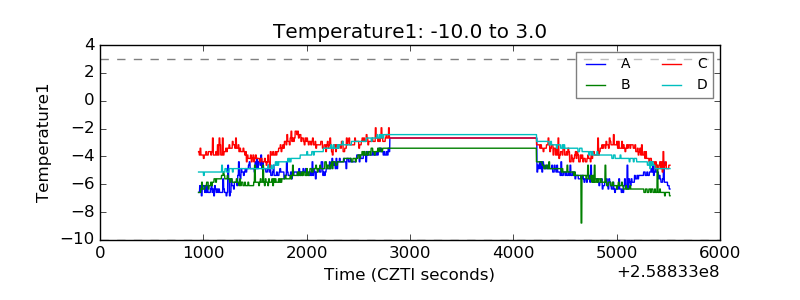 |
| Veto HV Monitor | 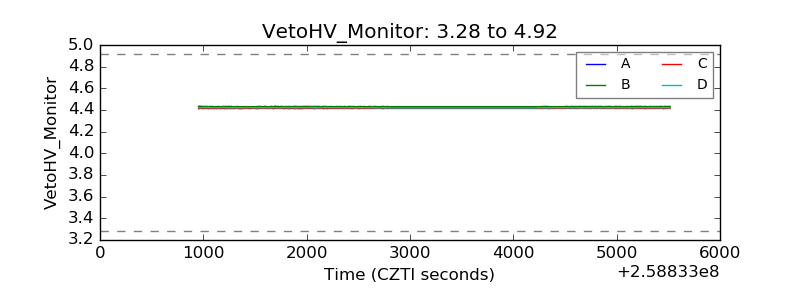 |
| Veto LLD | 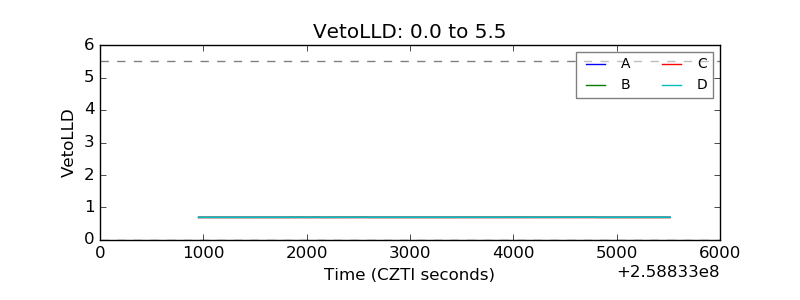 |
| Alpha Counter | 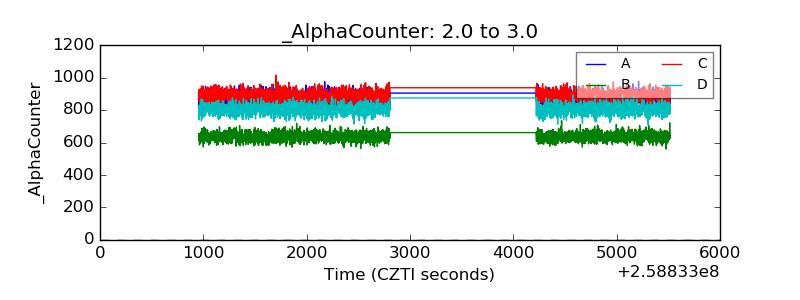 |
| _CPM_Rate | 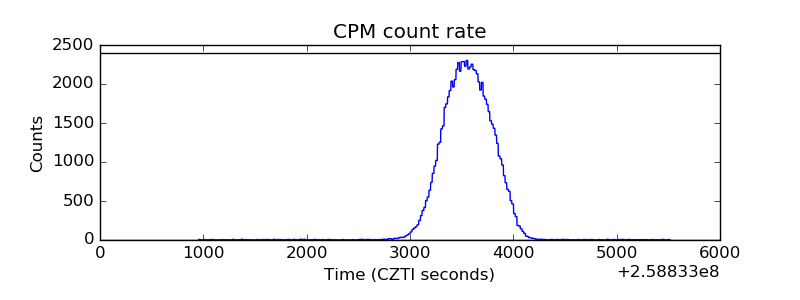 |
| CZT Counter | 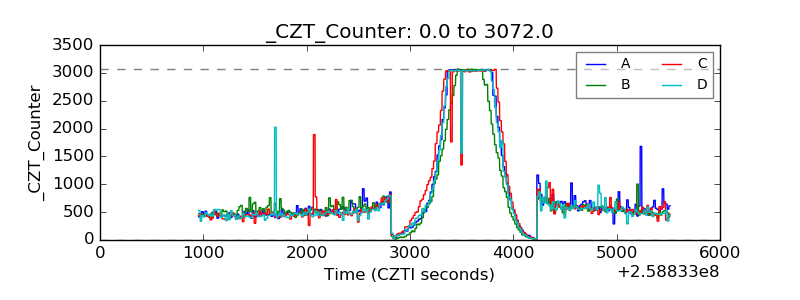 |
| +2.5 Volts monitor |  |
| +5 Volts monitor |  |
| _ROLL_ROT | 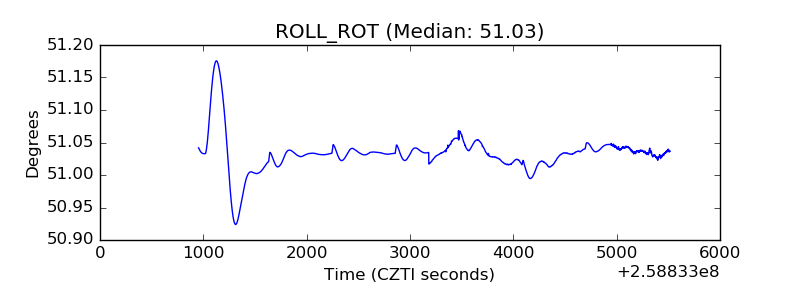 |
| _Roll_DEC | 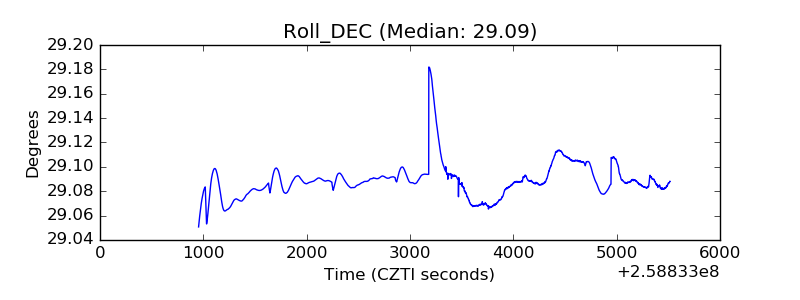 |
| _Roll_RA | 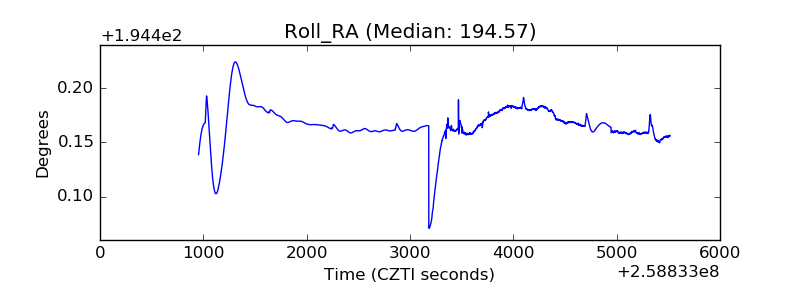 |
| Veto Counter | 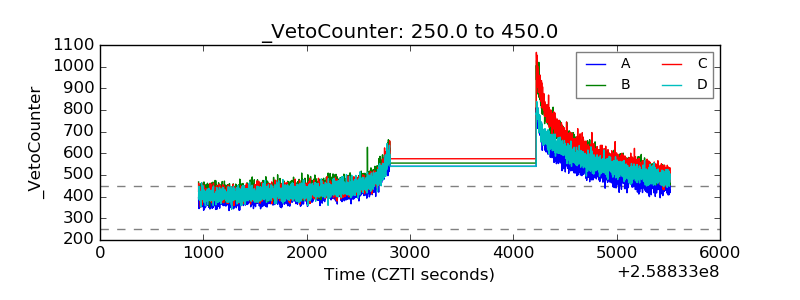 |