| Param | Original file | Final file |
|---|---|---|
| Filename | modeM0/AS1A04_196T04_9000001982_13317cztM0_level2.evt | modeM0/AS1A04_196T04_9000001982_13317cztM0_level2_quad_clean.evt |
| Size (bytes) | 249,442,560 | 74,952,000 |
| Size | 237.9 MB | 71.5 MB |
| Events in quadrant A | 1,924,690 | 496,167 |
| Events in quadrant B | 1,748,435 | 517,803 |
| Events in quadrant C | 1,757,303 | 517,016 |
| Events in quadrant D | 1,878,213 | 484,565 |
| Mode M9 | |||
|---|---|---|---|
| Quadrant | BADHDUFLAG | Total packets | Discarded packets |
| A | 0 | 1 | 0 |
| B | 0 | 1 | 0 |
| C | 0 | 1 | 0 |
| D | 0 | 2 | 0 |
| Mode SS | |||
|---|---|---|---|
| Quadrant | BADHDUFLAG | Total packets | Discarded packets |
| A | 0 | 72 | 0 |
| B | 0 | 72 | 0 |
| C | 0 | 72 | 0 |
| D | 0 | 72 | 0 |
| Mode M0 | |||
|---|---|---|---|
| Quadrant | BADHDUFLAG | Total packets | Discarded packets |
| A | 0 | 8092 | 1 |
| B | 0 | 7602 | 1 |
| C | 0 | 7632 | 1 |
| D | 0 | 8143 | 1 |
| Quadrant | Total seconds | Saturated seconds | Saturation percentage |
|---|---|---|---|
| A | 3590 | 8 | 0.222841% |
| B | 3590 | 8 | 0.222841% |
| C | 3590 | 8 | 0.222841% |
| D | 3590 | 24 | 0.668524% |
Noise dominated data is calculated using 1-second bins in cleaned event files. If a bin has >2000 counts, and if more than 50% of those come from <1% of pixels, then it is considered to be noise-dominated and hence unusable.
| Quadrant | # 1 sec bins | Bins with >0 counts | Bins with >2000 counts | High rate bins dominated by noise | Noise dominated (total time) | Noise dominated (detector-on time) | Marked lightcurve |
|---|---|---|---|---|---|---|---|
| A | 3591 | 3591 | 0 | 0 | 0.00% | 0.00% | 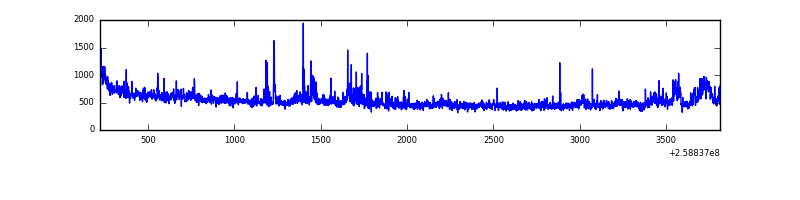 |
| B | 3591 | 3591 | 0 | 0 | 0.00% | 0.00% | 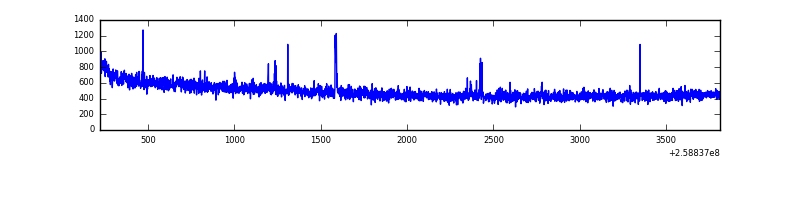 |
| C | 3591 | 3591 | 3 | 3 | 0.08% | 0.08% | 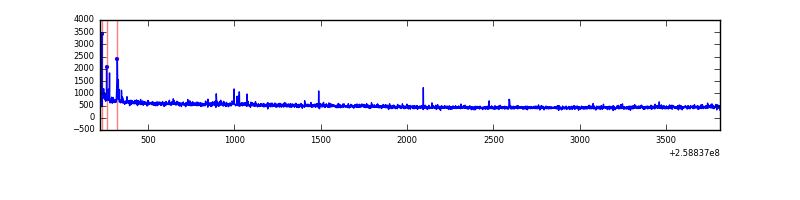 |
| D | 3591 | 3591 | 19 | 19 | 0.53% | 0.53% | 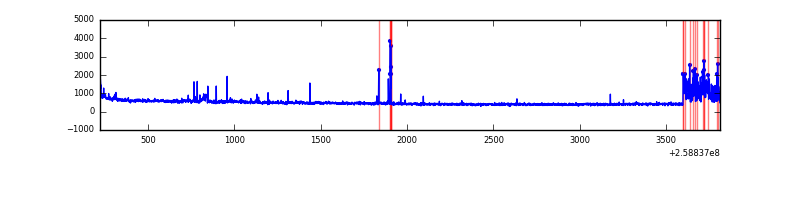 |
Top three noisy pixels from each quadrant. If the there are fewer than three noisy pixels in the level2.evt file, extra rows are filled as -1
| Pixel properties | Quadrant properties | ||||||
|---|---|---|---|---|---|---|---|
| Quadrant | DetID | PixID | Counts | Sigma | Mean | Median | Sigma |
| A | 8 | 15 | 226925 | 2548.83 | 437 | 431 | 88.9 |
| A | 1 | 162 | 9257 | 99.32 | 437 | 431 | 88.9 |
| A | 1 | 178 | 3829 | 38.24 | 437 | 431 | 88.9 |
| B | 3 | 64 | 9852 | 113.11 | 444 | 434 | 83.3 |
| B | 12 | 111 | 9172 | 104.94 | 444 | 434 | 83.3 |
| B | 11 | 111 | 7776 | 88.18 | 444 | 434 | 83.3 |
| C | 6 | 96 | 39494 | 387.12 | 439 | 443 | 100.9 |
| C | 13 | 61 | 3003 | 25.38 | 439 | 443 | 100.9 |
| C | 15 | 208 | 2643 | 21.81 | 439 | 443 | 100.9 |
| D | 1 | 52 | 170524 | 1641.5 | 430 | 420 | 103.6 |
| D | 8 | 195 | 29918 | 284.66 | 430 | 420 | 103.6 |
| D | 14 | 34 | 24963 | 236.84 | 430 | 420 | 103.6 |
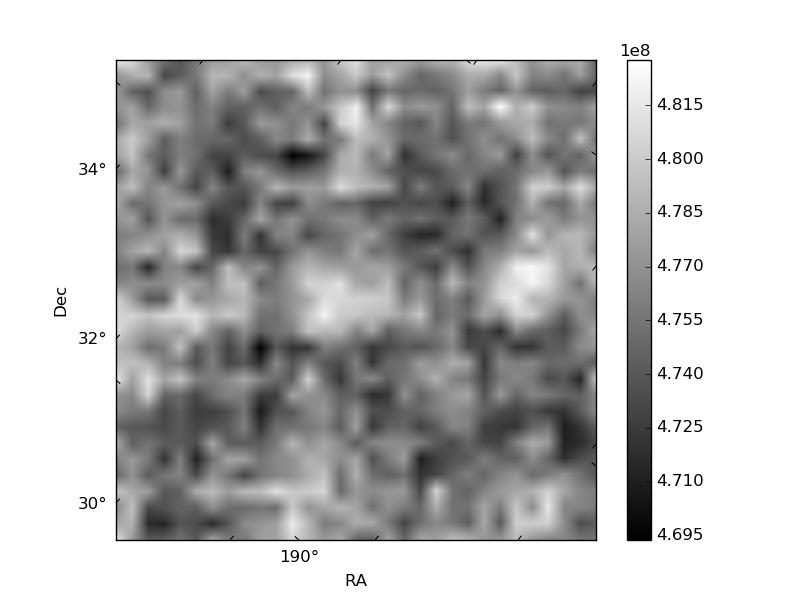
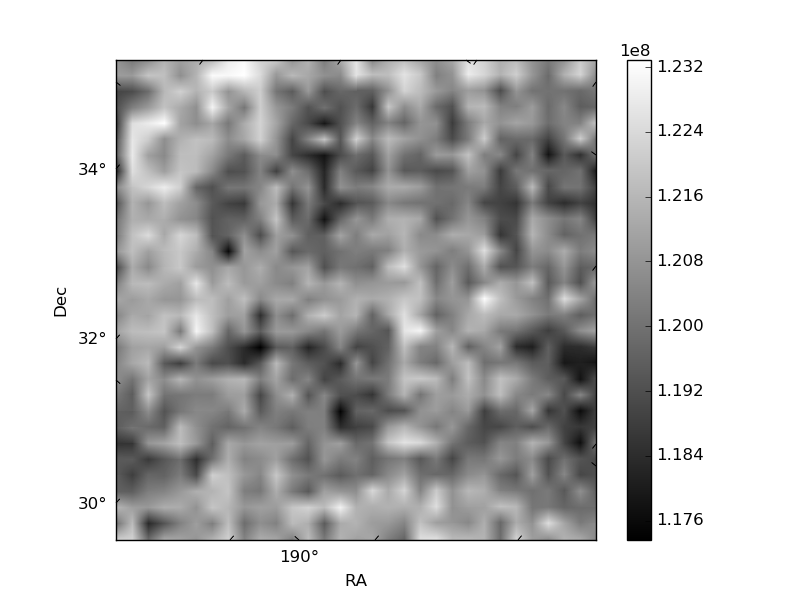
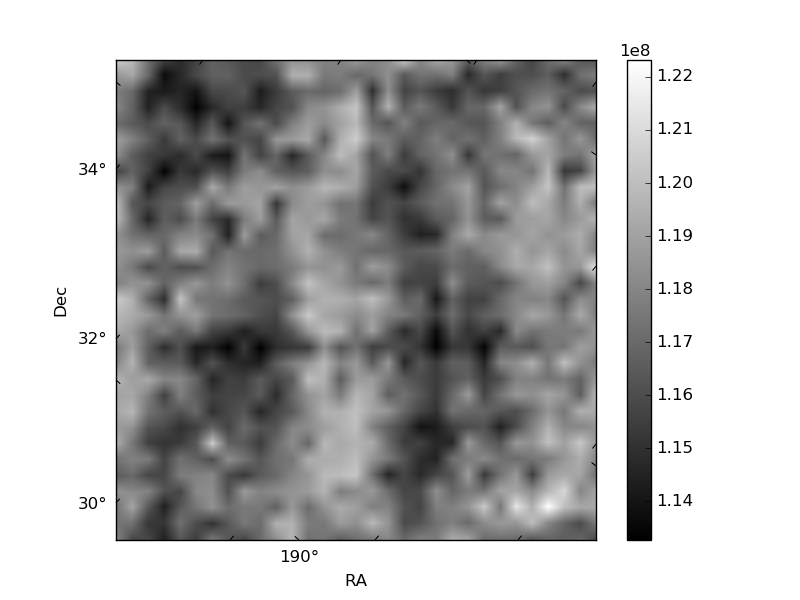
Histogram calculated using DETX and DETY for each event in the final _common_clean file
| Quadrant A | 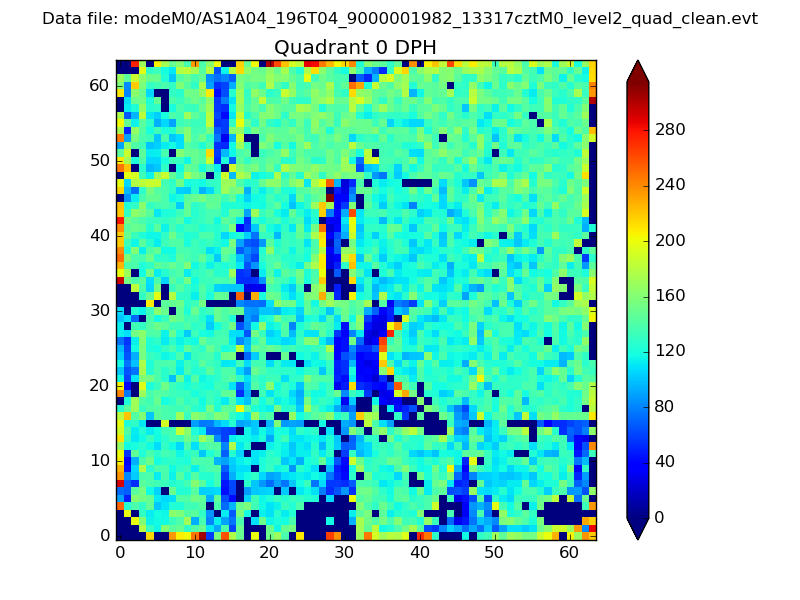 |
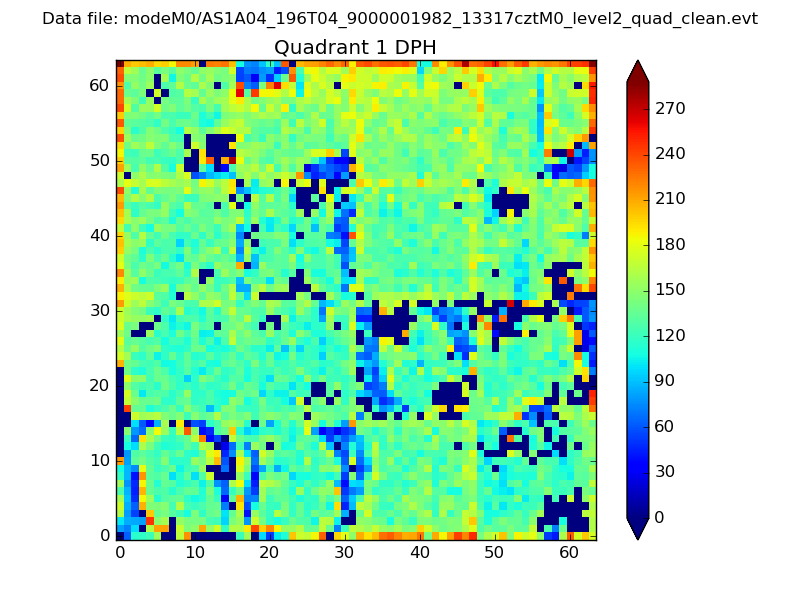 |
Quadrant B |
|---|---|---|---|
| Quadrant D | 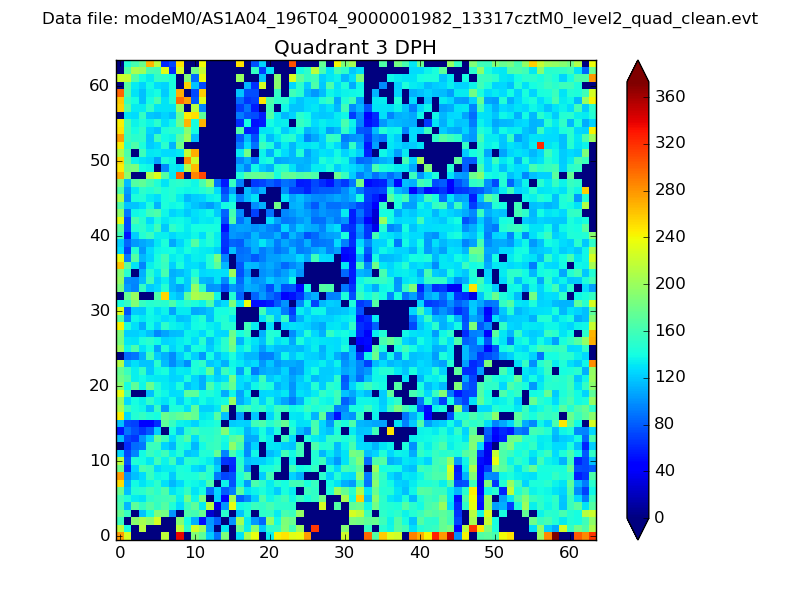 |
 |
Quadrant C |
| Plot type | Count rate plots | Images |
|---|---|---|
| Comparison with Poisson distribution Blue bars denote a histogram of data divided into 1 sec bins. Red curve is a Poisson curve with rate = median count rate of data. |
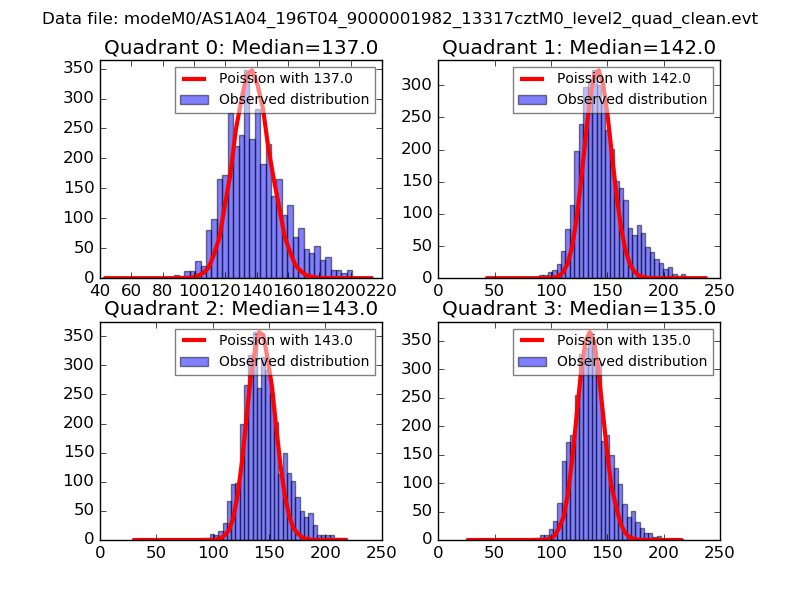 |
 |
| Quadrant-wise count rates Data is divided into 100 sec bins |
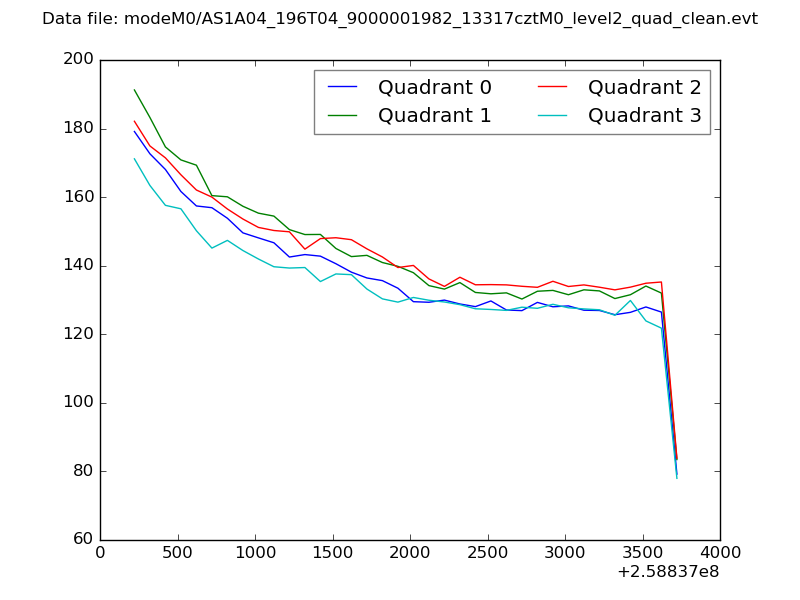 |
|
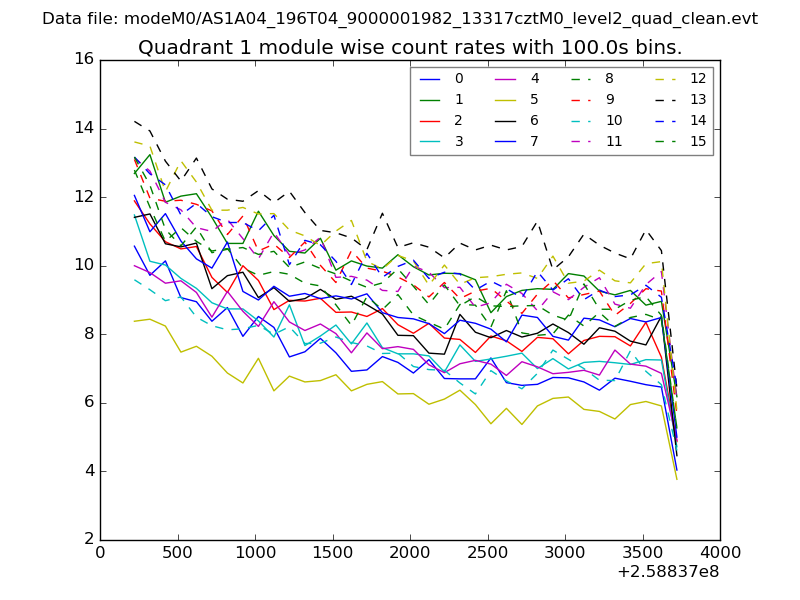
| Module-wise count rates for Quadrant A Data is divided into 100 sec bins |
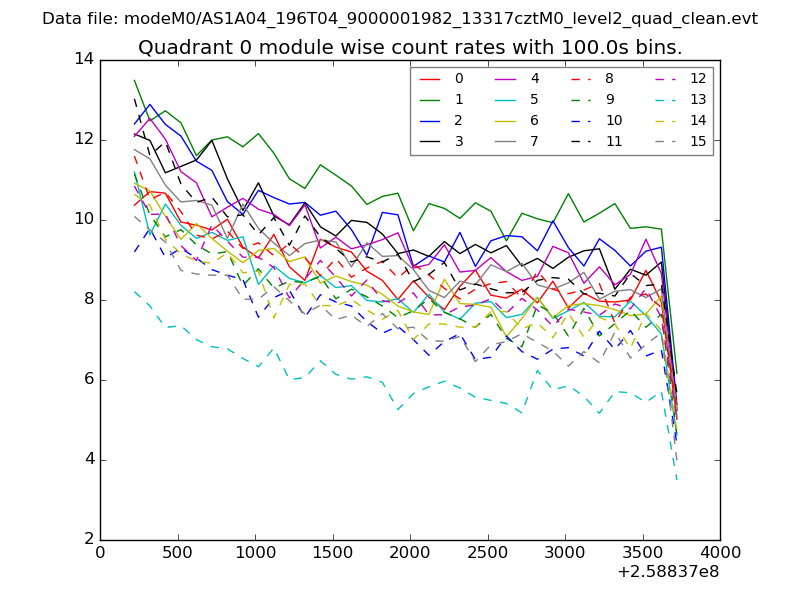 |
 |
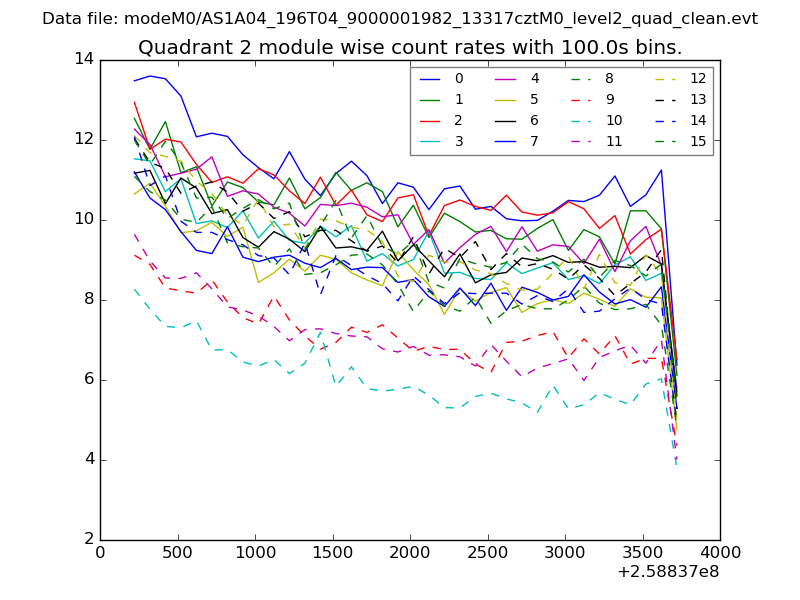
| Module-wise count rates for Quadrant B Data is divided into 100 sec bins |
 |
 |
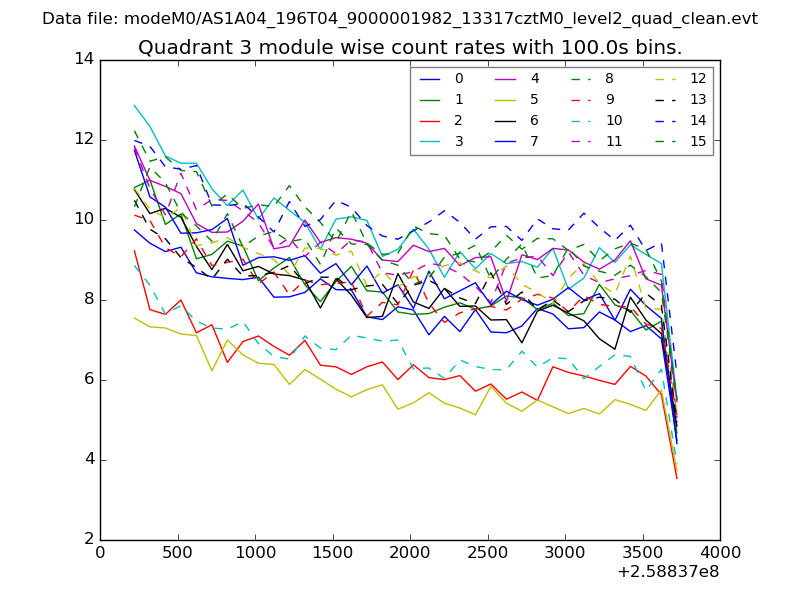
| Module-wise count rates for Quadrant C Data is divided into 100 sec bins |
 |
 |
| Module-wise count rates for Quadrant D Data is divided into 100 sec bins |
 |
 |
| Parameter | Plot |
|---|---|
| CZT HV Monitor | 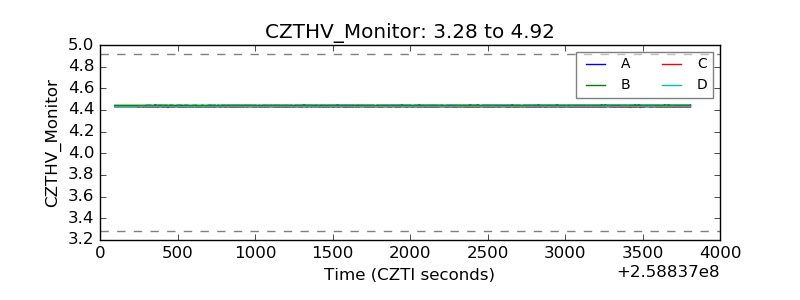 |
| D_VDD | 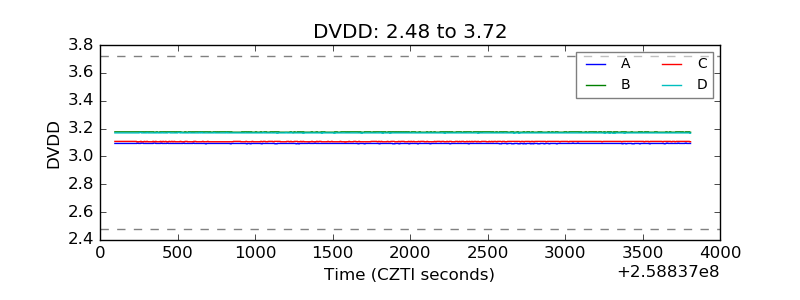 |
| Temperature 1 | 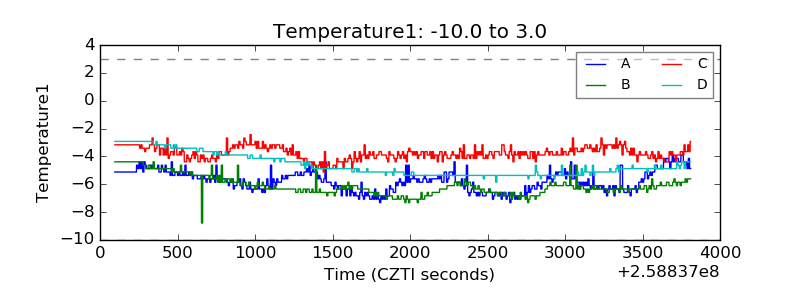 |
| Veto HV Monitor | 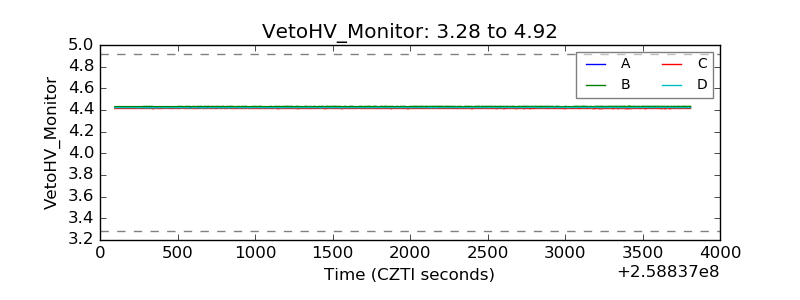 |
| Veto LLD | 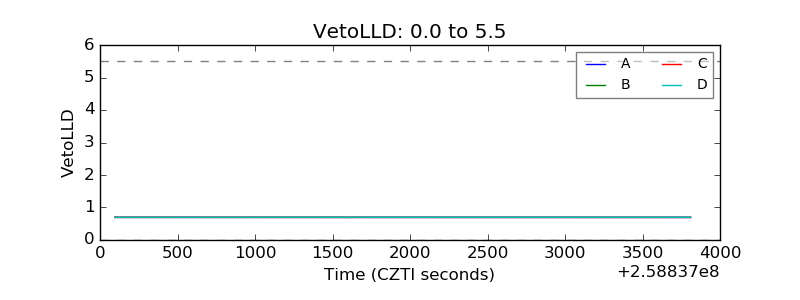 |
| Alpha Counter | 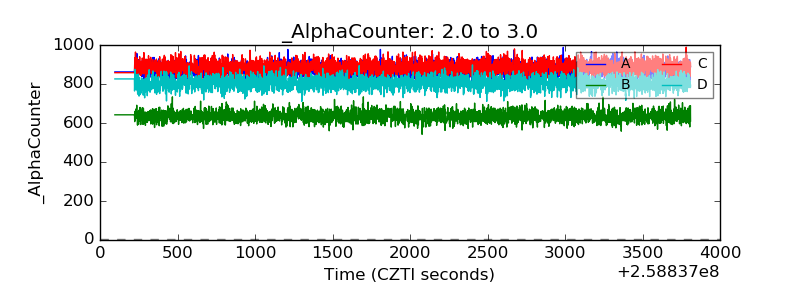 |
| _CPM_Rate |  |
| CZT Counter |  |
| +2.5 Volts monitor |  |
| +5 Volts monitor |  |
| _ROLL_ROT | 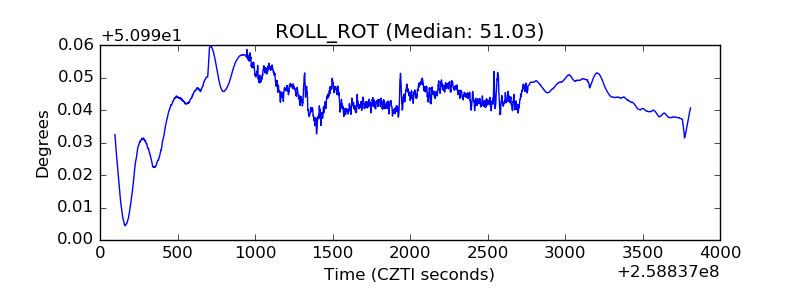 |
| _Roll_DEC | 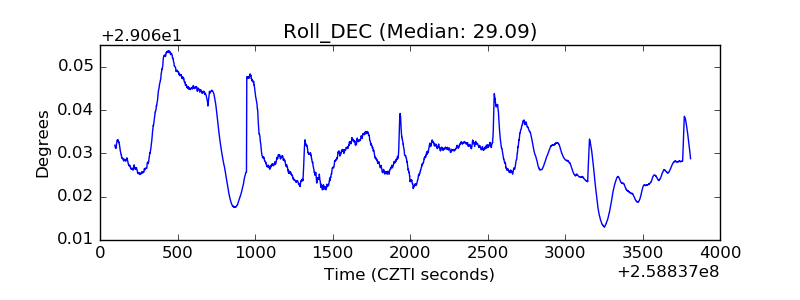 |
| _Roll_RA | 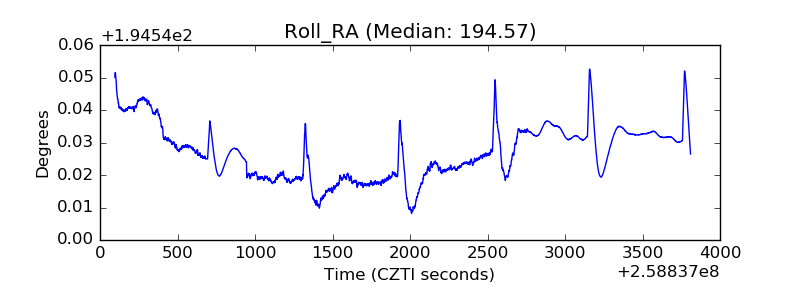 |
| Veto Counter | 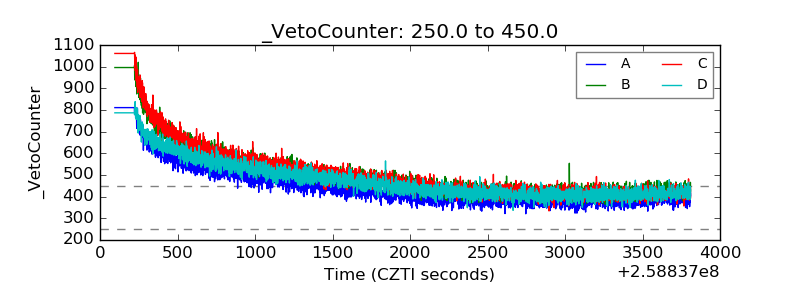 |