| Param | Original file | Final file |
|---|---|---|
| Filename | modeM0/AS1T02_014T01_9000001980_13313cztM0_level2.evt | modeM0/AS1T02_014T01_9000001980_13313cztM0_level2_quad_clean.evt |
| Size (bytes) | 128,655,360 | 37,304,640 |
| Size | 122.7 MB | 35.6 MB |
| Events in quadrant A | 1,090,076 | 256,063 |
| Events in quadrant B | 950,861 | 261,756 |
| Events in quadrant C | 844,761 | 253,985 |
| Events in quadrant D | 901,310 | 241,556 |
| Mode SS | |||
|---|---|---|---|
| Quadrant | BADHDUFLAG | Total packets | Discarded packets |
| A | 0 | 32 | 0 |
| B | 0 | 32 | 0 |
| C | 0 | 32 | 0 |
| D | 0 | 32 | 0 |
| Mode M0 | |||
|---|---|---|---|
| Quadrant | BADHDUFLAG | Total packets | Discarded packets |
| A | 0 | 4409 | 2 |
| B | 0 | 3896 | 1 |
| C | 0 | 3460 | 1 |
| D | 0 | 3635 | 1 |
| Mode M9 | |||
|---|---|---|---|
| Quadrant | BADHDUFLAG | Total packets | Discarded packets |
| A | 0 | 10 | 0 |
| B | 0 | 10 | 0 |
| C | 0 | 10 | 0 |
| D | 0 | 10 | 0 |
| Quadrant | Total seconds | Saturated seconds | Saturation percentage |
|---|---|---|---|
| A | 1569 | 20 | 1.274697% |
| B | 1569 | 22 | 1.402167% |
| C | 1569 | 6 | 0.382409% |
| D | 1569 | 17 | 1.083493% |
Noise dominated data is calculated using 1-second bins in cleaned event files. If a bin has >2000 counts, and if more than 50% of those come from <1% of pixels, then it is considered to be noise-dominated and hence unusable.
| Quadrant | # 1 sec bins | Bins with >0 counts | Bins with >2000 counts | High rate bins dominated by noise | Noise dominated (total time) | Noise dominated (detector-on time) | Marked lightcurve |
|---|---|---|---|---|---|---|---|
| A | 1570 | 1570 | 2 | 2 | 0.13% | 0.13% | 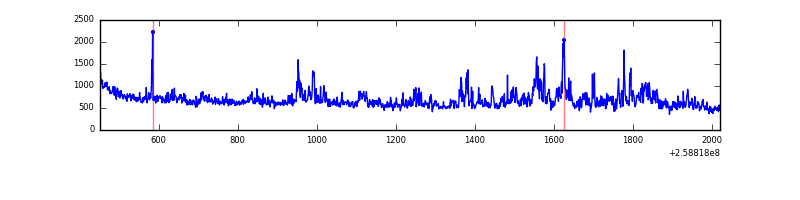 |
| B | 1570 | 1570 | 8 | 8 | 0.51% | 0.51% | 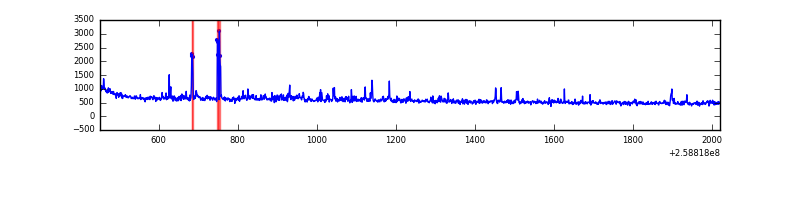 |
| C | 1570 | 1570 | 1 | 1 | 0.06% | 0.06% | 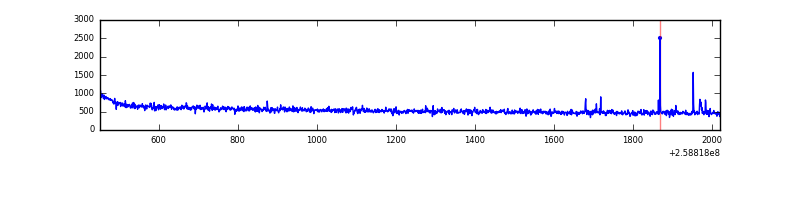 |
| D | 1570 | 1570 | 4 | 4 | 0.25% | 0.25% | 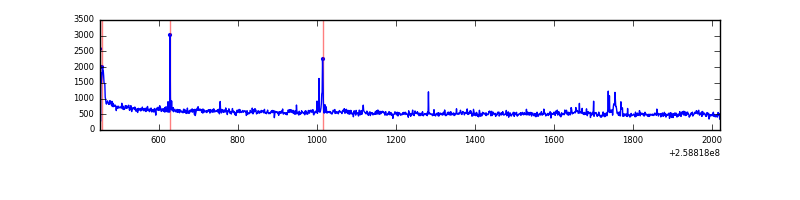 |
Top three noisy pixels from each quadrant. If the there are fewer than three noisy pixels in the level2.evt file, extra rows are filled as -1
| Pixel properties | Quadrant properties | ||||||
|---|---|---|---|---|---|---|---|
| Quadrant | DetID | PixID | Counts | Sigma | Mean | Median | Sigma |
| A | 8 | 15 | 211158 | 4514.63 | 224 | 220 | 46.7 |
| A | 1 | 162 | 6388 | 132.01 | 224 | 220 | 46.7 |
| A | 15 | 69 | 4311 | 87.56 | 224 | 220 | 46.7 |
| B | 0 | 189 | 19577 | 445.7 | 222 | 218 | 43.4 |
| B | 10 | 246 | 18275 | 415.72 | 222 | 218 | 43.4 |
| B | 3 | 64 | 15672 | 355.79 | 222 | 218 | 43.4 |
| C | 15 | 208 | 10040 | 195.64 | 212 | 214 | 50.2 |
| C | 8 | 128 | 3424 | 63.91 | 212 | 214 | 50.2 |
| C | 8 | 112 | 1929 | 34.15 | 212 | 214 | 50.2 |
| D | 8 | 195 | 35355 | 674.33 | 214 | 209 | 52.1 |
| D | 2 | 136 | 20547 | 390.22 | 214 | 209 | 52.1 |
| D | 12 | 222 | 15989 | 302.76 | 214 | 209 | 52.1 |
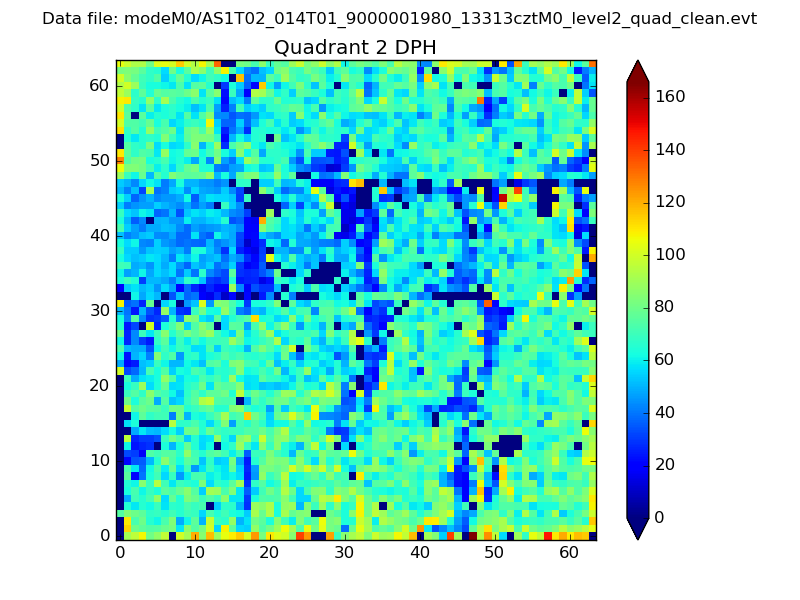
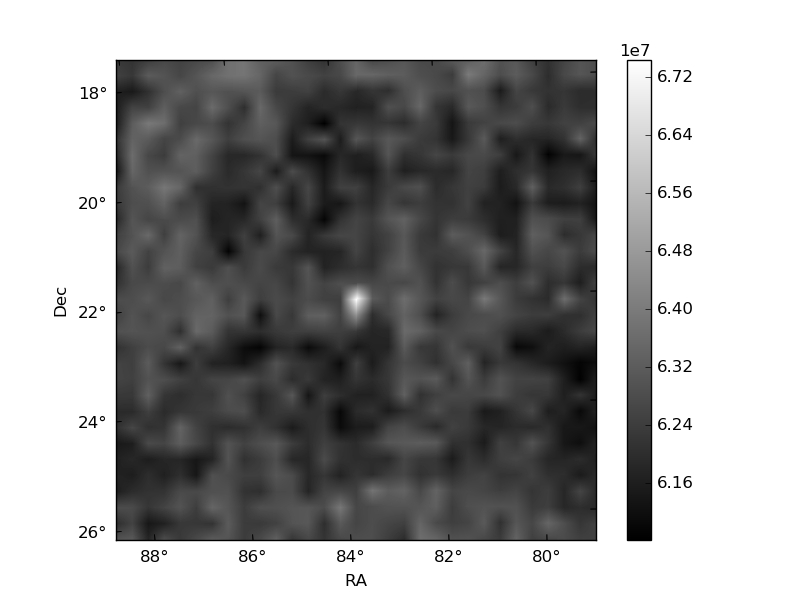
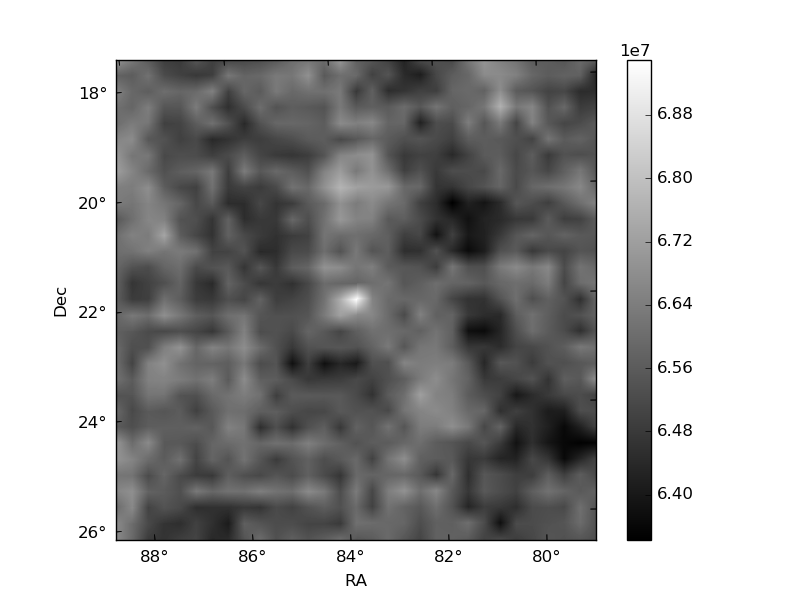
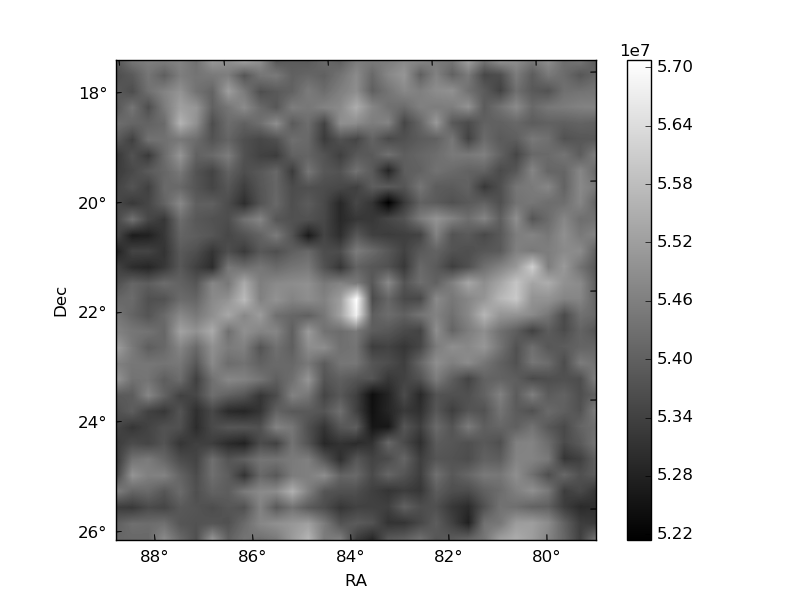
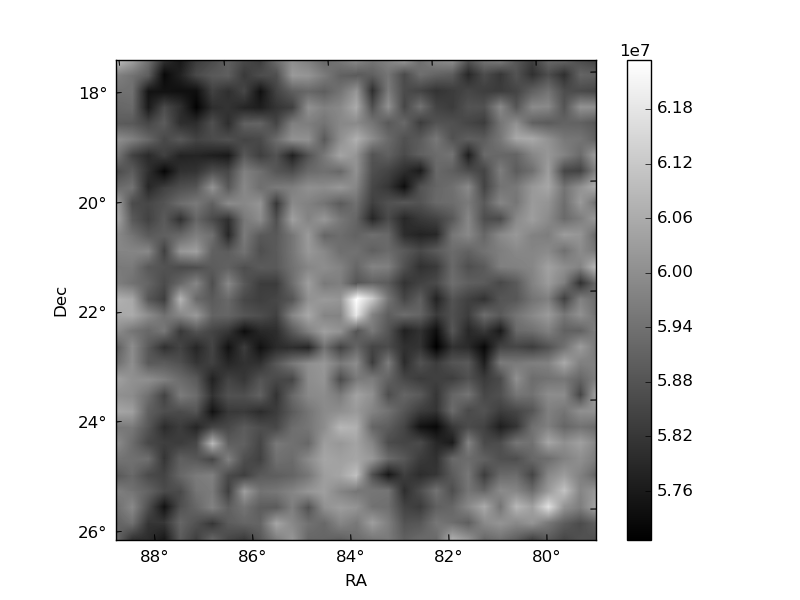
Histogram calculated using DETX and DETY for each event in the final _common_clean file
| Quadrant A | 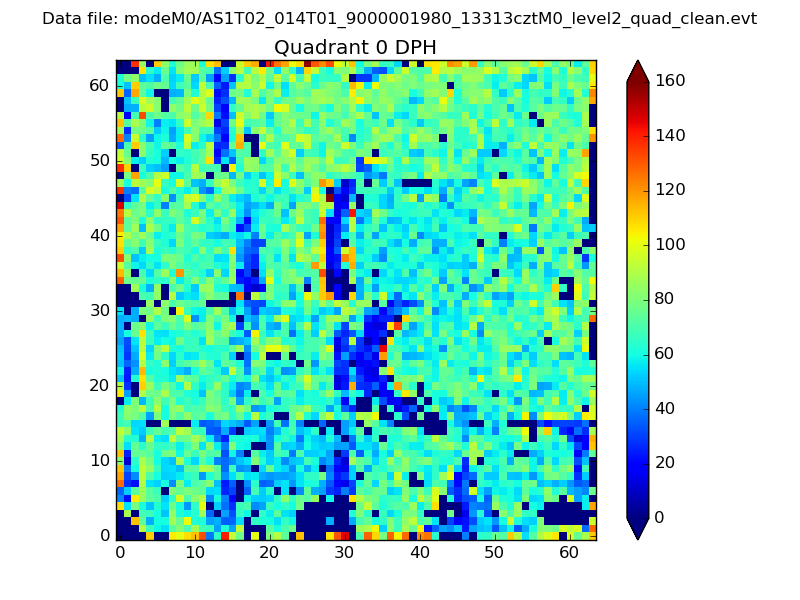 |
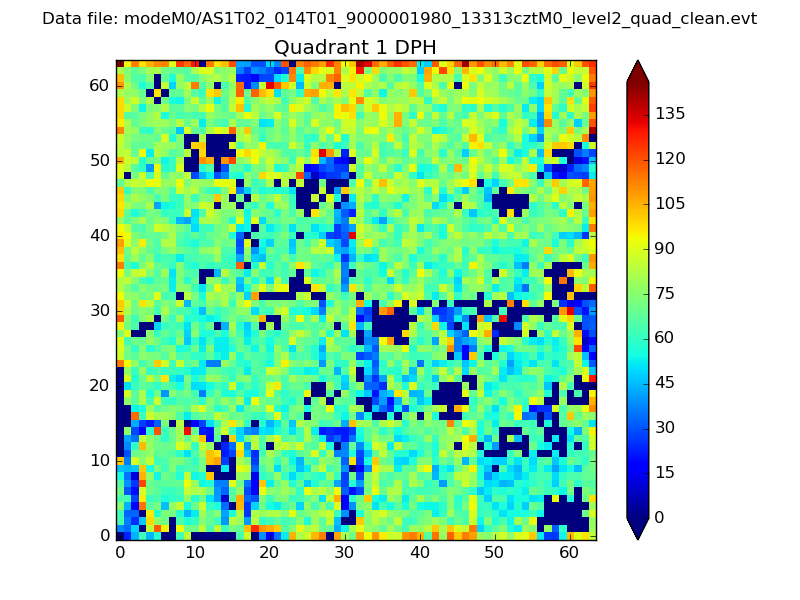 |
Quadrant B |
|---|---|---|---|
| Quadrant D | 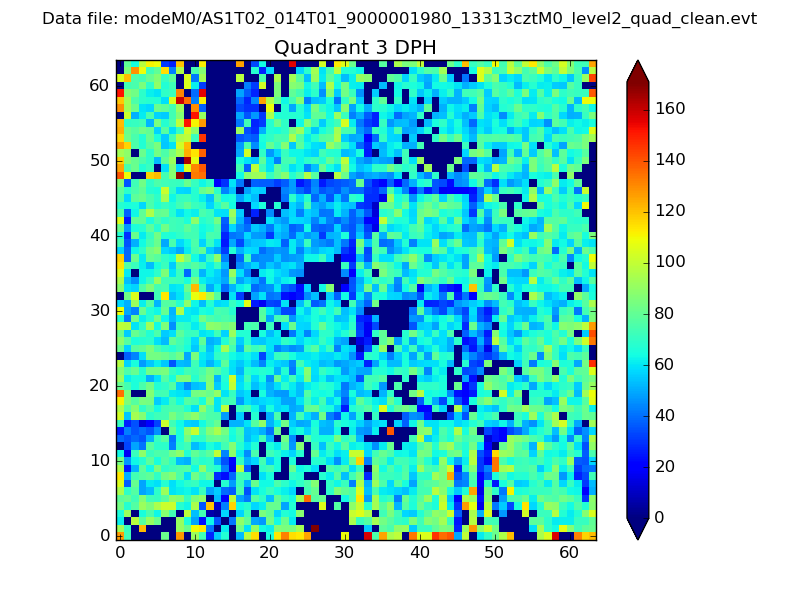 |
 |
Quadrant C |
| Plot type | Count rate plots | Images |
|---|---|---|
| Comparison with Poisson distribution Blue bars denote a histogram of data divided into 1 sec bins. Red curve is a Poisson curve with rate = median count rate of data. |
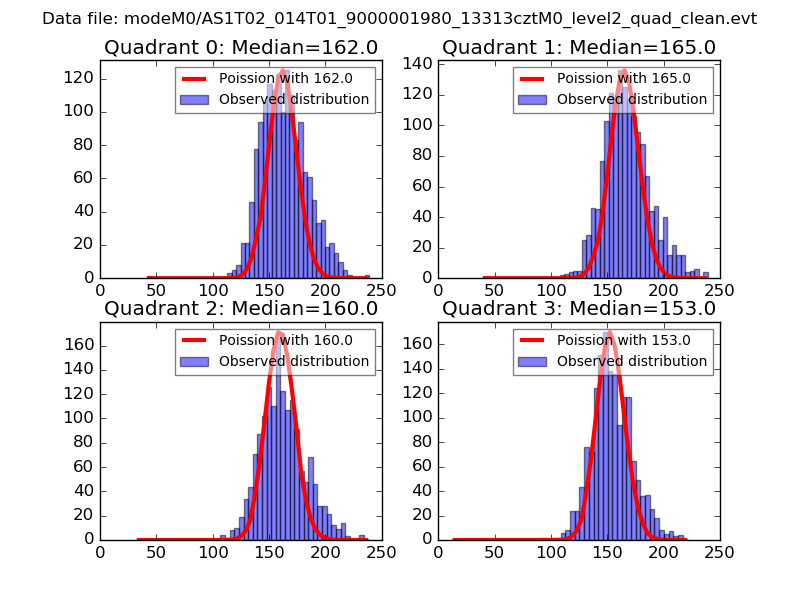 |
 |
| Quadrant-wise count rates Data is divided into 100 sec bins |
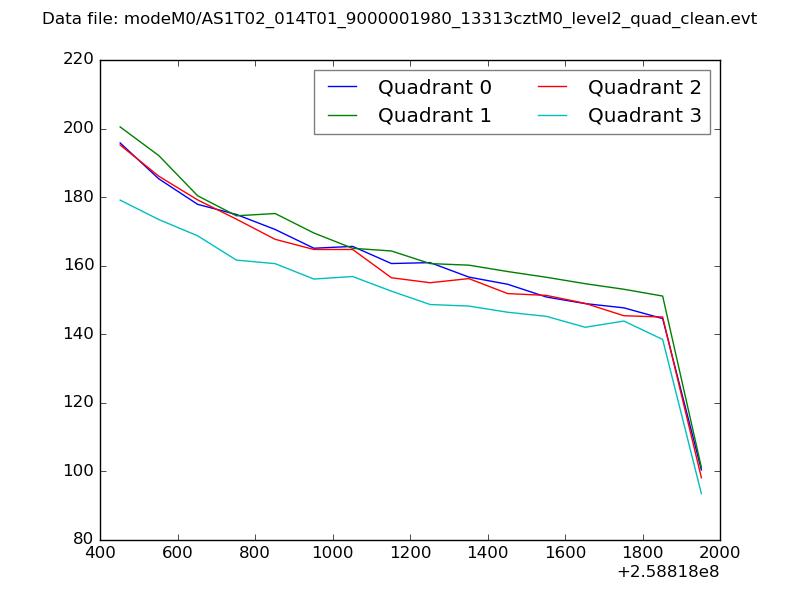 |
|
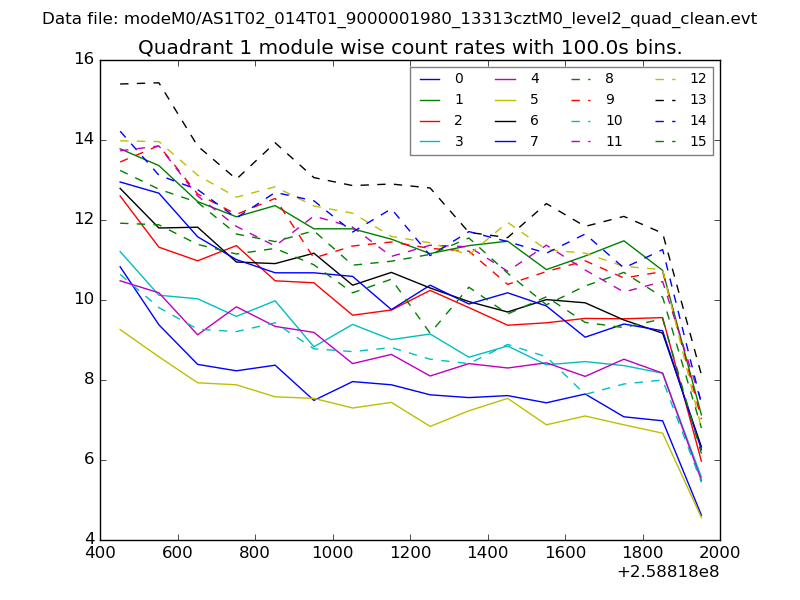
| Module-wise count rates for Quadrant A Data is divided into 100 sec bins |
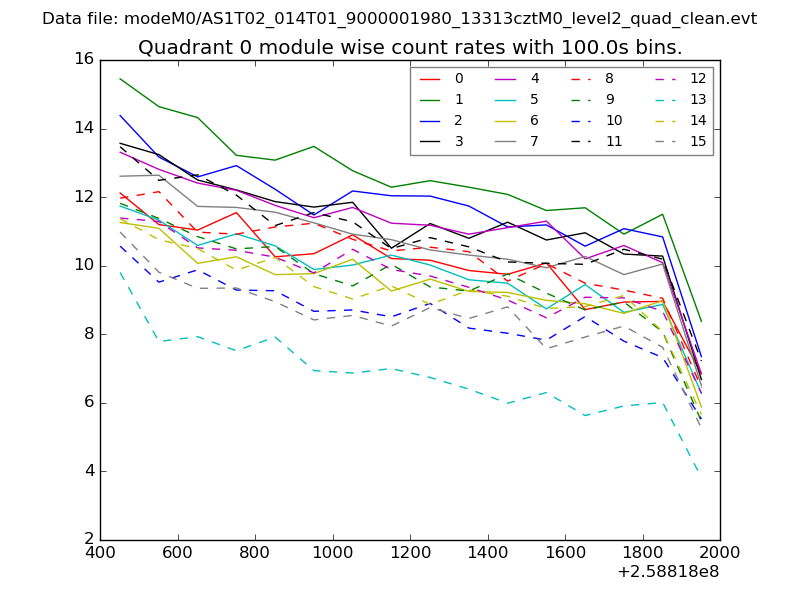 |
 |
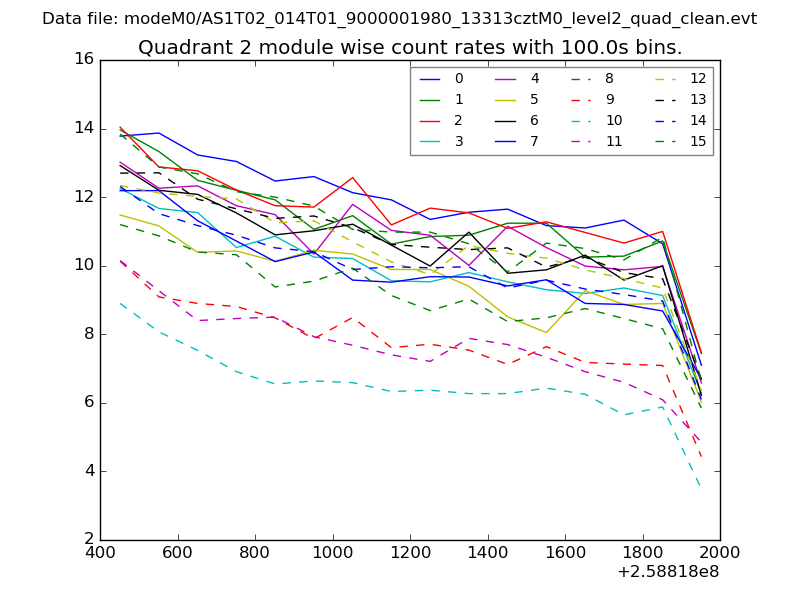
| Module-wise count rates for Quadrant B Data is divided into 100 sec bins |
 |
 |
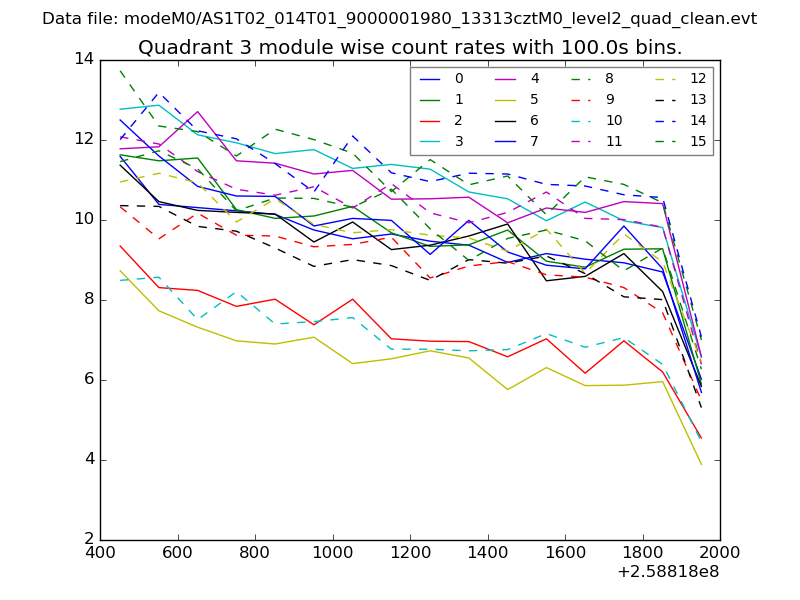
| Module-wise count rates for Quadrant C Data is divided into 100 sec bins |
 |
 |
| Module-wise count rates for Quadrant D Data is divided into 100 sec bins |
 |
 |
| Parameter | Plot |
|---|---|
| CZT HV Monitor | 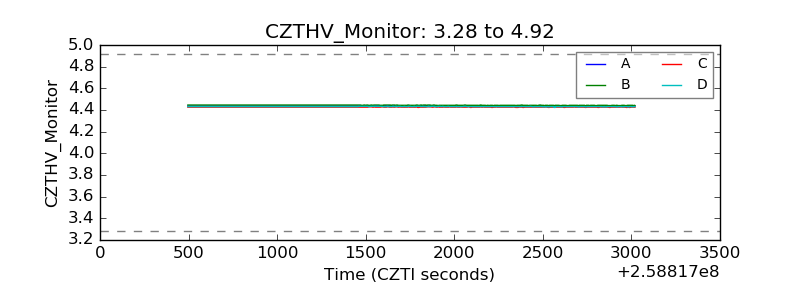 |
| D_VDD | 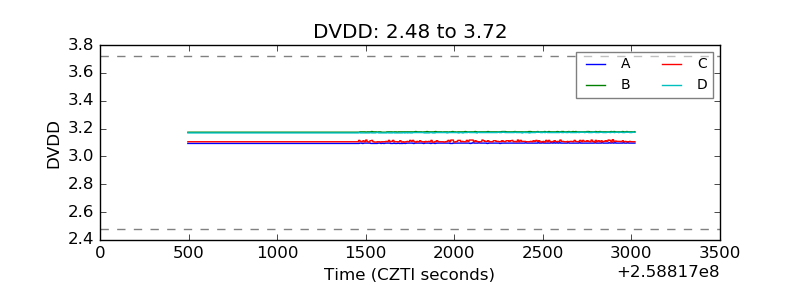 |
| Temperature 1 | 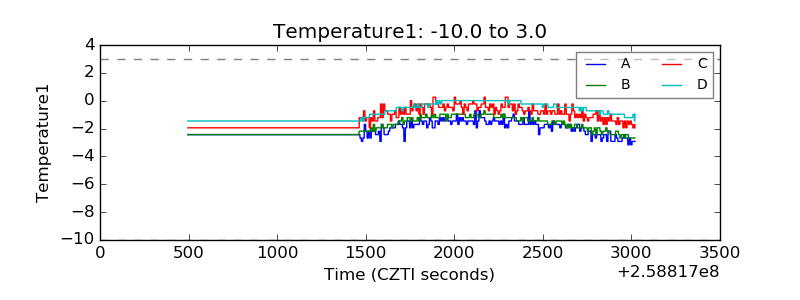 |
| Veto HV Monitor | 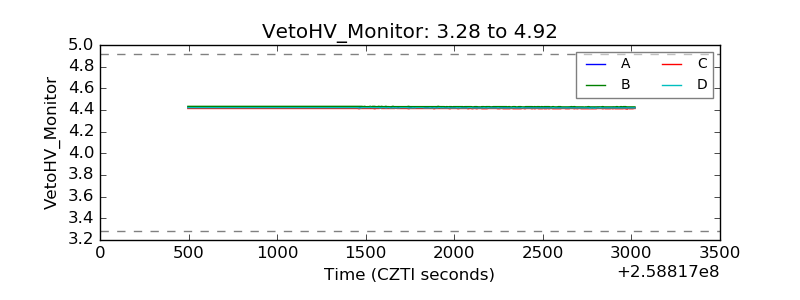 |
| Veto LLD | 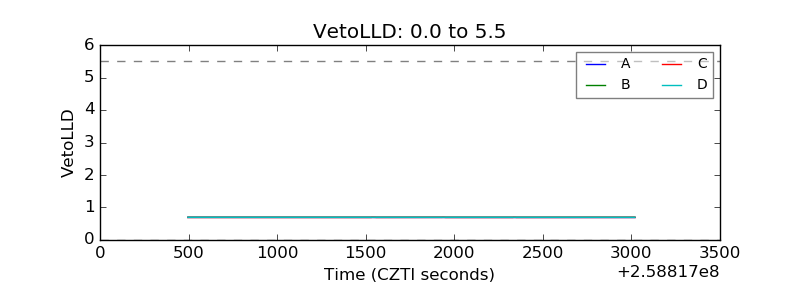 |
| Alpha Counter | 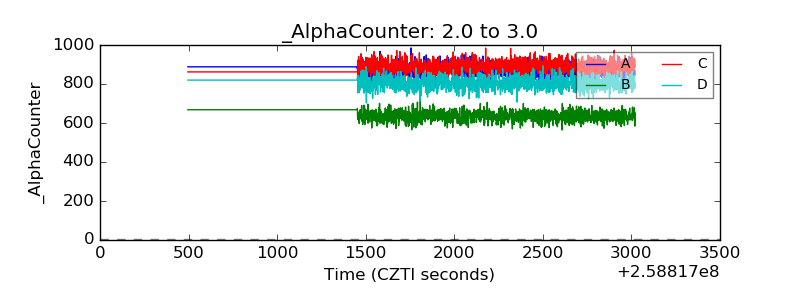 |
| _CPM_Rate | 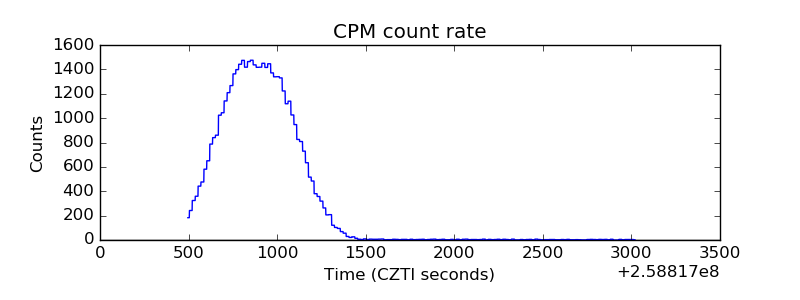 |
| CZT Counter | 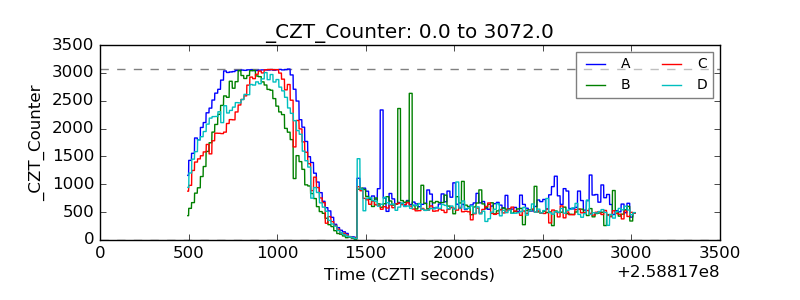 |
| +2.5 Volts monitor |  |
| +5 Volts monitor |  |
| _ROLL_ROT | 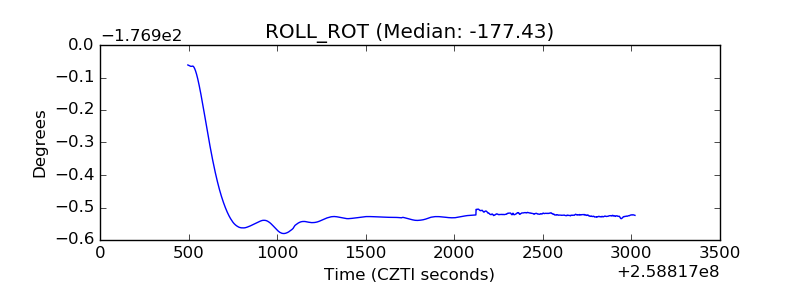 |
| _Roll_DEC | 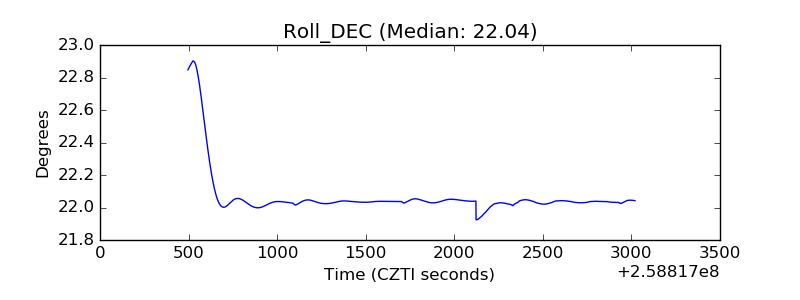 |
| _Roll_RA | 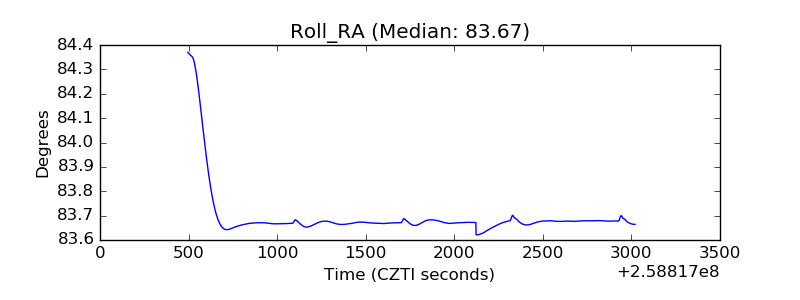 |
| Veto Counter | 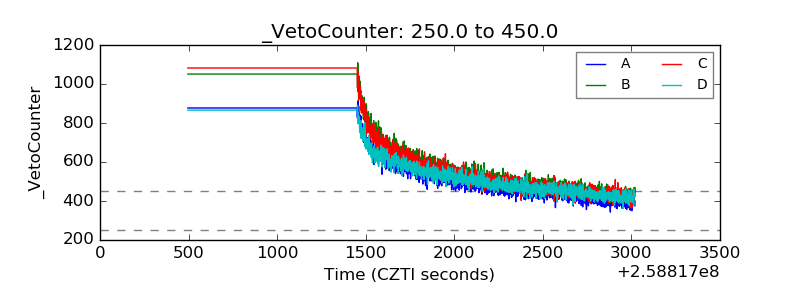 |