| Param | Original file | Final file |
|---|---|---|
| Filename | modeM0/AS1T02_014T01_9000001980_13314cztM0_level2.evt | modeM0/AS1T02_014T01_9000001980_13314cztM0_level2_quad_clean.evt |
| Size (bytes) | 447,275,520 | 98,219,520 |
| Size | 426.6 MB | 93.7 MB |
| Events in quadrant A | 3,487,051 | 646,444 |
| Events in quadrant B | 3,323,662 | 657,508 |
| Events in quadrant C | 3,039,016 | 636,057 |
| Events in quadrant D | 3,279,288 | 606,151 |
| Mode SS | |||
|---|---|---|---|
| Quadrant | BADHDUFLAG | Total packets | Discarded packets |
| A | 0 | 126 | 0 |
| B | 0 | 126 | 0 |
| C | 0 | 126 | 0 |
| D | 0 | 126 | 0 |
| Mode M0 | |||
|---|---|---|---|
| Quadrant | BADHDUFLAG | Total packets | Discarded packets |
| A | 0 | 14279 | 2 |
| B | 0 | 13685 | 1 |
| C | 0 | 12917 | 1 |
| D | 0 | 13729 | 1 |
| Mode M9 | |||
|---|---|---|---|
| Quadrant | BADHDUFLAG | Total packets | Discarded packets |
| A | 0 | 12 | 0 |
| B | 0 | 12 | 0 |
| C | 0 | 12 | 0 |
| D | 0 | 12 | 0 |
| Quadrant | Total seconds | Saturated seconds | Saturation percentage |
|---|---|---|---|
| A | 6132 | 57 | 0.929550% |
| B | 6132 | 62 | 1.011089% |
| C | 6132 | 43 | 0.701239% |
| D | 6132 | 47 | 0.766471% |
Noise dominated data is calculated using 1-second bins in cleaned event files. If a bin has >2000 counts, and if more than 50% of those come from <1% of pixels, then it is considered to be noise-dominated and hence unusable.
| Quadrant | # 1 sec bins | Bins with >0 counts | Bins with >2000 counts | High rate bins dominated by noise | Noise dominated (total time) | Noise dominated (detector-on time) | Marked lightcurve |
|---|---|---|---|---|---|---|---|
| A | 7348 | 6134 | 3 | 3 | 0.04% | 0.05% | 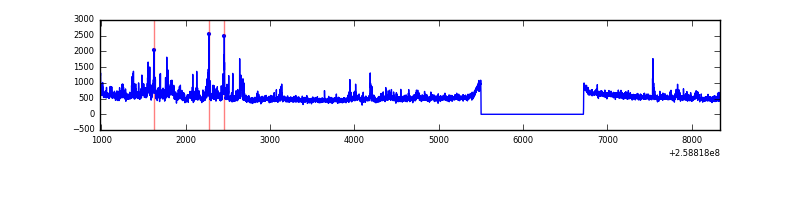 |
| B | 7348 | 6134 | 10 | 10 | 0.14% | 0.16% | 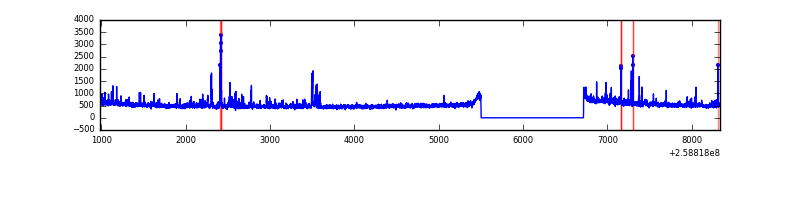 |
| C | 7348 | 6134 | 8 | 8 | 0.11% | 0.13% | 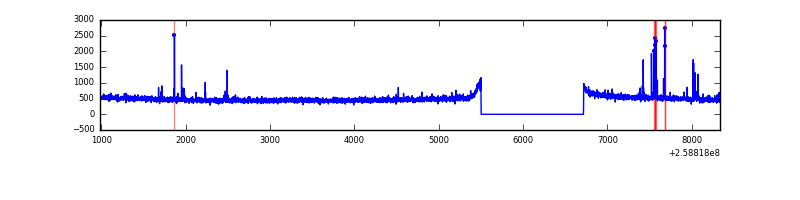 |
| D | 7348 | 6134 | 16 | 16 | 0.22% | 0.26% | 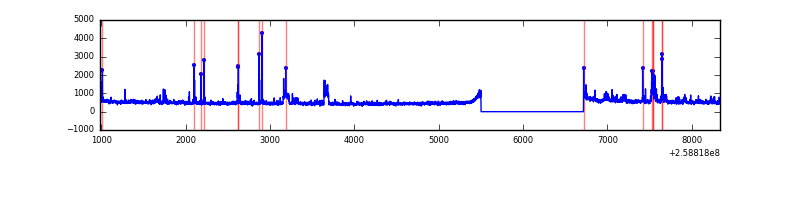 |
Top three noisy pixels from each quadrant. If the there are fewer than three noisy pixels in the level2.evt file, extra rows are filled as -1
| Pixel properties | Quadrant properties | ||||||
|---|---|---|---|---|---|---|---|
| Quadrant | DetID | PixID | Counts | Sigma | Mean | Median | Sigma |
| A | 8 | 15 | 406005 | 2567.71 | 783 | 767 | 157.8 |
| A | 1 | 162 | 27747 | 170.95 | 783 | 767 | 157.8 |
| A | 9 | 143 | 15611 | 94.06 | 783 | 767 | 157.8 |
| B | 0 | 189 | 54799 | 368.89 | 785 | 768 | 146.5 |
| B | 4 | 173 | 47053 | 316.01 | 785 | 768 | 146.5 |
| B | 3 | 64 | 45961 | 308.55 | 785 | 768 | 146.5 |
| C | 15 | 208 | 68240 | 387.39 | 758 | 766 | 174.2 |
| C | 8 | 128 | 7711 | 39.87 | 758 | 766 | 174.2 |
| C | 13 | 61 | 5507 | 27.22 | 758 | 766 | 174.2 |
| D | 8 | 195 | 153025 | 840.63 | 755 | 736 | 181.2 |
| D | 2 | 136 | 92104 | 504.35 | 755 | 736 | 181.2 |
| D | 5 | 222 | 87585 | 479.4 | 755 | 736 | 181.2 |
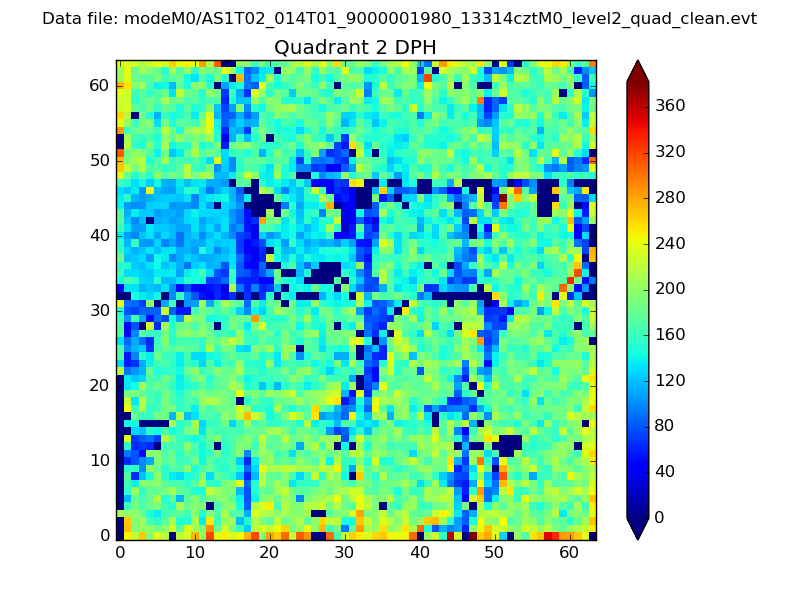
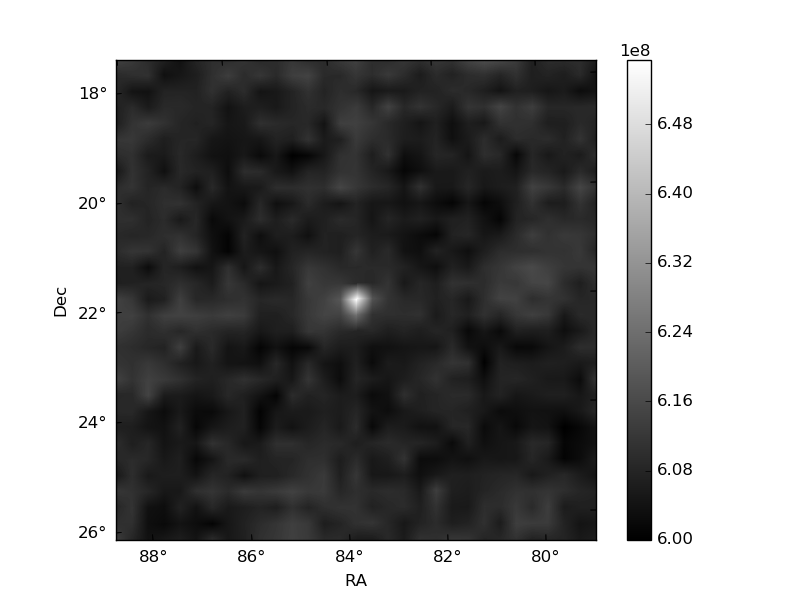
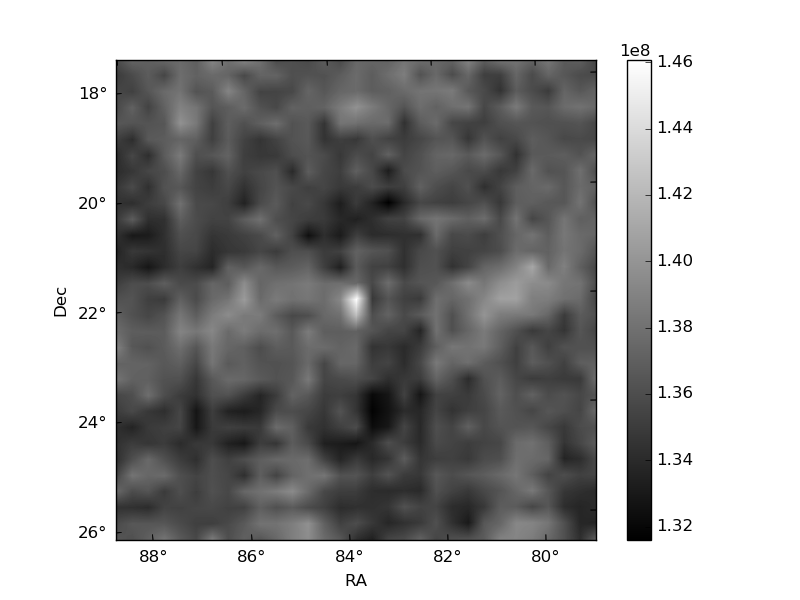
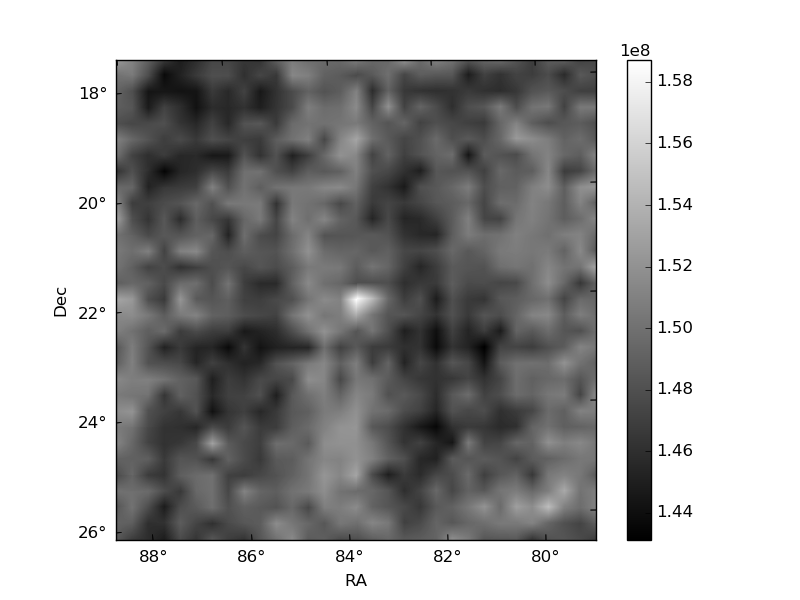
Histogram calculated using DETX and DETY for each event in the final _common_clean file
| Quadrant A | 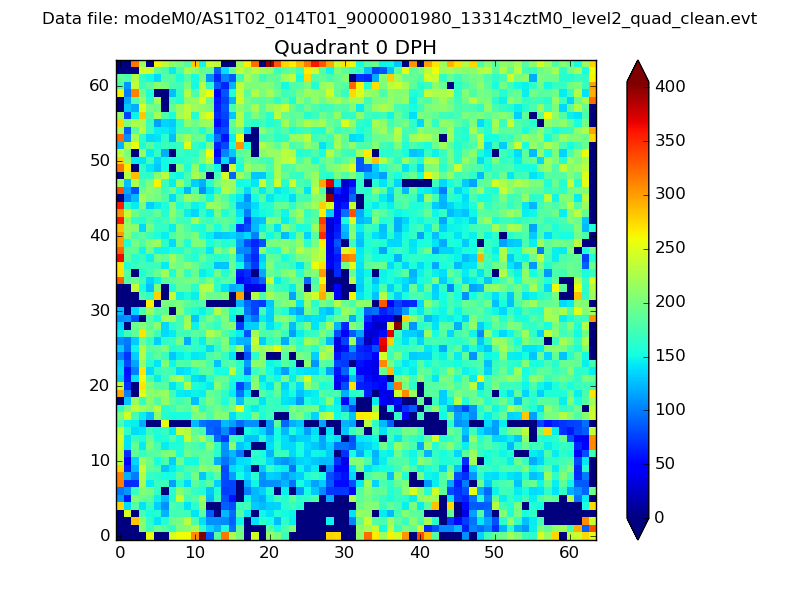 |
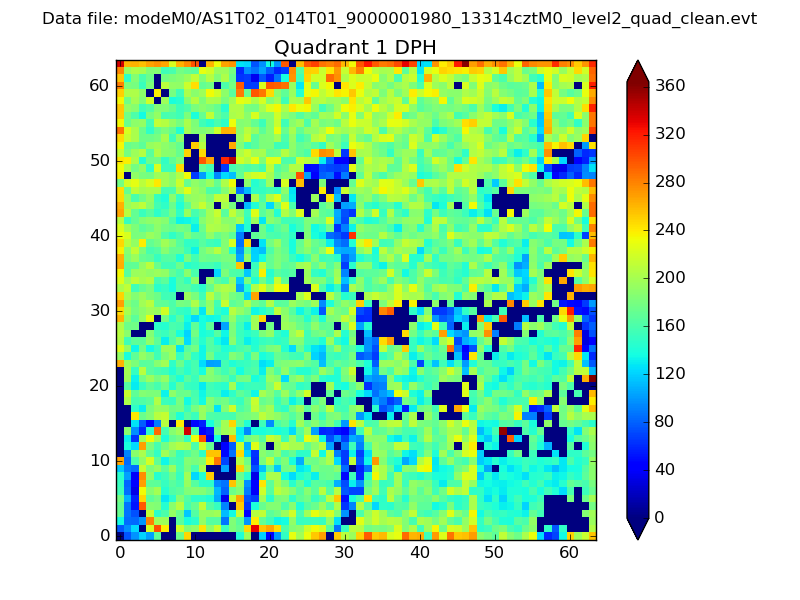 |
Quadrant B |
|---|---|---|---|
| Quadrant D | 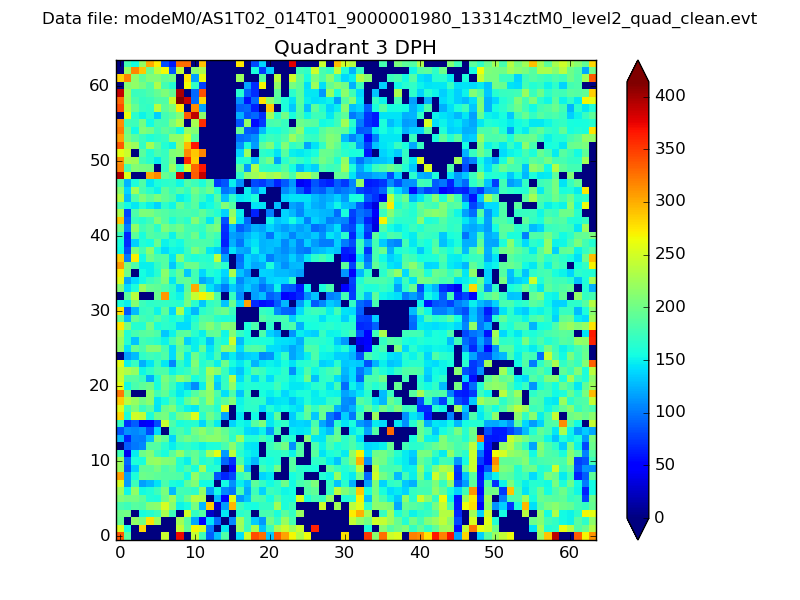 |
 |
Quadrant C |
| Plot type | Count rate plots | Images |
|---|---|---|
| Comparison with Poisson distribution Blue bars denote a histogram of data divided into 1 sec bins. Red curve is a Poisson curve with rate = median count rate of data. |
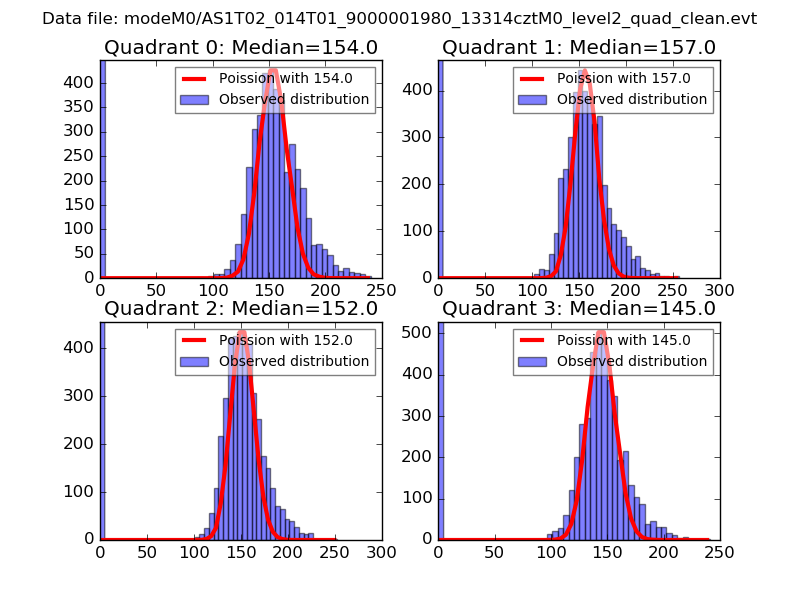 |
 |
| Quadrant-wise count rates Data is divided into 100 sec bins |
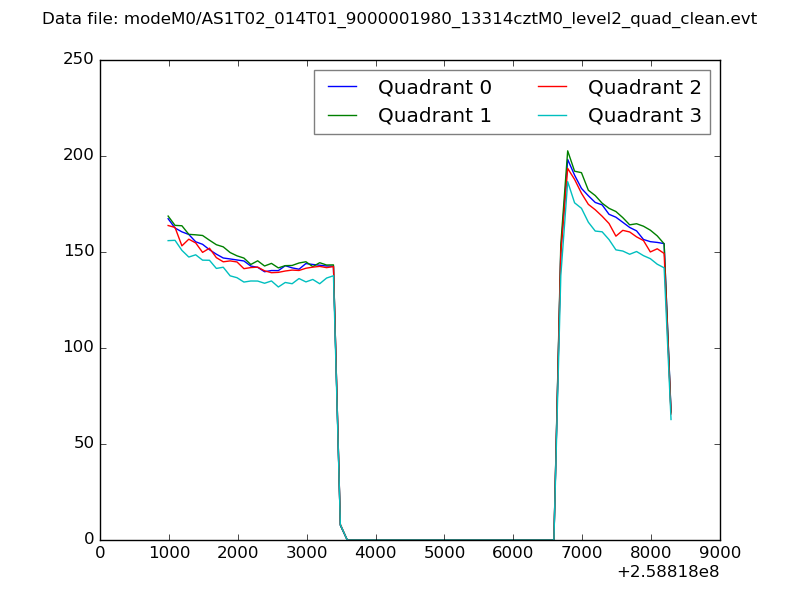 |
|
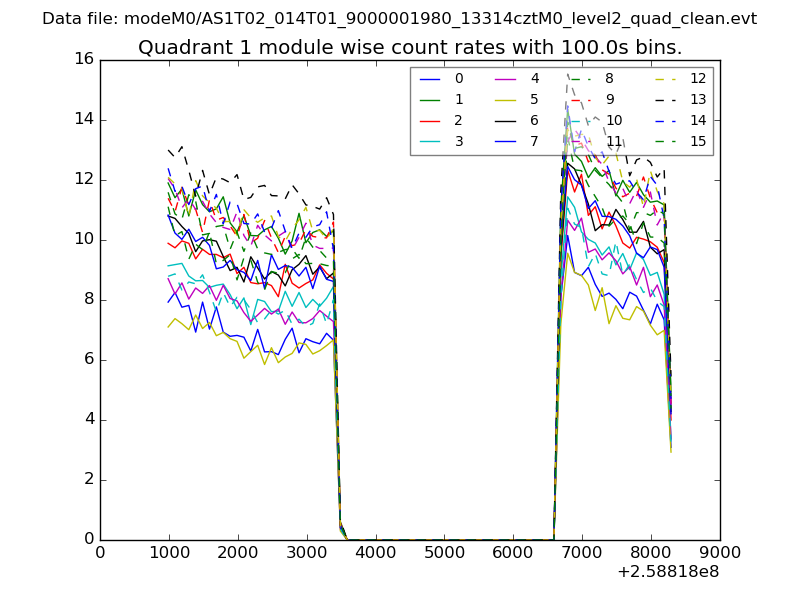
| Module-wise count rates for Quadrant A Data is divided into 100 sec bins |
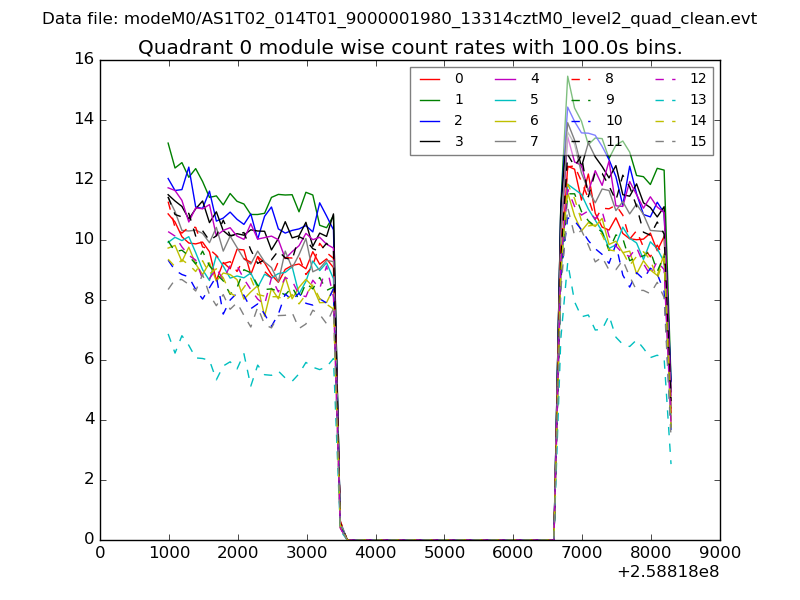 |
 |
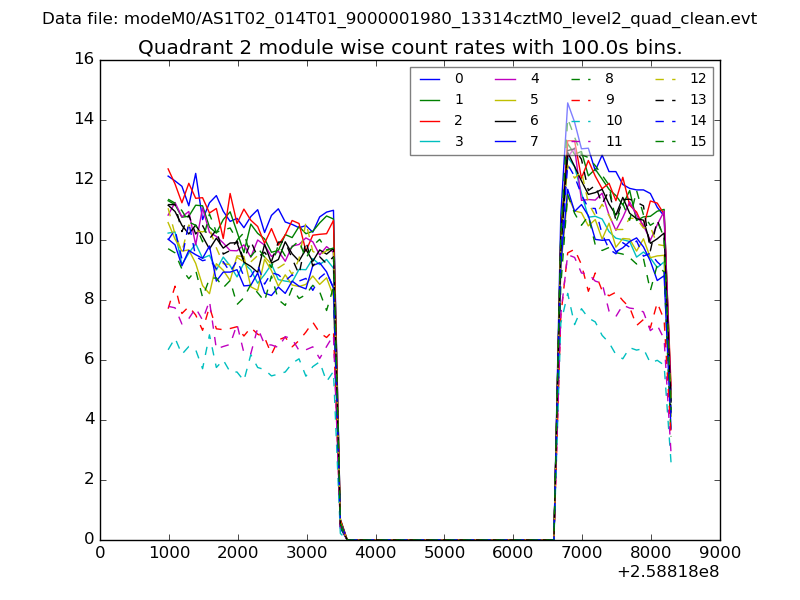
| Module-wise count rates for Quadrant B Data is divided into 100 sec bins |
 |
 |
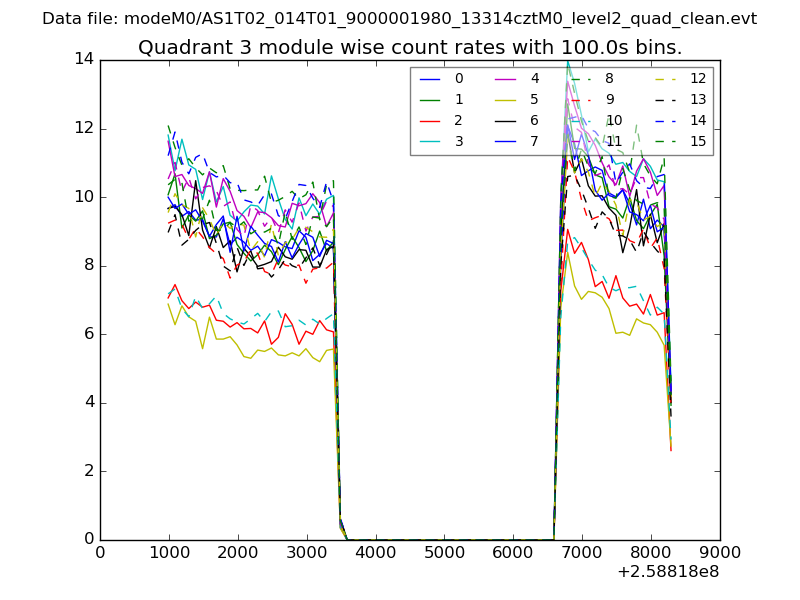
| Module-wise count rates for Quadrant C Data is divided into 100 sec bins |
 |
 |
| Module-wise count rates for Quadrant D Data is divided into 100 sec bins |
 |
 |
| Parameter | Plot |
|---|---|
| CZT HV Monitor | 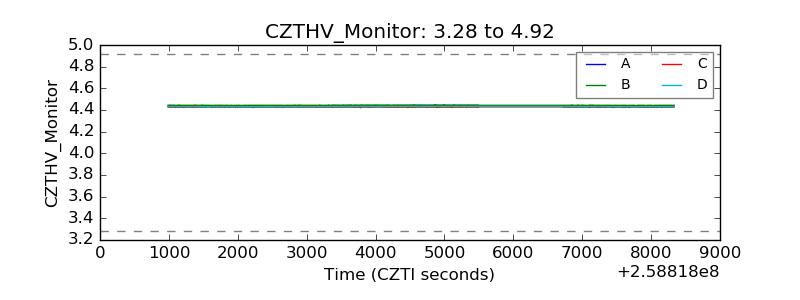 |
| D_VDD | 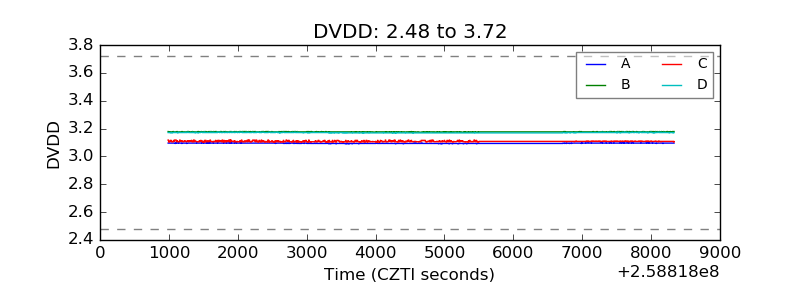 |
| Temperature 1 | 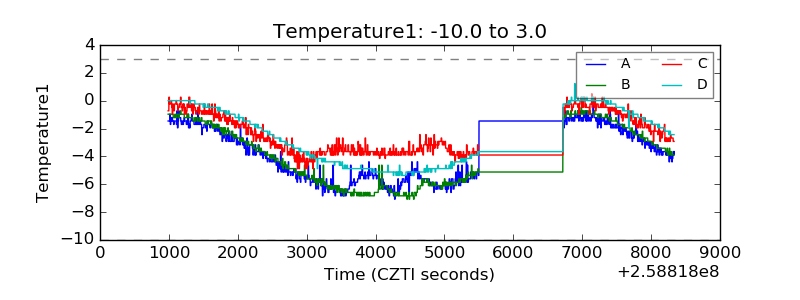 |
| Veto HV Monitor | 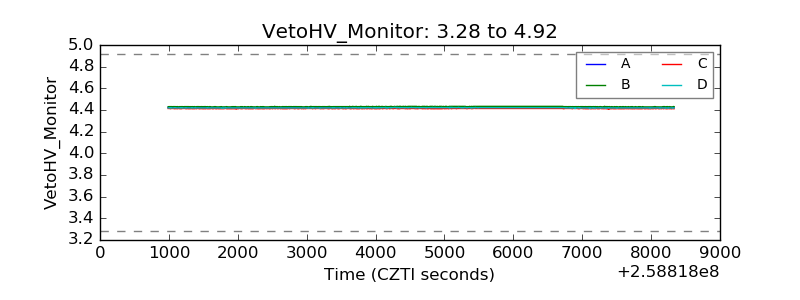 |
| Veto LLD | 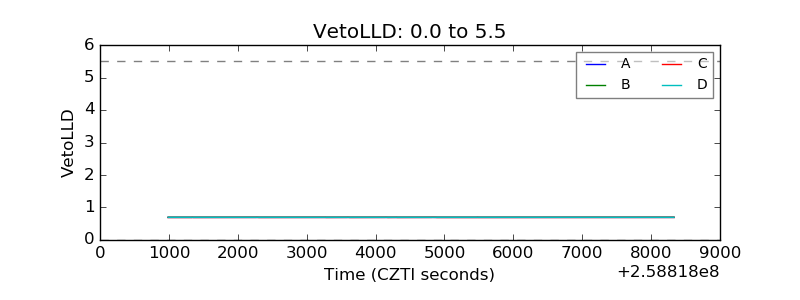 |
| Alpha Counter | 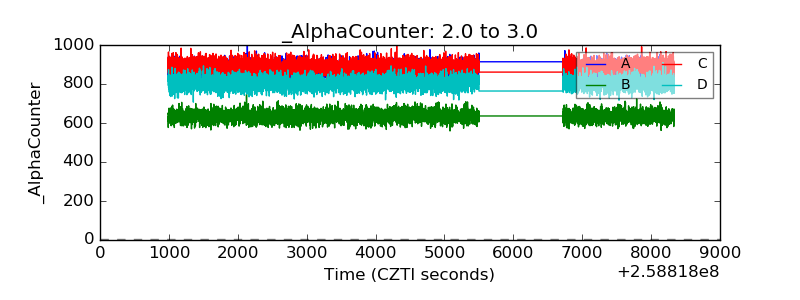 |
| _CPM_Rate | 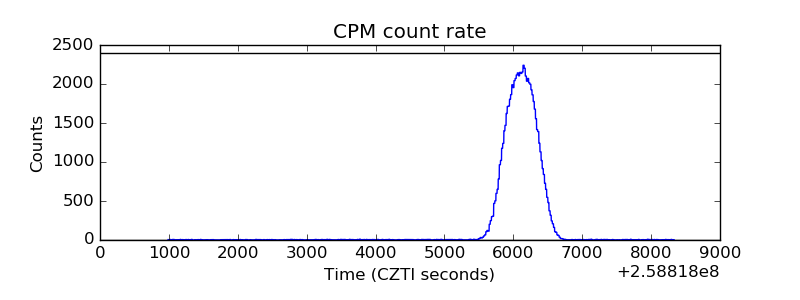 |
| CZT Counter | 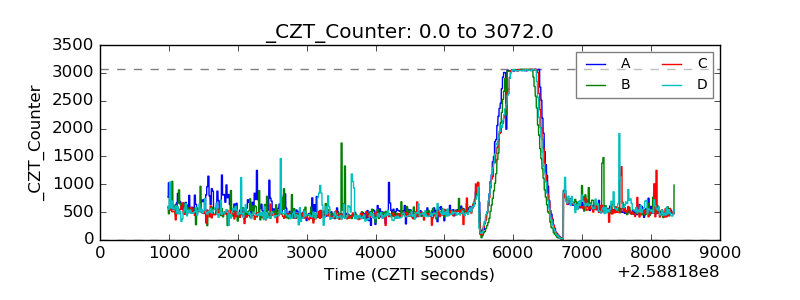 |
| +2.5 Volts monitor |  |
| +5 Volts monitor |  |
| _ROLL_ROT | 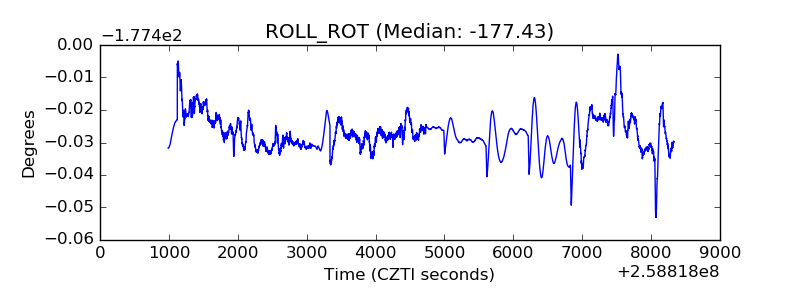 |
| _Roll_DEC | 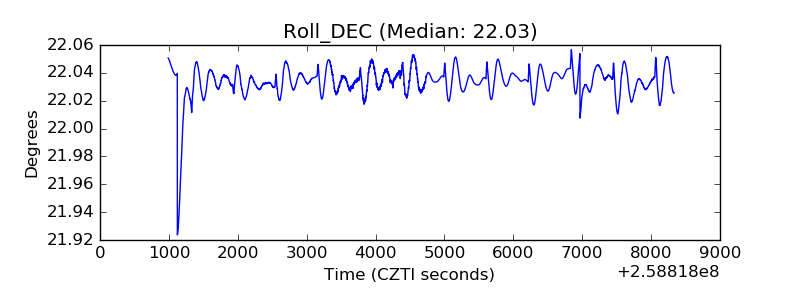 |
| _Roll_RA | 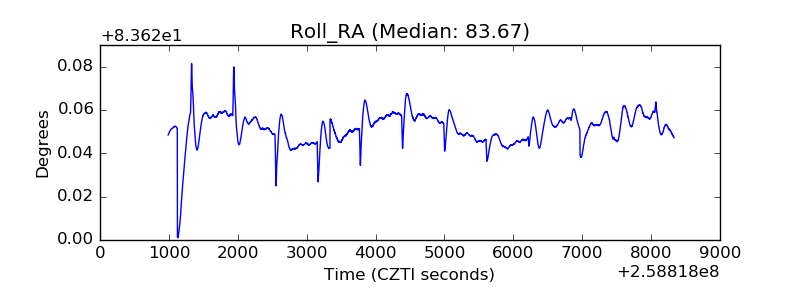 |
| Veto Counter | 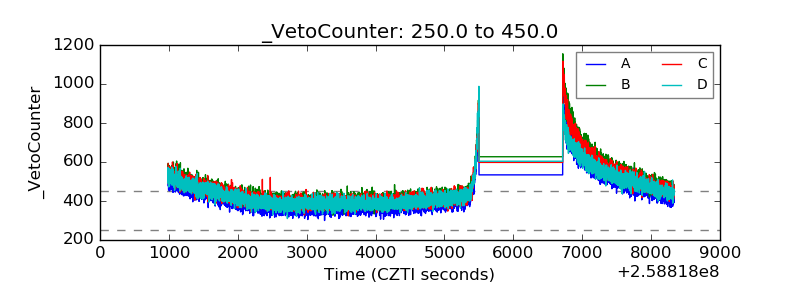 |