| Param | Original file | Final file |
|---|---|---|
| Filename | modeM0/AS1G08_082T01_9000001986cztM0_level2.fits | modeM0/AS1G08_082T01_9000001986cztM0_level2_quad_clean.evt |
| Size (bytes) | 1,593,783,360 | 1,620,031,680 |
| Size | 1.5 GB | 1.5 GB |
| Events in quadrant A | 9,755,218 | 9,857,049 |
| Events in quadrant B | 9,444,696 | 9,964,337 |
| Events in quadrant C | 9,520,888 | 9,331,752 |
| Events in quadrant D | 8,153,430 | 8,519,793 |
| Mode M9 | |||
|---|---|---|---|
| Quadrant | BADHDUFLAG | Total packets | Discarded packets |
| A | 0 | 272 | 0 |
| B | 0 | 272 | 0 |
| C | 0 | 272 | 0 |
| D | 0 | 273 | 0 |
| Mode M0 | |||
|---|---|---|---|
| Quadrant | BADHDUFLAG | Total packets | Discarded packets |
| A | 0 | 348651 | 0 |
| B | 0 | 358495 | 0 |
| C | 0 | 352097 | 0 |
| D | 0 | 395400 | 0 |
| Mode SS | |||
|---|---|---|---|
| Quadrant | BADHDUFLAG | Total packets | Discarded packets |
| A | 0 | 3390 | 0 |
| B | 0 | 3390 | 0 |
| C | 0 | 3390 | 0 |
| D | 0 | 3390 | 0 |
| Quadrant | Total seconds | Saturated seconds | Saturation percentage |
|---|---|---|---|
| A | 166302 | 1787 | 1.074551% |
| B | 166302 | 2445 | 1.470217% |
| C | 166302 | 1553 | 0.933843% |
| D | 166302 | 4122 | 2.478623% |
Noise dominated data is calculated using 1-second bins in cleaned event files. If a bin has >2000 counts, and if more than 50% of those come from <1% of pixels, then it is considered to be noise-dominated and hence unusable.
| Quadrant | # 1 sec bins | Bins with >0 counts | Bins with >2000 counts | High rate bins dominated by noise | Noise dominated (total time) | Noise dominated (detector-on time) | Marked lightcurve |
|---|---|---|---|---|---|---|---|
| A | 197765 | 166301 | 0 | 0 | 0.00% | 0.00% |  |
| B | 197765 | 166301 | 0 | 0 | 0.00% | 0.00% |  |
| C | 197764 | 166295 | 0 | 0 | 0.00% | 0.00% | 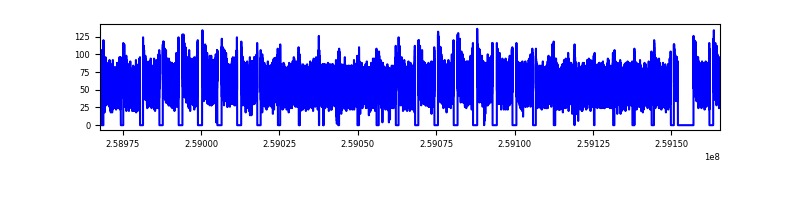 |
| D | 197765 | 166291 | 0 | 0 | 0.00% | 0.00% |  |
Top three noisy pixels from each quadrant. If the there are fewer than three noisy pixels in the level2.evt file, extra rows are filled as -1
| Pixel properties | Quadrant properties | ||||||
|---|---|---|---|---|---|---|---|
| Quadrant | DetID | PixID | Counts | Sigma | Mean | Median | Sigma |
| A | 0 | 29 | 9314 | 11.06 | 2537 | 2372 | 627.8 |
| A | 7 | 110 | 7952 | 8.89 | 2537 | 2372 | 627.8 |
| A | 9 | 19 | 7170 | 7.64 | 2537 | 2372 | 627.8 |
| B | 2 | 9 | 8069 | 11.75 | 2492 | 2379 | 484.3 |
| B | 3 | 17 | 6221 | 7.93 | 2492 | 2379 | 484.3 |
| B | 5 | 128 | 6198 | 7.89 | 2492 | 2379 | 484.3 |
| C | 1 | 81 | 7186 | 7.46 | 2515 | 2336 | 650.3 |
| C | 1 | 80 | 7101 | 7.33 | 2515 | 2336 | 650.3 |
| C | 12 | 241 | 6626 | 6.6 | 2515 | 2336 | 650.3 |
| D | 6 | 231 | 5848 | 6.06 | 2329 | 2122 | 615.0 |
| D | 10 | 189 | 5706 | 5.83 | 2329 | 2122 | 615.0 |
| D | 6 | 67 | 5591 | 5.64 | 2329 | 2122 | 615.0 |
Histogram calculated using DETX and DETY for each event in the final _common_clean file
| Quadrant A |  |
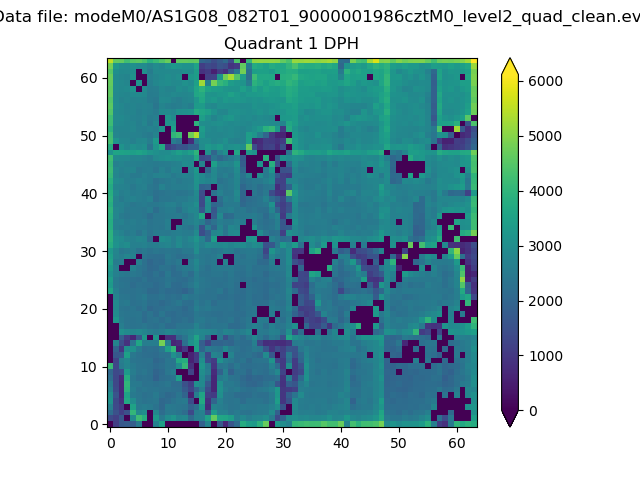 |
Quadrant B |
|---|---|---|---|
| Quadrant D |  |
 |
Quadrant C |
| Plot type | Count rate plots | Images |
|---|---|---|
| Comparison with Poisson distribution Blue bars denote a histogram of data divided into 1 sec bins. Red curve is a Poisson curve with rate = median count rate of data. |
 |
 |
| Quadrant-wise count rates Data is divided into 100 sec bins |
 |
|
| Module-wise count rates for Quadrant A Data is divided into 100 sec bins |
 |
 |
| Module-wise count rates for Quadrant B Data is divided into 100 sec bins |
 |
 |
| Module-wise count rates for Quadrant C Data is divided into 100 sec bins |
 |
 |
| Module-wise count rates for Quadrant D Data is divided into 100 sec bins |
 |
 |
| Parameter | Plot |
|---|---|
| CZT HV Monitor |  |
| D_VDD | 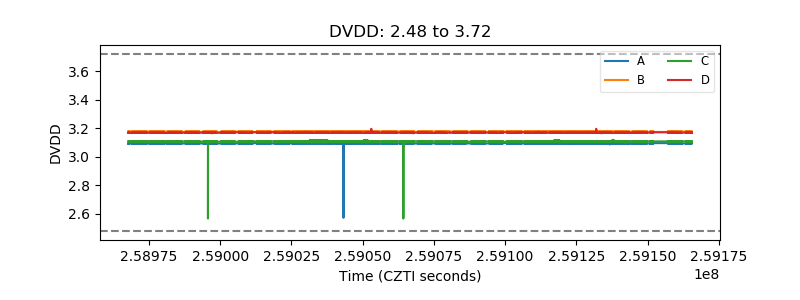 |
| Temperature 1 |  |
| Veto HV Monitor |  |
| Veto LLD |  |
| Alpha Counter | 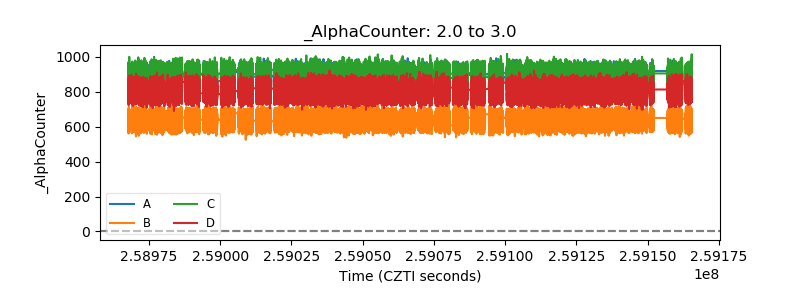 |
| _CPM_Rate |  |
| CZT Counter |  |
| +2.5 Volts monitor | 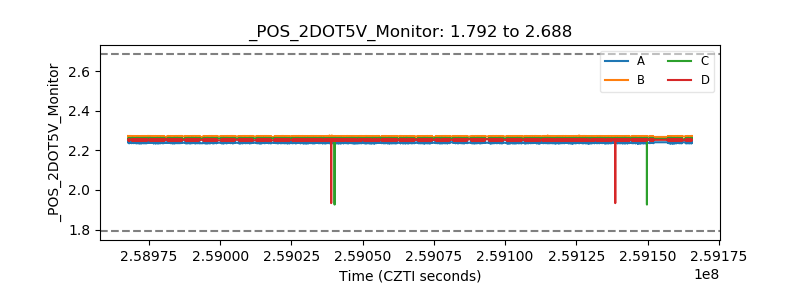 |
| +5 Volts monitor |  |
| _ROLL_ROT |  |
| _Roll_DEC |  |
| _Roll_RA |  |
| Veto Counter |  |