| Param | Original file | Final file |
|---|---|---|
| Filename | modeM0/AS1G08_082T01_9000001986_13342cztM0_level2.evt | modeM0/AS1G08_082T01_9000001986_13342cztM0_level2_quad_clean.evt |
| Size (bytes) | 1,225,995,840 | 212,028,480 |
| Size | 1.1 GB | 202.2 MB |
| Events in quadrant A | 8,531,475 | 1,302,444 |
| Events in quadrant B | 9,560,135 | 1,320,343 |
| Events in quadrant C | 8,682,649 | 1,302,769 |
| Events in quadrant D | 9,122,671 | 1,240,399 |
| Mode M9 | |||
|---|---|---|---|
| Quadrant | BADHDUFLAG | Total packets | Discarded packets |
| A | 0 | 34 | 0 |
| B | 0 | 34 | 0 |
| C | 0 | 34 | 0 |
| D | 0 | 34 | 0 |
| Mode M0 | |||
|---|---|---|---|
| Quadrant | BADHDUFLAG | Total packets | Discarded packets |
| A | 0 | 37710 | 5 |
| B | 0 | 40245 | 4 |
| C | 0 | 37842 | 4 |
| D | 0 | 40116 | 4 |
| Mode SS | |||
|---|---|---|---|
| Quadrant | BADHDUFLAG | Total packets | Discarded packets |
| A | 0 | 374 | 0 |
| B | 0 | 374 | 0 |
| C | 0 | 374 | 0 |
| D | 0 | 374 | 0 |
| Quadrant | Total seconds | Saturated seconds | Saturation percentage |
|---|---|---|---|
| A | 18212 | 232 | 1.273885% |
| B | 18212 | 337 | 1.850428% |
| C | 18212 | 181 | 0.993850% |
| D | 18212 | 393 | 2.157918% |
Noise dominated data is calculated using 1-second bins in cleaned event files. If a bin has >2000 counts, and if more than 50% of those come from <1% of pixels, then it is considered to be noise-dominated and hence unusable.
| Quadrant | # 1 sec bins | Bins with >0 counts | Bins with >2000 counts | High rate bins dominated by noise | Noise dominated (total time) | Noise dominated (detector-on time) | Marked lightcurve |
|---|---|---|---|---|---|---|---|
| A | 21668 | 18217 | 0 | 0 | 0.00% | 0.00% | 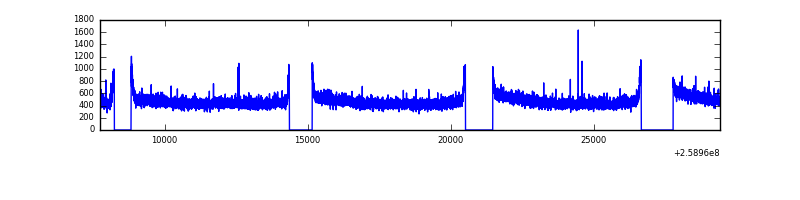 |
| B | 21668 | 18217 | 64 | 64 | 0.30% | 0.35% | 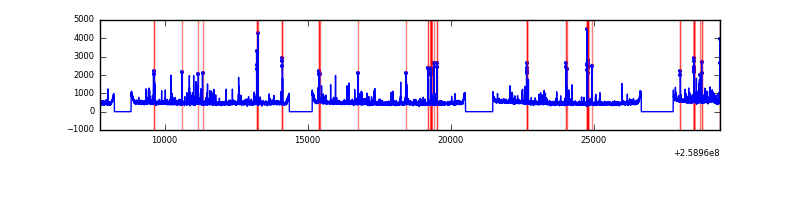 |
| C | 21668 | 18217 | 2 | 2 | 0.01% | 0.01% | 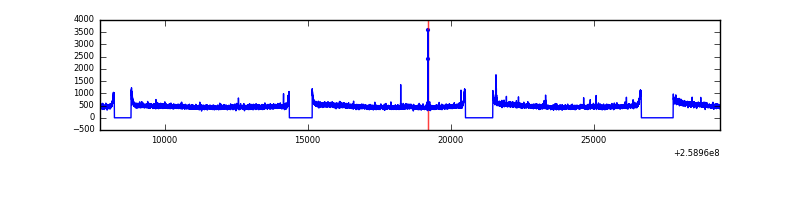 |
| D | 21668 | 18217 | 199 | 199 | 0.92% | 1.09% | 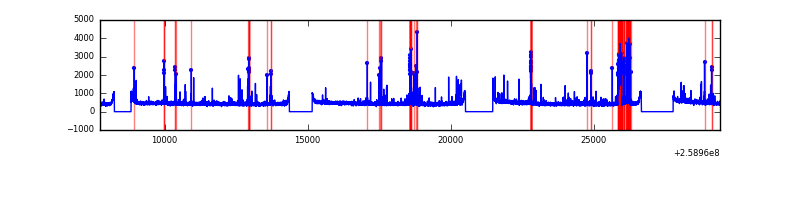 |
Top three noisy pixels from each quadrant. If the there are fewer than three noisy pixels in the level2.evt file, extra rows are filled as -1
| Pixel properties | Quadrant properties | ||||||
|---|---|---|---|---|---|---|---|
| Quadrant | DetID | PixID | Counts | Sigma | Mean | Median | Sigma |
| A | 8 | 15 | 31575 | 66.64 | 2198 | 2146 | 441.6 |
| A | 1 | 162 | 31413 | 66.28 | 2198 | 2146 | 441.6 |
| A | 0 | 226 | 19223 | 38.67 | 2198 | 2146 | 441.6 |
| B | 10 | 245 | 364612 | 869.46 | 2198 | 2142 | 416.9 |
| B | 3 | 64 | 269979 | 642.46 | 2198 | 2142 | 416.9 |
| B | 0 | 230 | 109979 | 258.67 | 2198 | 2142 | 416.9 |
| C | 3 | 233 | 310565 | 626.86 | 2141 | 2151 | 492.0 |
| C | 14 | 234 | 28615 | 53.79 | 2141 | 2151 | 492.0 |
| C | 13 | 61 | 15423 | 26.98 | 2141 | 2151 | 492.0 |
| D | 5 | 222 | 443039 | 871.97 | 2121 | 2058 | 505.7 |
| D | 1 | 52 | 242894 | 476.22 | 2121 | 2058 | 505.7 |
| D | 14 | 34 | 182450 | 356.7 | 2121 | 2058 | 505.7 |
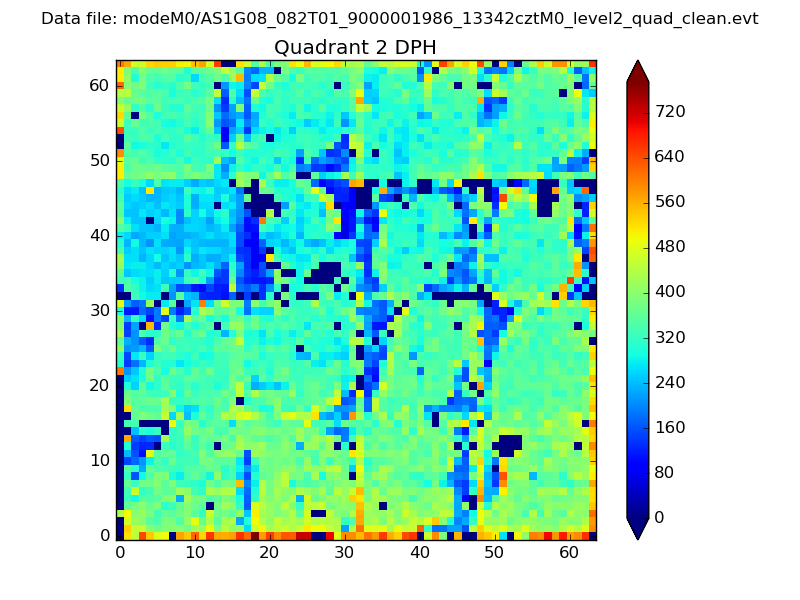
Histogram calculated using DETX and DETY for each event in the final _common_clean file
| Quadrant A |  |
 |
Quadrant B |
|---|---|---|---|
| Quadrant D |  |
 |
Quadrant C |
| Plot type | Count rate plots | Images |
|---|---|---|
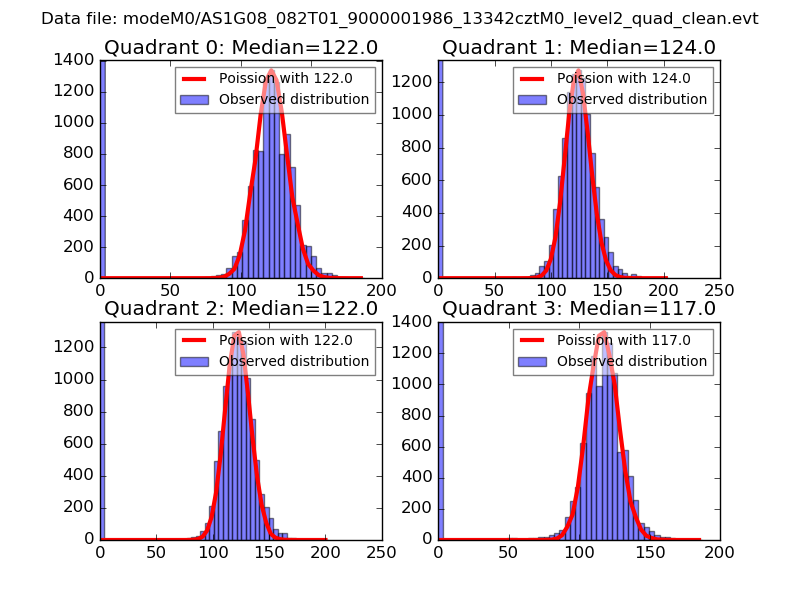
| Comparison with Poisson distribution Blue bars denote a histogram of data divided into 1 sec bins. Red curve is a Poisson curve with rate = median count rate of data. |
 |
 |
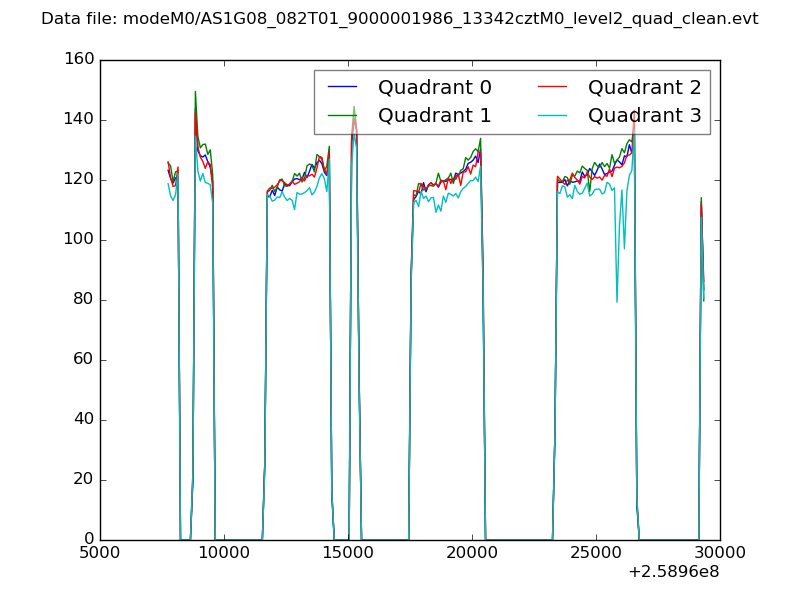
| Quadrant-wise count rates Data is divided into 100 sec bins |
 |
|
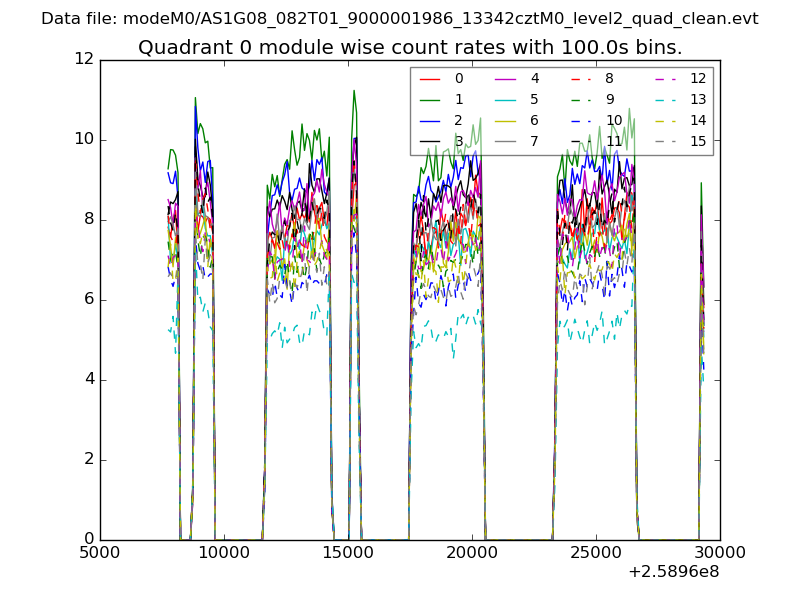
| Module-wise count rates for Quadrant A Data is divided into 100 sec bins |
 |
 |
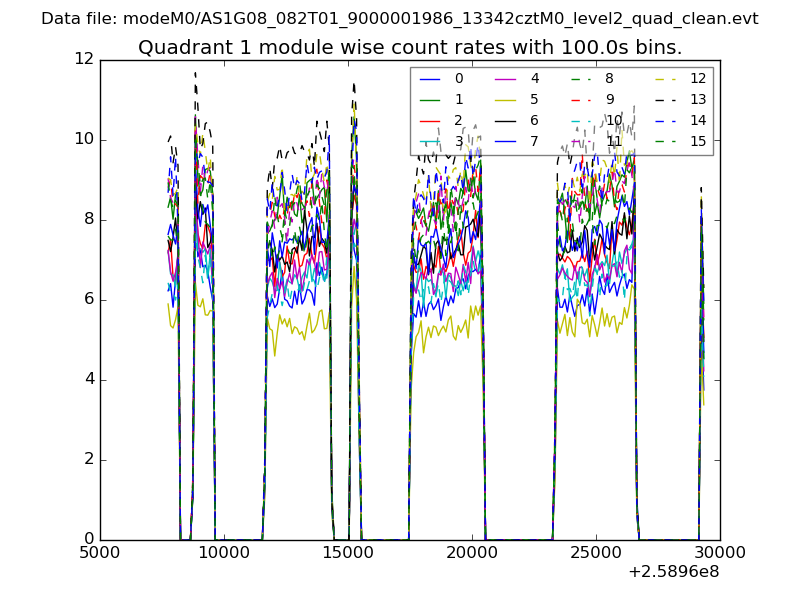
| Module-wise count rates for Quadrant B Data is divided into 100 sec bins |
 |
 |
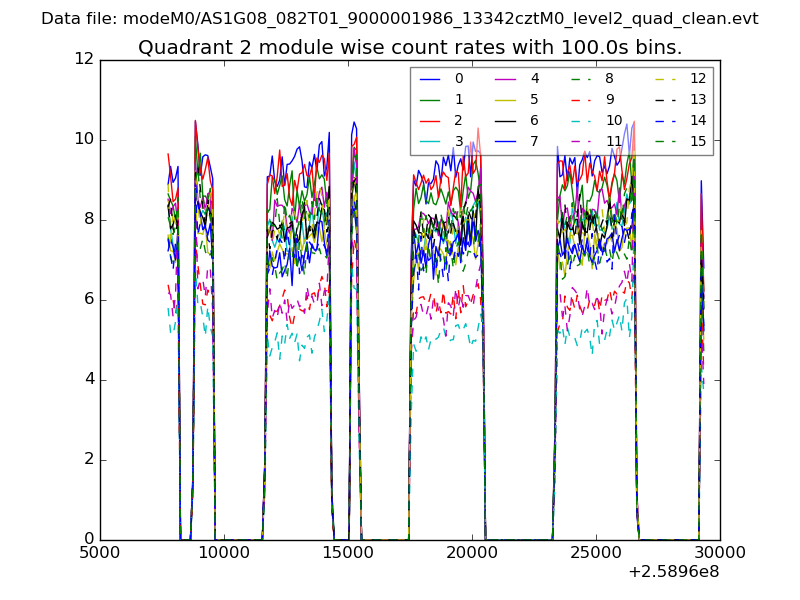
| Module-wise count rates for Quadrant C Data is divided into 100 sec bins |
 |
 |
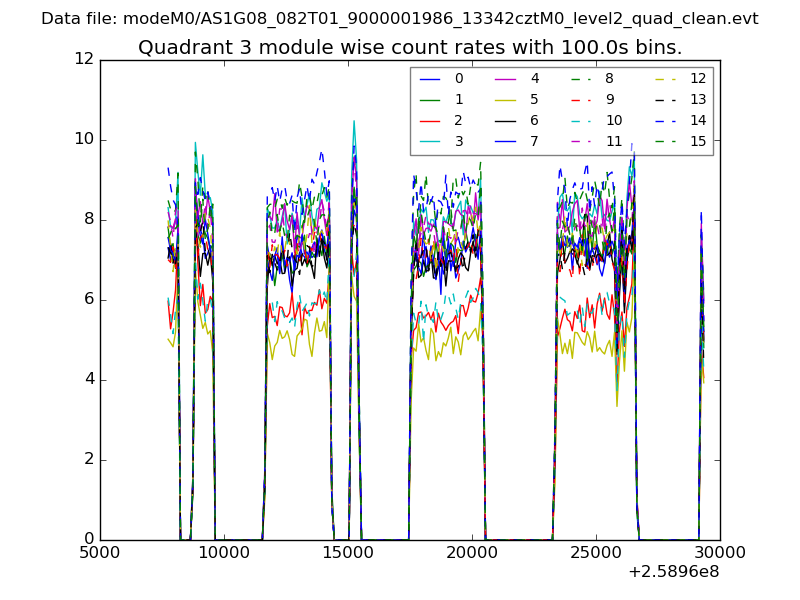
| Module-wise count rates for Quadrant D Data is divided into 100 sec bins |
 |
 |
| Parameter | Plot |
|---|---|
| CZT HV Monitor | 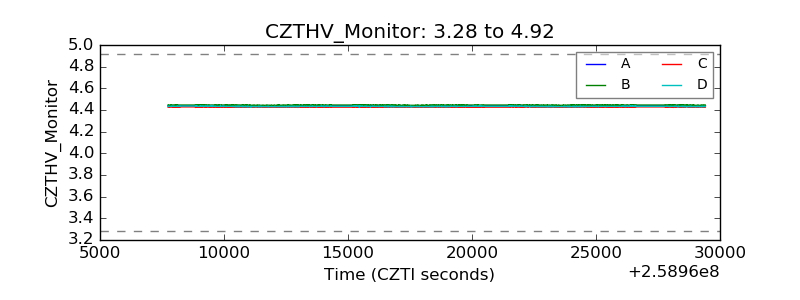 |
| D_VDD |  |
| Temperature 1 | 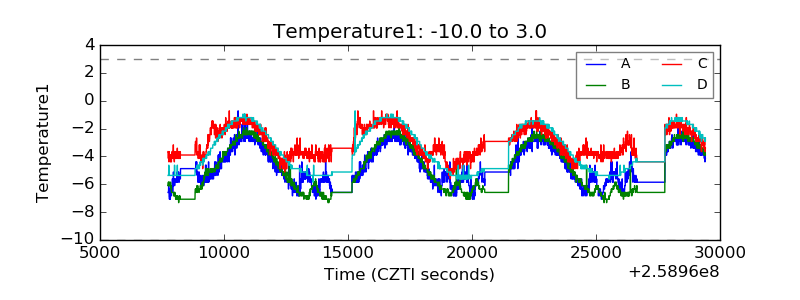 |
| Veto HV Monitor | 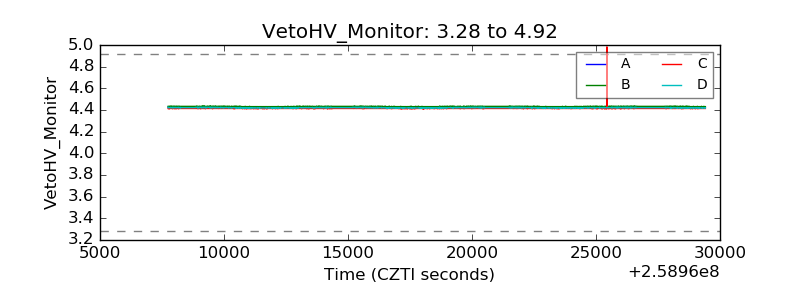 |
| Veto LLD | 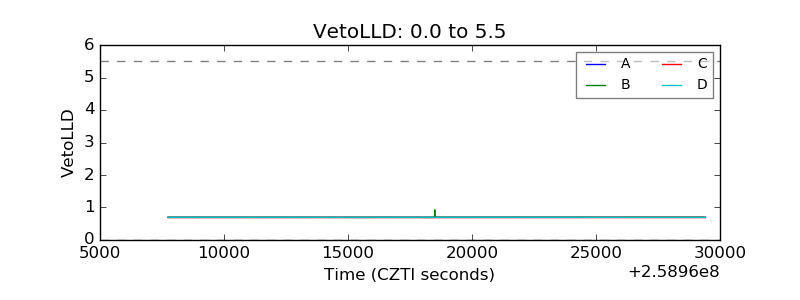 |
| Alpha Counter | 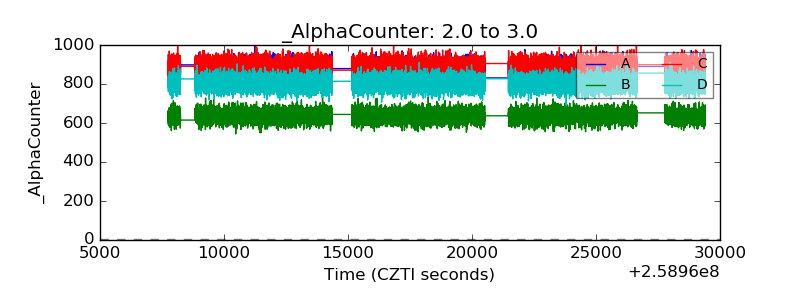 |
| _CPM_Rate | 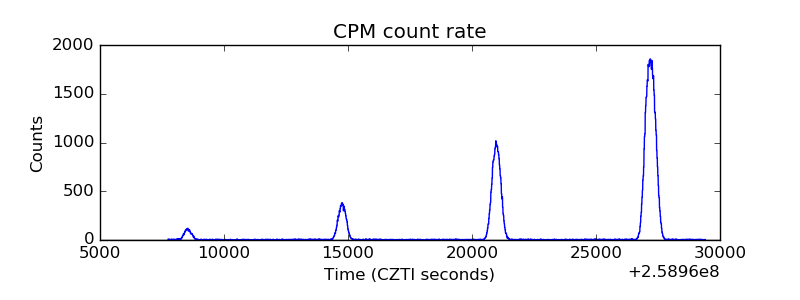 |
| CZT Counter | 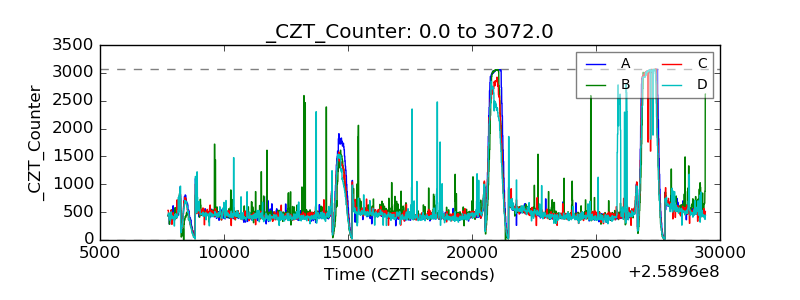 |
| +2.5 Volts monitor | 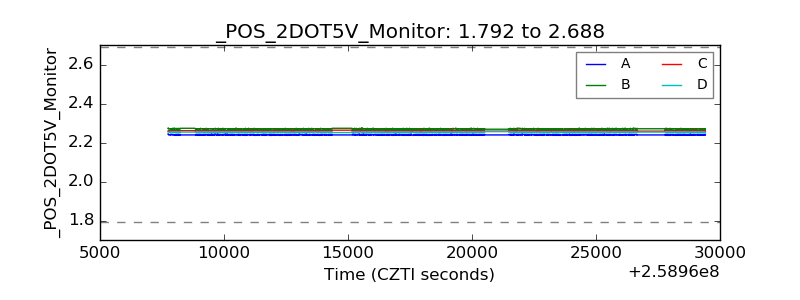 |
| +5 Volts monitor |  |
| _ROLL_ROT | 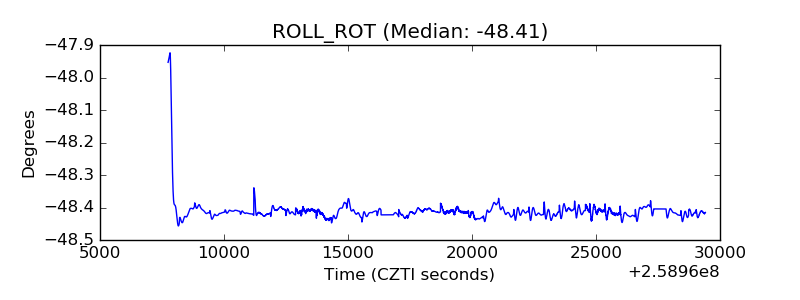 |
| _Roll_DEC | 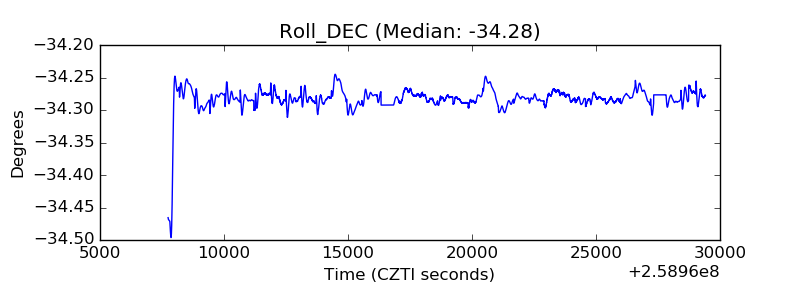 |
| _Roll_RA | 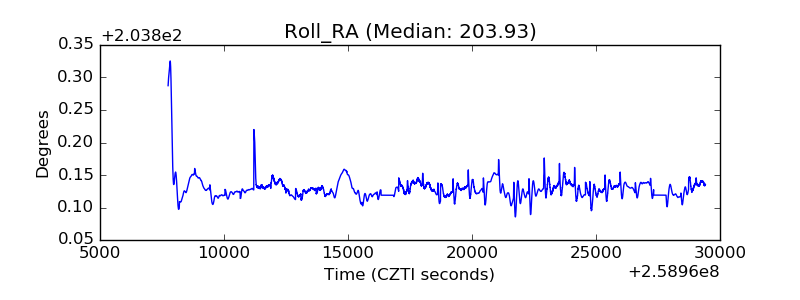 |
| Veto Counter | 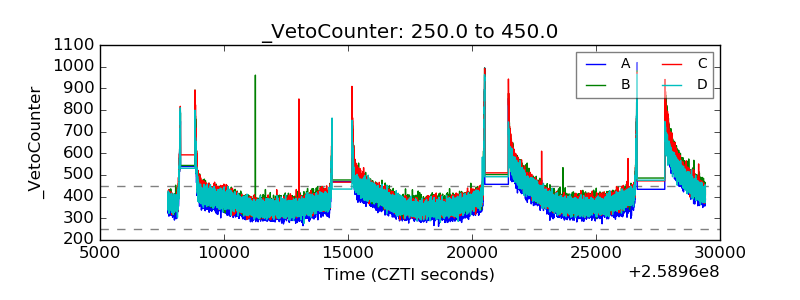 |