| Param | Original file | Final file |
|---|---|---|
| Filename | modeM0/AS1G08_082T01_9000001986_13343cztM0_level2.evt | modeM0/AS1G08_082T01_9000001986_13343cztM0_level2_quad_clean.evt |
| Size (bytes) | 473,863,680 | 85,924,800 |
| Size | 451.9 MB | 81.9 MB |
| Events in quadrant A | 3,333,697 | 542,786 |
| Events in quadrant B | 4,011,249 | 548,398 |
| Events in quadrant C | 3,297,029 | 535,417 |
| Events in quadrant D | 3,258,918 | 513,363 |
| Mode M9 | |||
|---|---|---|---|
| Quadrant | BADHDUFLAG | Total packets | Discarded packets |
| A | 0 | 12 | 0 |
| B | 0 | 12 | 0 |
| C | 0 | 12 | 0 |
| D | 0 | 12 | 0 |
| Mode M0 | |||
|---|---|---|---|
| Quadrant | BADHDUFLAG | Total packets | Discarded packets |
| A | 0 | 14287 | 2 |
| B | 0 | 16438 | 1 |
| C | 0 | 14138 | 1 |
| D | 0 | 14309 | 1 |
| Mode SS | |||
|---|---|---|---|
| Quadrant | BADHDUFLAG | Total packets | Discarded packets |
| A | 0 | 134 | 0 |
| B | 0 | 134 | 0 |
| C | 0 | 134 | 0 |
| D | 0 | 134 | 0 |
| Quadrant | Total seconds | Saturated seconds | Saturation percentage |
|---|---|---|---|
| A | 6629 | 71 | 1.071051% |
| B | 6629 | 204 | 3.077387% |
| C | 6629 | 48 | 0.724091% |
| D | 6629 | 55 | 0.829688% |
Noise dominated data is calculated using 1-second bins in cleaned event files. If a bin has >2000 counts, and if more than 50% of those come from <1% of pixels, then it is considered to be noise-dominated and hence unusable.
| Quadrant | # 1 sec bins | Bins with >0 counts | Bins with >2000 counts | High rate bins dominated by noise | Noise dominated (total time) | Noise dominated (detector-on time) | Marked lightcurve |
|---|---|---|---|---|---|---|---|
| A | 7850 | 6631 | 0 | 0 | 0.00% | 0.00% | 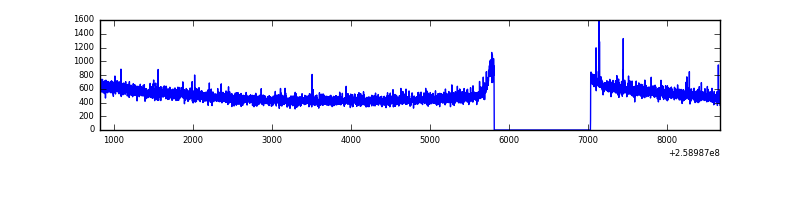 |
| B | 7850 | 6631 | 85 | 85 | 1.08% | 1.28% |  |
| C | 7850 | 6631 | 0 | 0 | 0.00% | 0.00% | 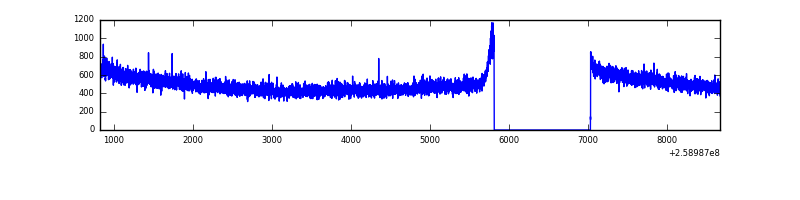 |
| D | 7850 | 6631 | 5 | 5 | 0.06% | 0.08% | 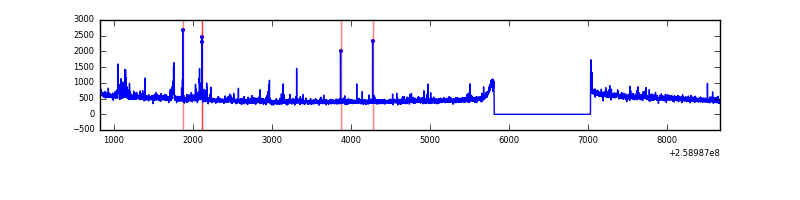 |
Top three noisy pixels from each quadrant. If the there are fewer than three noisy pixels in the level2.evt file, extra rows are filled as -1
| Pixel properties | Quadrant properties | ||||||
|---|---|---|---|---|---|---|---|
| Quadrant | DetID | PixID | Counts | Sigma | Mean | Median | Sigma |
| A | 1 | 162 | 14015 | 76.74 | 859 | 841 | 171.7 |
| A | 8 | 15 | 8662 | 45.56 | 859 | 841 | 171.7 |
| A | 0 | 226 | 7696 | 39.93 | 859 | 841 | 171.7 |
| B | 3 | 64 | 251006 | 1571.19 | 853 | 833 | 159.2 |
| B | 10 | 245 | 213118 | 1333.23 | 853 | 833 | 159.2 |
| B | 0 | 230 | 160891 | 1005.23 | 853 | 833 | 159.2 |
| C | 3 | 233 | 92818 | 490.9 | 821 | 827 | 187.4 |
| C | 13 | 61 | 5957 | 27.38 | 821 | 827 | 187.4 |
| C | 14 | 234 | 2162 | 7.12 | 821 | 827 | 187.4 |
| D | 2 | 136 | 49856 | 251.63 | 818 | 796 | 195.0 |
| D | 1 | 52 | 47721 | 240.68 | 818 | 796 | 195.0 |
| D | 2 | 234 | 24176 | 119.92 | 818 | 796 | 195.0 |
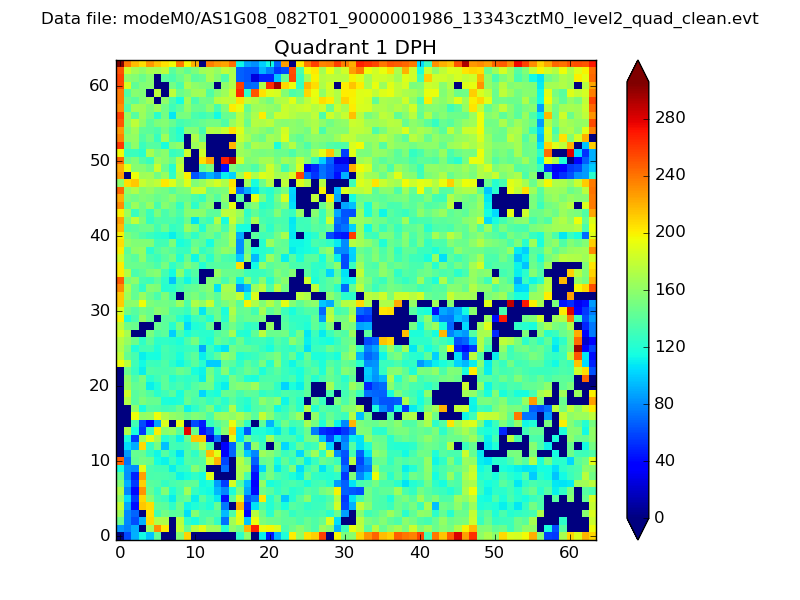
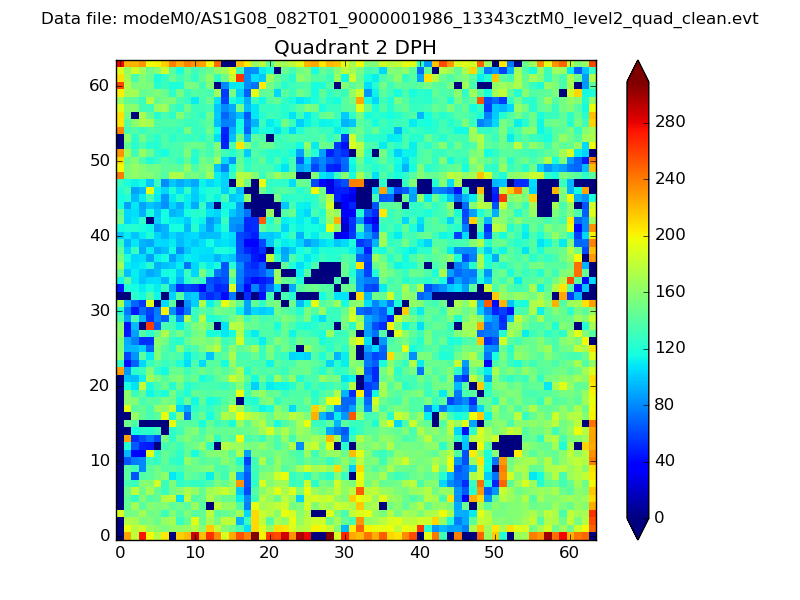
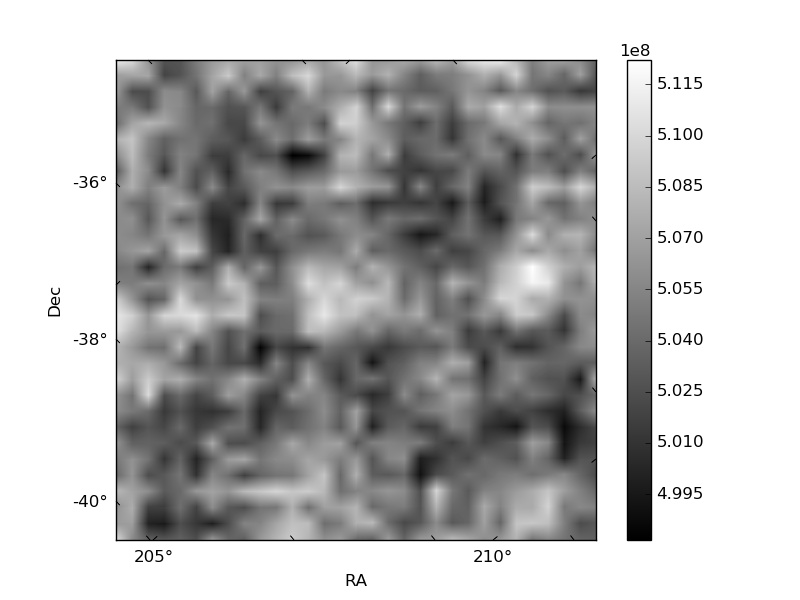
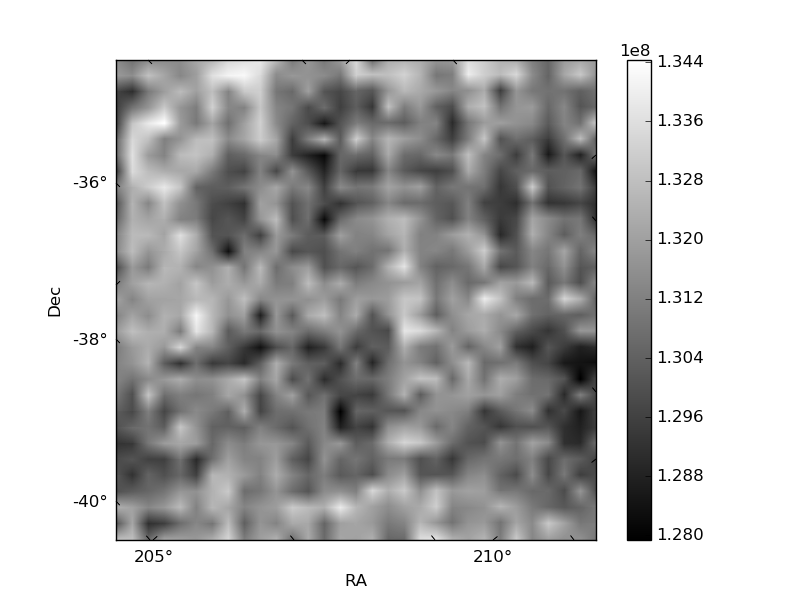
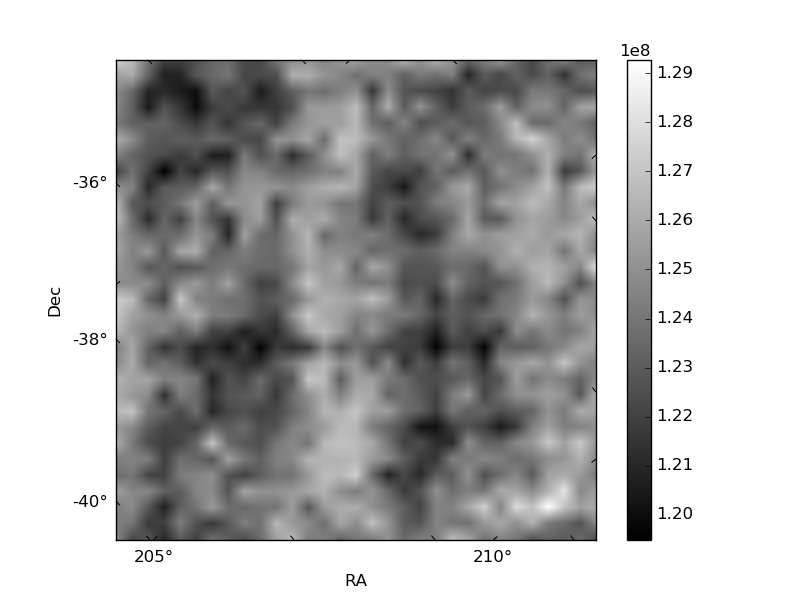
Histogram calculated using DETX and DETY for each event in the final _common_clean file
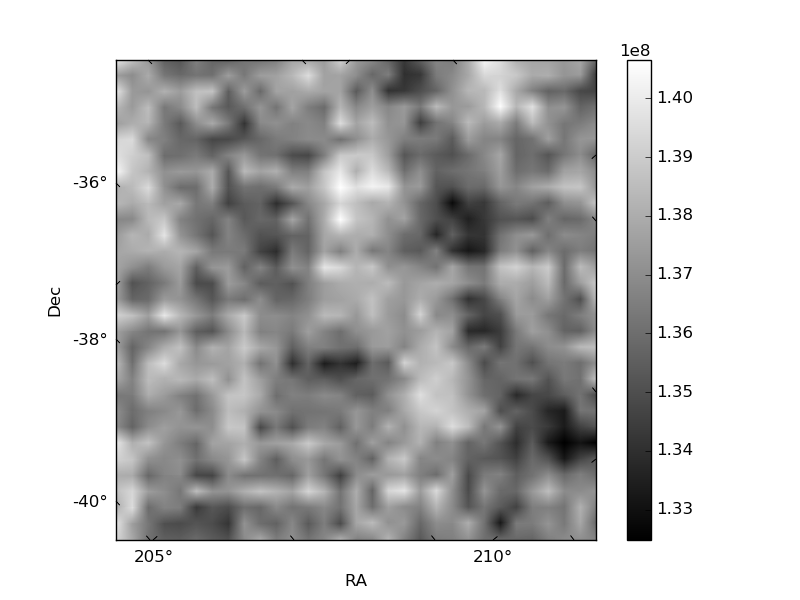
| Quadrant A | 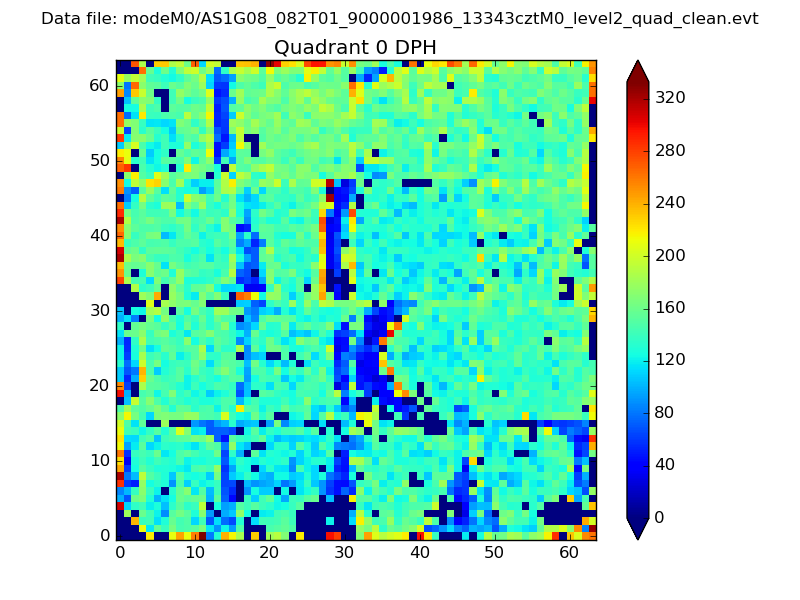 |
 |
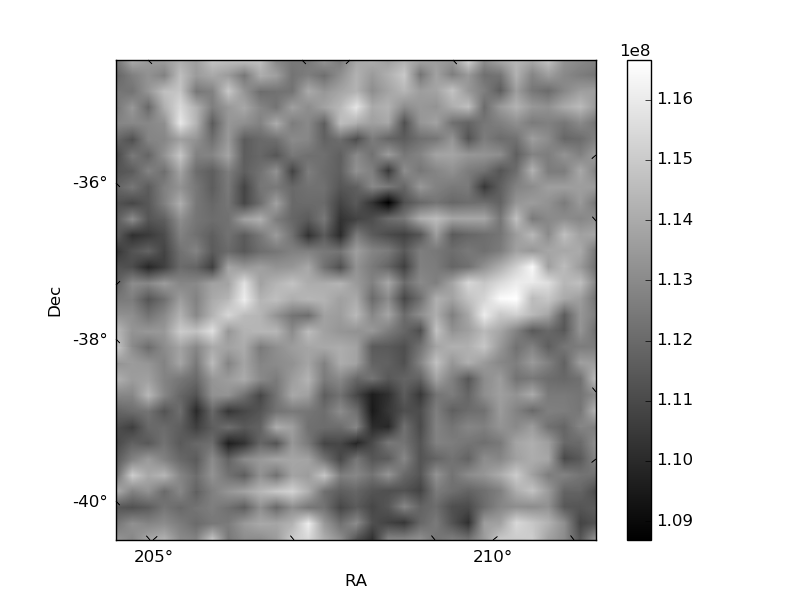
Quadrant B |
|---|---|---|---|
| Quadrant D | 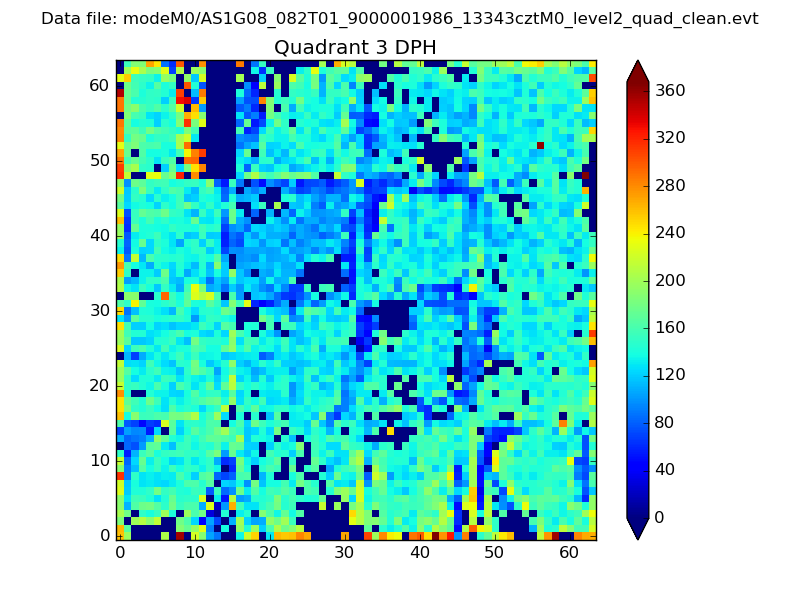 |
 |
Quadrant C |
| Plot type | Count rate plots | Images |
|---|---|---|
| Comparison with Poisson distribution Blue bars denote a histogram of data divided into 1 sec bins. Red curve is a Poisson curve with rate = median count rate of data. |
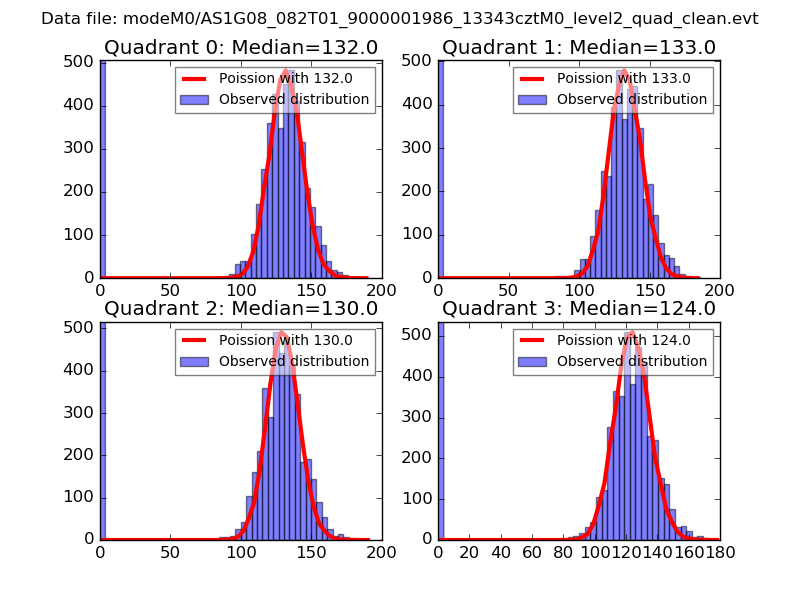 |
 |
| Quadrant-wise count rates Data is divided into 100 sec bins |
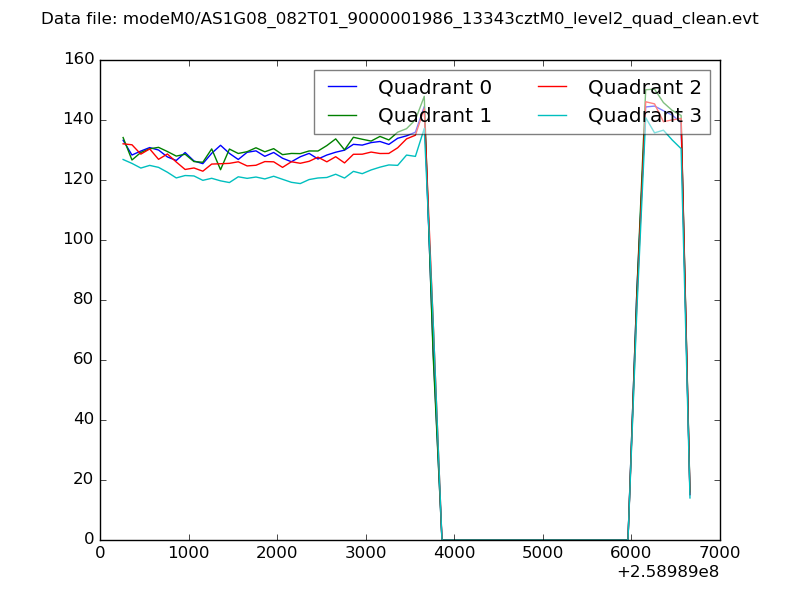 |
|
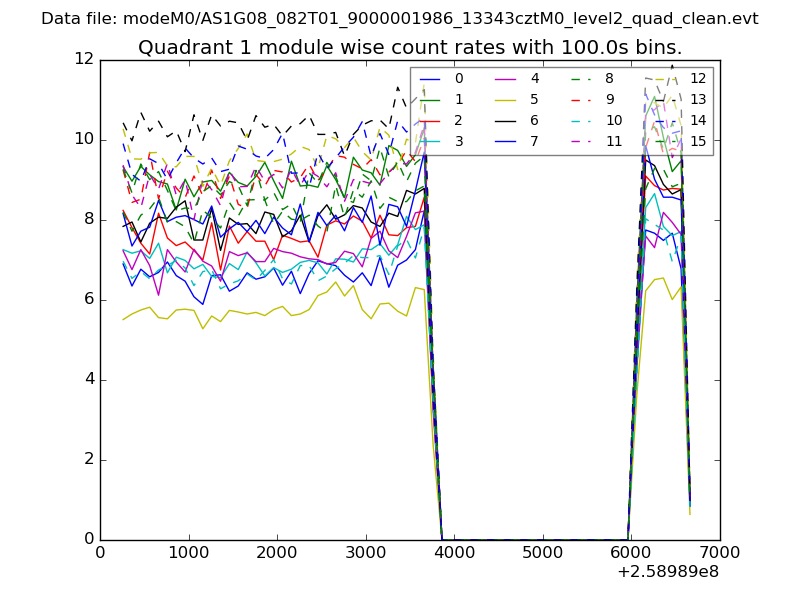
| Module-wise count rates for Quadrant A Data is divided into 100 sec bins |
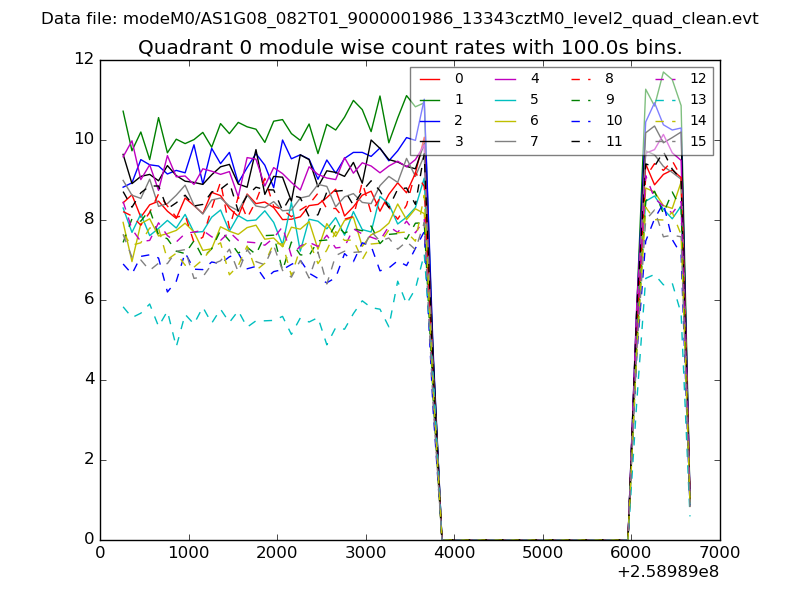 |
 |
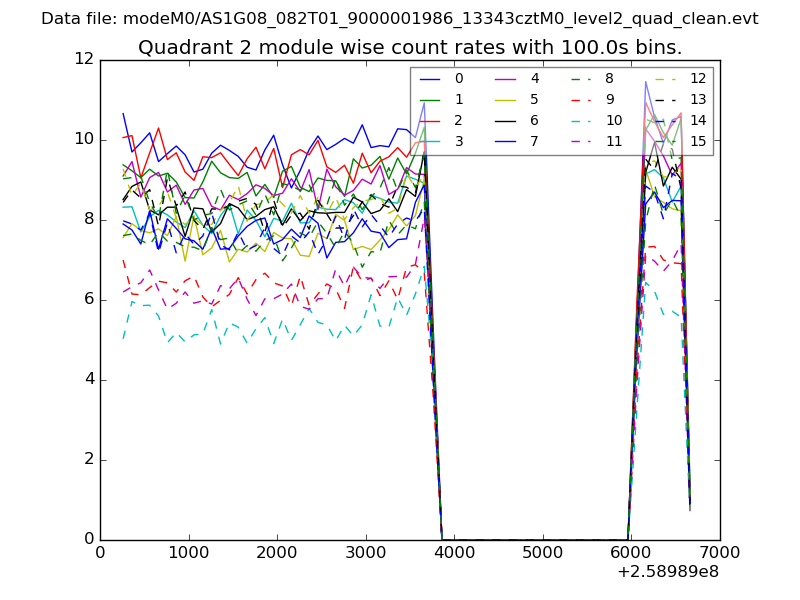
| Module-wise count rates for Quadrant B Data is divided into 100 sec bins |
 |
 |
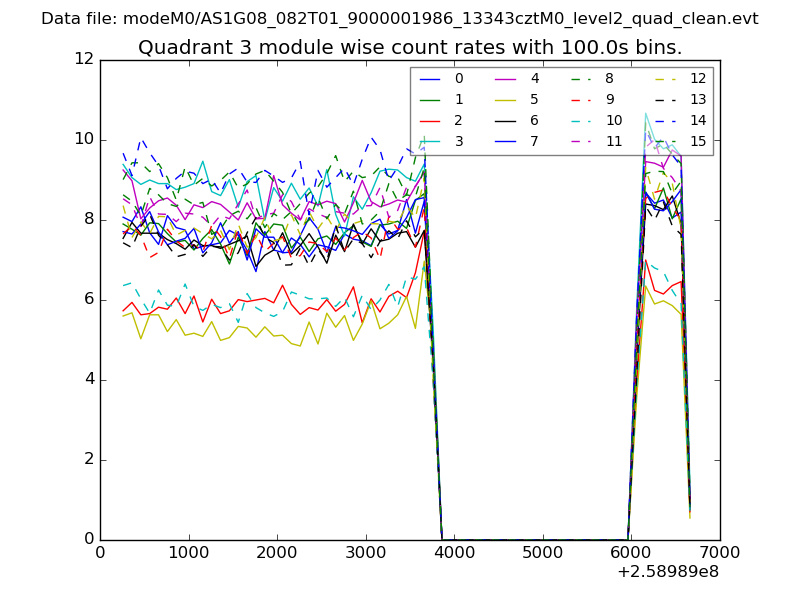
| Module-wise count rates for Quadrant C Data is divided into 100 sec bins |
 |
 |
| Module-wise count rates for Quadrant D Data is divided into 100 sec bins |
 |
 |
| Parameter | Plot |
|---|---|
| CZT HV Monitor | 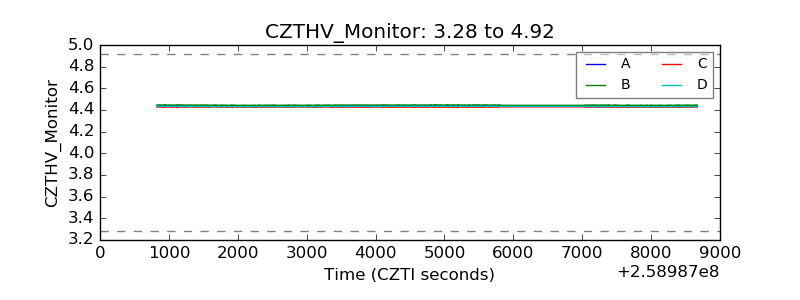 |
| D_VDD | 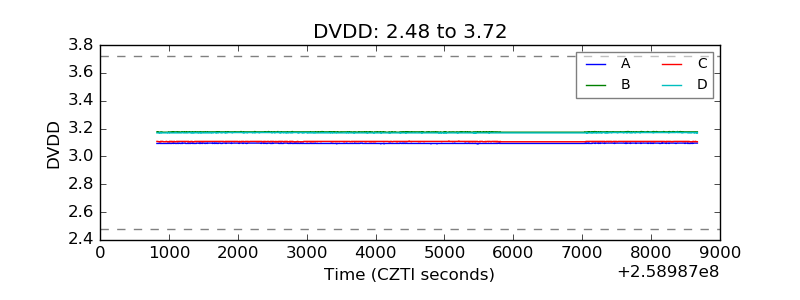 |
| Temperature 1 | 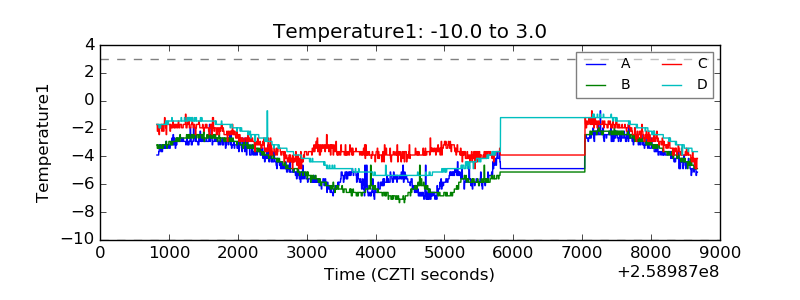 |
| Veto HV Monitor | 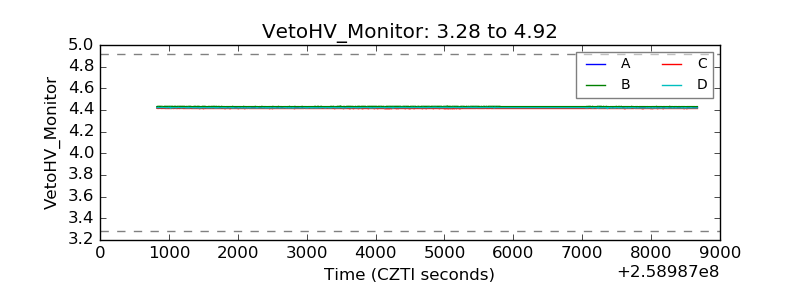 |
| Veto LLD | 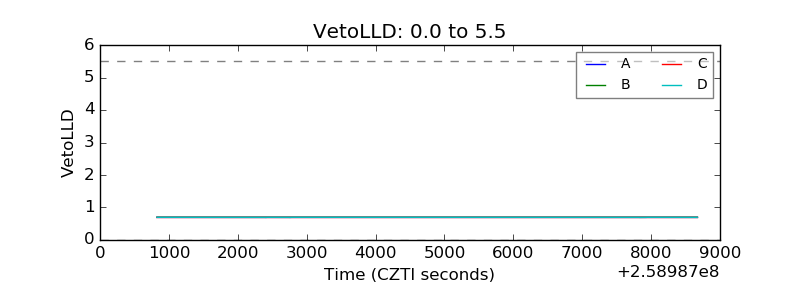 |
| Alpha Counter | 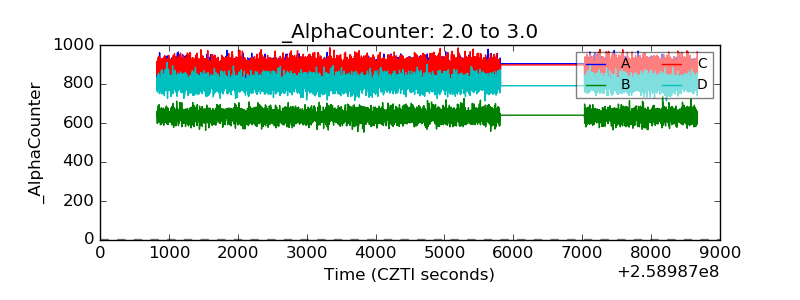 |
| _CPM_Rate | 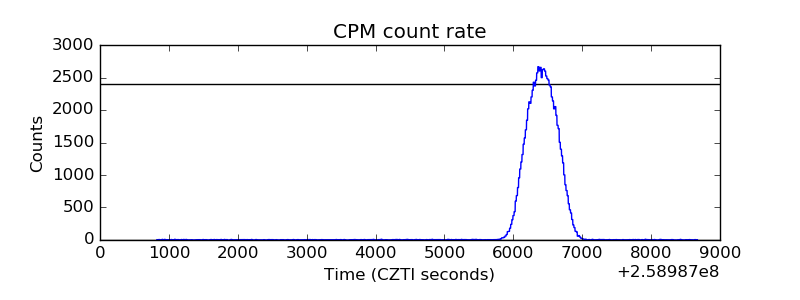 |
| CZT Counter | 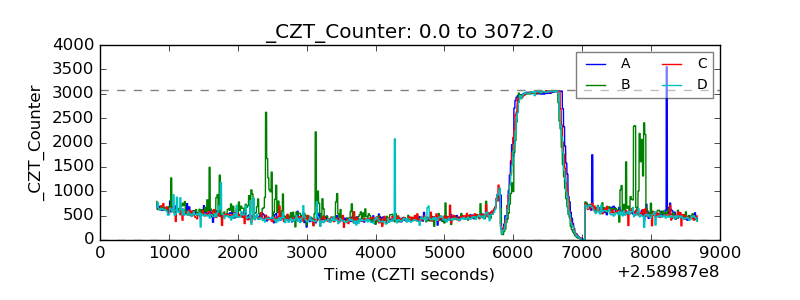 |
| +2.5 Volts monitor |  |
| +5 Volts monitor |  |
| _ROLL_ROT | 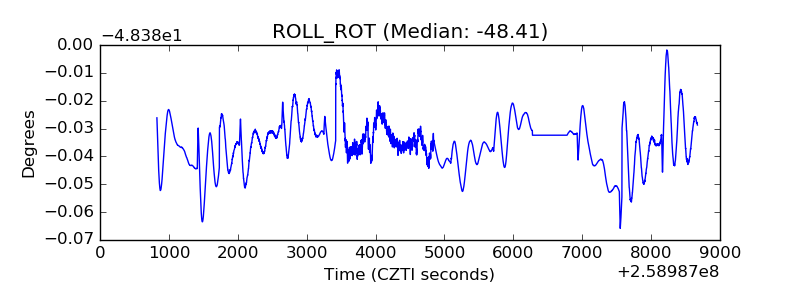 |
| _Roll_DEC | 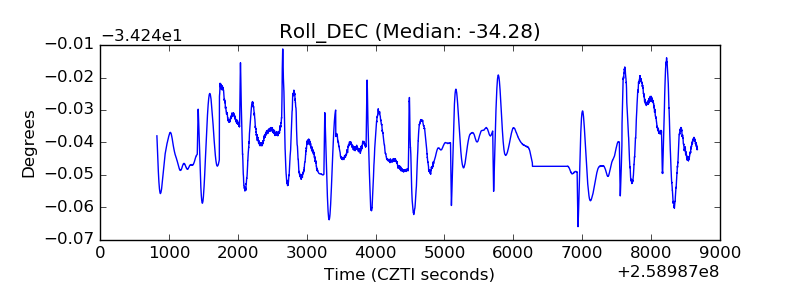 |
| _Roll_RA | 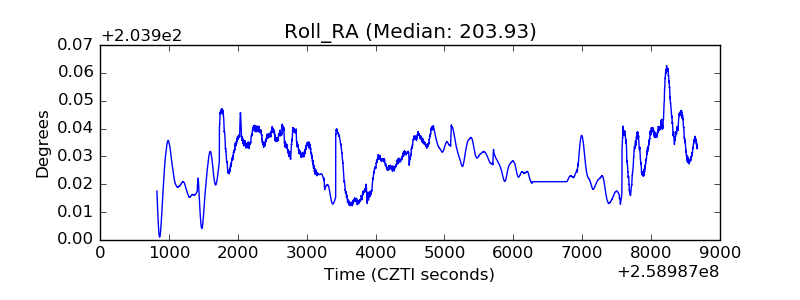 |
| Veto Counter | 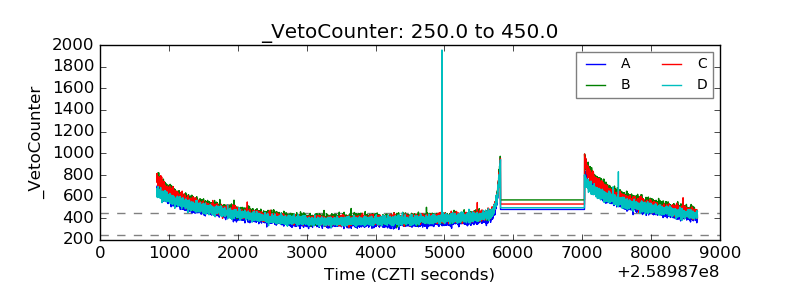 |