| Param | Original file | Final file |
|---|---|---|
| Filename | modeM0/AS1G08_082T01_9000001986_13344cztM0_level2.evt | modeM0/AS1G08_082T01_9000001986_13344cztM0_level2_quad_clean.evt |
| Size (bytes) | 444,444,480 | 94,176,000 |
| Size | 423.9 MB | 89.8 MB |
| Events in quadrant A | 3,266,691 | 612,805 |
| Events in quadrant B | 3,542,297 | 629,980 |
| Events in quadrant C | 3,163,005 | 601,662 |
| Events in quadrant D | 3,065,637 | 573,707 |
| Mode M9 | |||
|---|---|---|---|
| Quadrant | BADHDUFLAG | Total packets | Discarded packets |
| A | 0 | 16 | 0 |
| B | 0 | 16 | 0 |
| C | 0 | 16 | 0 |
| D | 0 | 17 | 0 |
| Mode M0 | |||
|---|---|---|---|
| Quadrant | BADHDUFLAG | Total packets | Discarded packets |
| A | 0 | 13791 | 3 |
| B | 0 | 14662 | 2 |
| C | 0 | 13361 | 2 |
| D | 0 | 13327 | 2 |
| Mode SS | |||
|---|---|---|---|
| Quadrant | BADHDUFLAG | Total packets | Discarded packets |
| A | 0 | 126 | 0 |
| B | 0 | 126 | 0 |
| C | 0 | 126 | 0 |
| D | 0 | 126 | 0 |
| Quadrant | Total seconds | Saturated seconds | Saturation percentage |
|---|---|---|---|
| A | 6218 | 51 | 0.820199% |
| B | 6218 | 147 | 2.364104% |
| C | 6218 | 29 | 0.466388% |
| D | 6218 | 35 | 0.562882% |
Noise dominated data is calculated using 1-second bins in cleaned event files. If a bin has >2000 counts, and if more than 50% of those come from <1% of pixels, then it is considered to be noise-dominated and hence unusable.
| Quadrant | # 1 sec bins | Bins with >0 counts | Bins with >2000 counts | High rate bins dominated by noise | Noise dominated (total time) | Noise dominated (detector-on time) | Marked lightcurve |
|---|---|---|---|---|---|---|---|
| A | 7569 | 6220 | 1 | 1 | 0.01% | 0.02% | 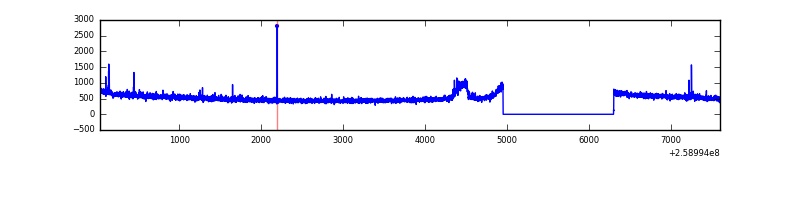 |
| B | 7569 | 6220 | 63 | 63 | 0.83% | 1.01% | 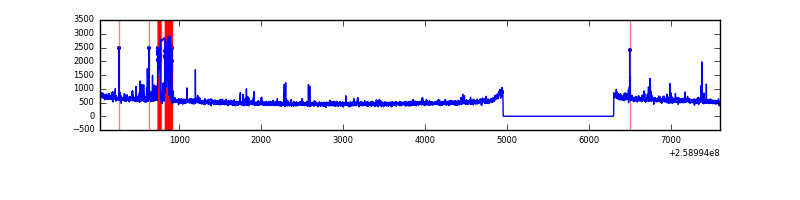 |
| C | 7569 | 6220 | 1 | 1 | 0.01% | 0.02% | 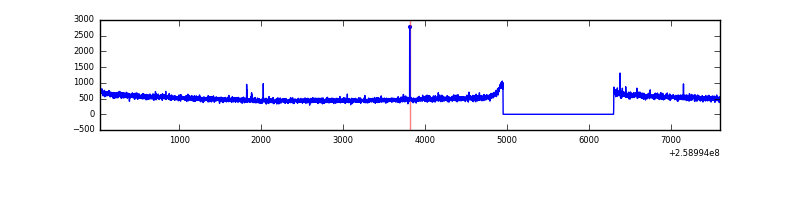 |
| D | 7569 | 6220 | 2 | 2 | 0.03% | 0.03% | 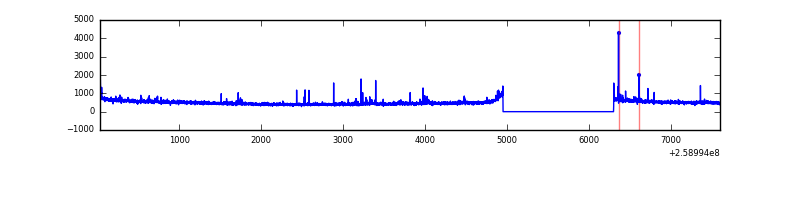 |
Top three noisy pixels from each quadrant. If the there are fewer than three noisy pixels in the level2.evt file, extra rows are filled as -1
| Pixel properties | Quadrant properties | ||||||
|---|---|---|---|---|---|---|---|
| Quadrant | DetID | PixID | Counts | Sigma | Mean | Median | Sigma |
| A | 9 | 143 | 80952 | 486.71 | 822 | 807 | 164.7 |
| A | 15 | 69 | 15716 | 90.54 | 822 | 807 | 164.7 |
| A | 1 | 162 | 8474 | 46.56 | 822 | 807 | 164.7 |
| B | 3 | 64 | 217454 | 1420.21 | 823 | 806 | 152.5 |
| B | 10 | 245 | 45108 | 290.42 | 823 | 806 | 152.5 |
| B | 4 | 173 | 19938 | 125.42 | 823 | 806 | 152.5 |
| C | 3 | 233 | 86724 | 479.28 | 787 | 794 | 179.3 |
| C | 14 | 234 | 7244 | 35.98 | 787 | 794 | 179.3 |
| C | 13 | 61 | 5718 | 27.46 | 787 | 794 | 179.3 |
| D | 2 | 136 | 38882 | 209.2 | 778 | 760 | 182.2 |
| D | 8 | 195 | 28350 | 151.41 | 778 | 760 | 182.2 |
| D | 2 | 234 | 21928 | 116.16 | 778 | 760 | 182.2 |
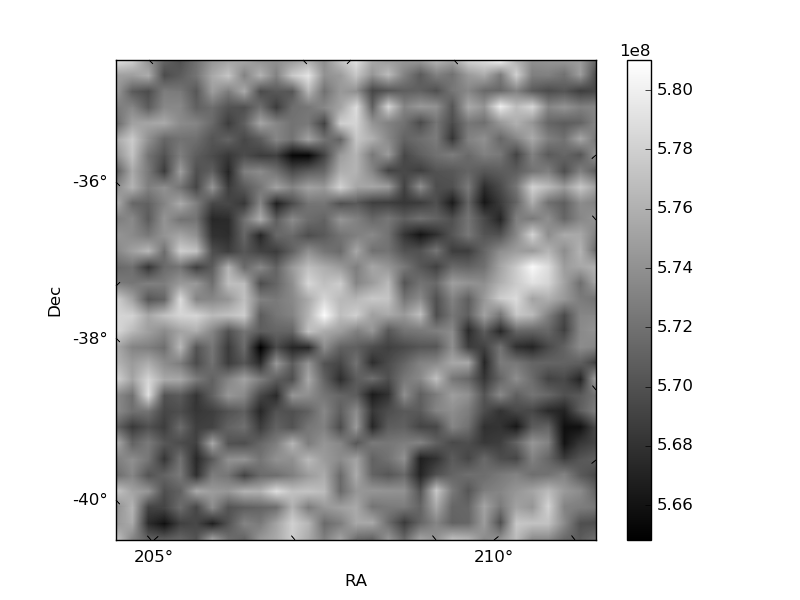
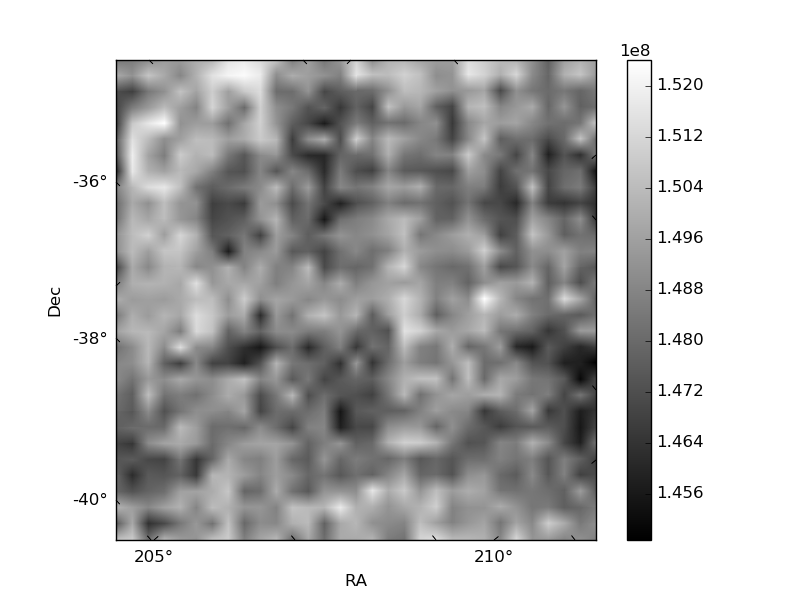
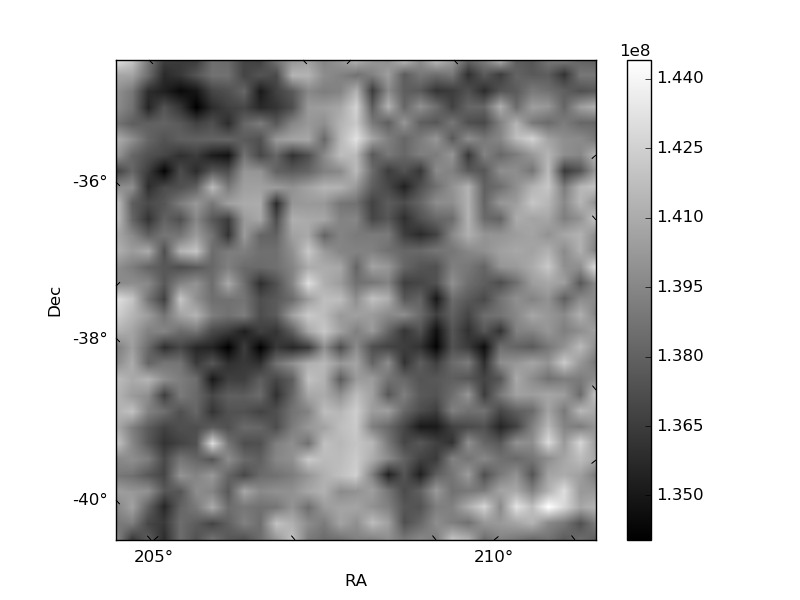
Histogram calculated using DETX and DETY for each event in the final _common_clean file
| Quadrant A | 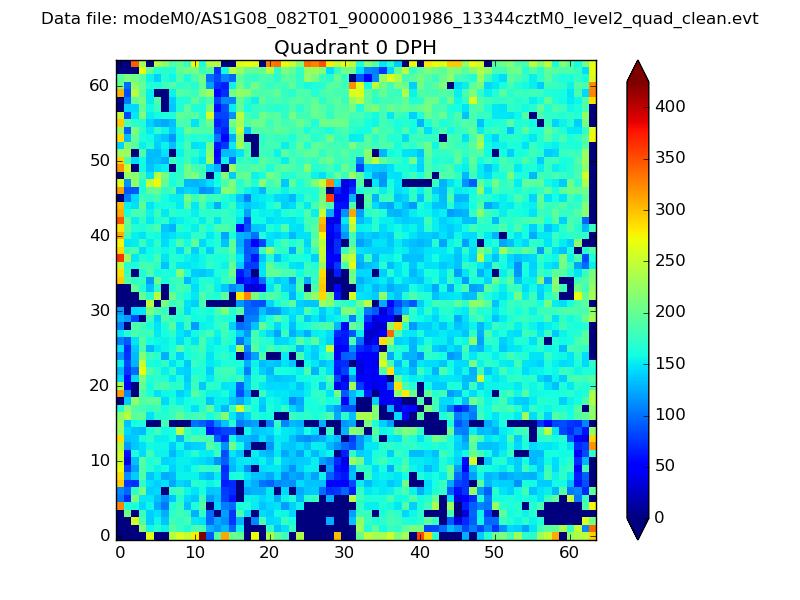 |
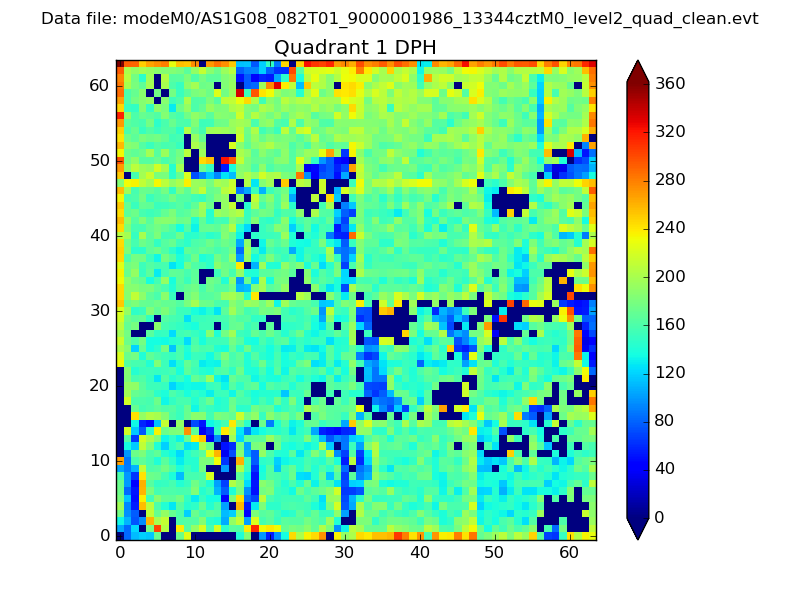 |
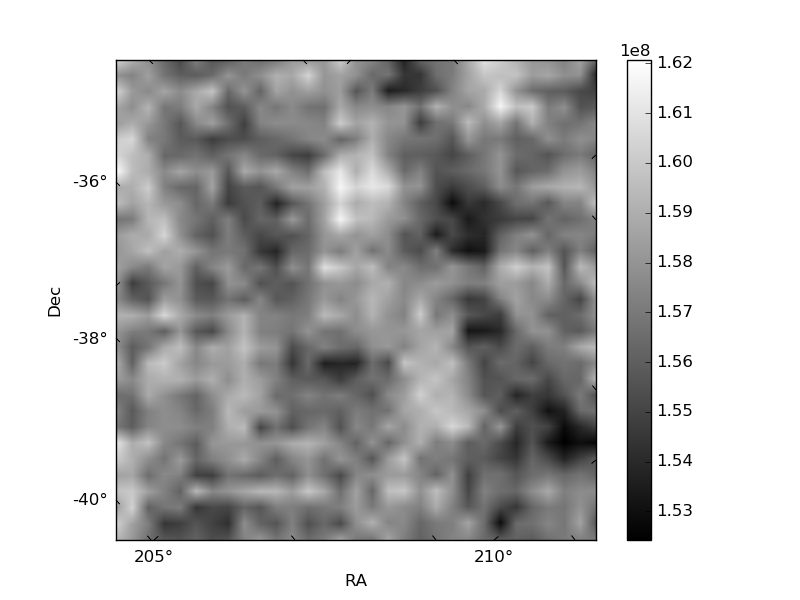
Quadrant B |
|---|---|---|---|
| Quadrant D | 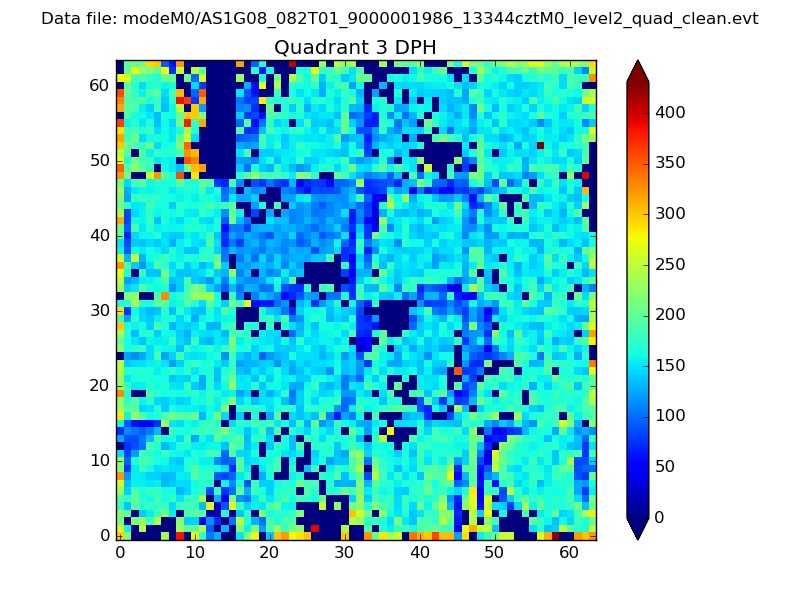 |
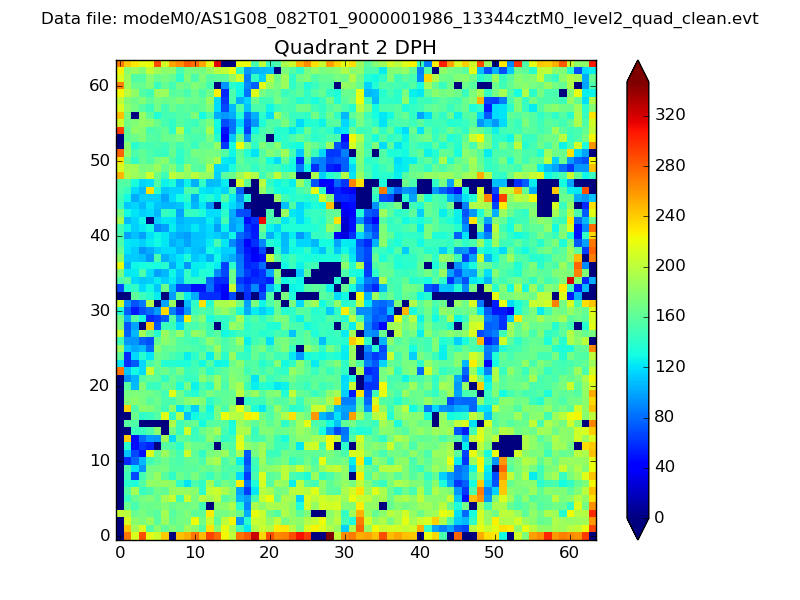 |
Quadrant C |
| Plot type | Count rate plots | Images |
|---|---|---|
| Comparison with Poisson distribution Blue bars denote a histogram of data divided into 1 sec bins. Red curve is a Poisson curve with rate = median count rate of data. |
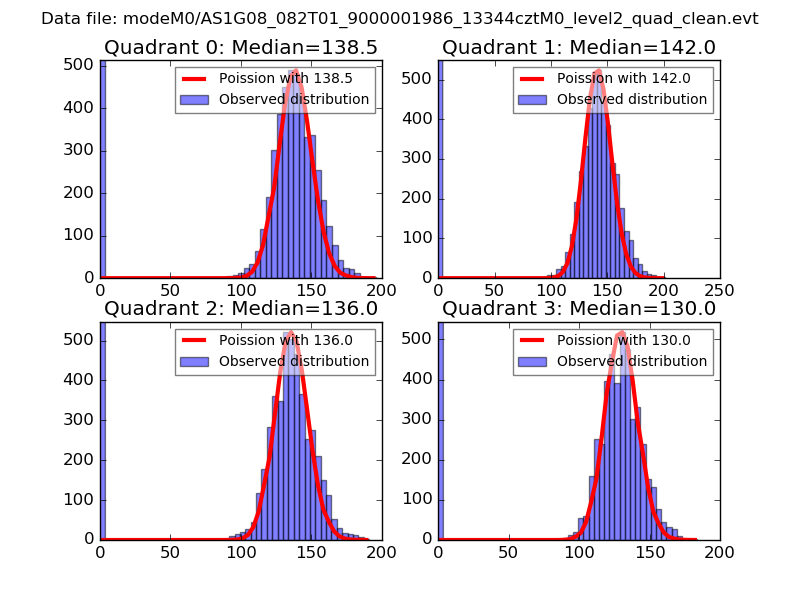 |
 |
| Quadrant-wise count rates Data is divided into 100 sec bins |
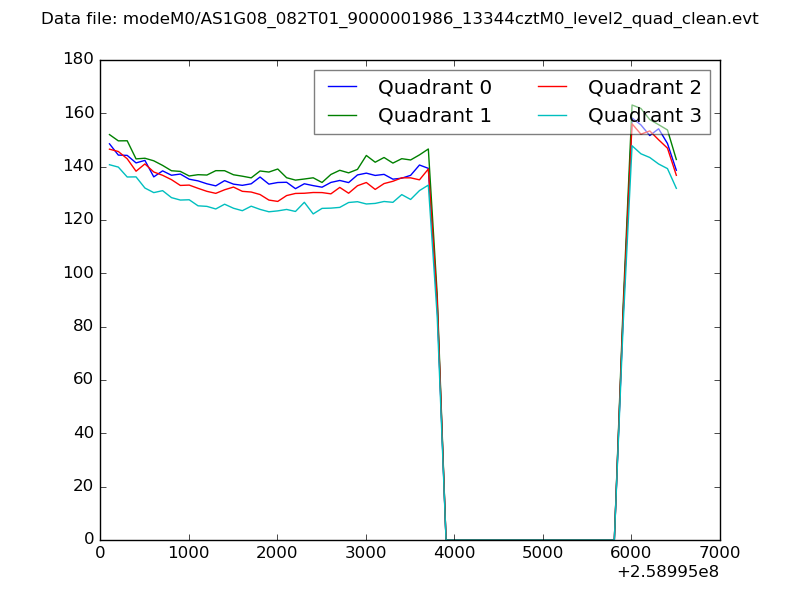 |
|
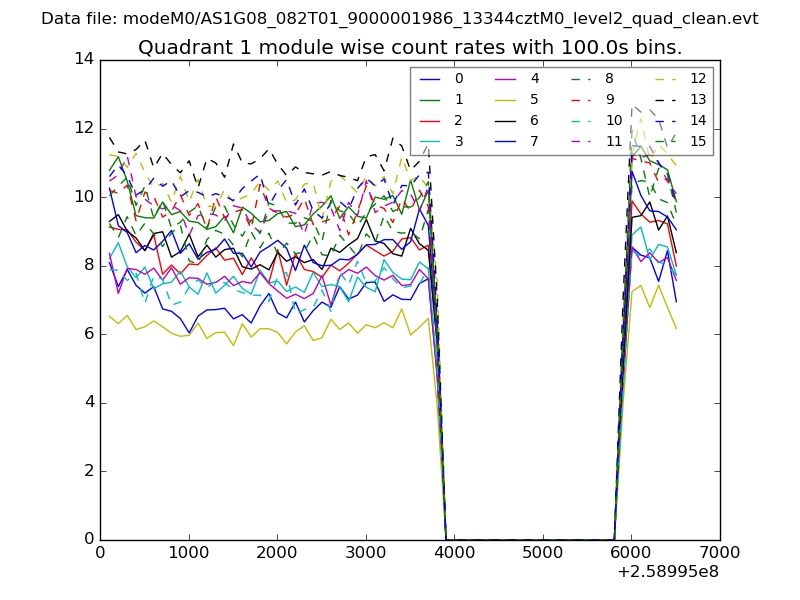
| Module-wise count rates for Quadrant A Data is divided into 100 sec bins |
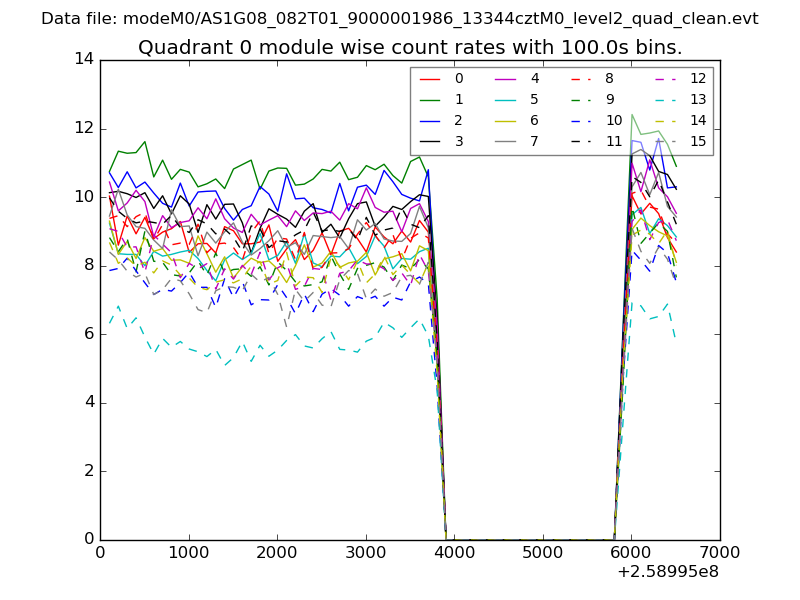 |
 |
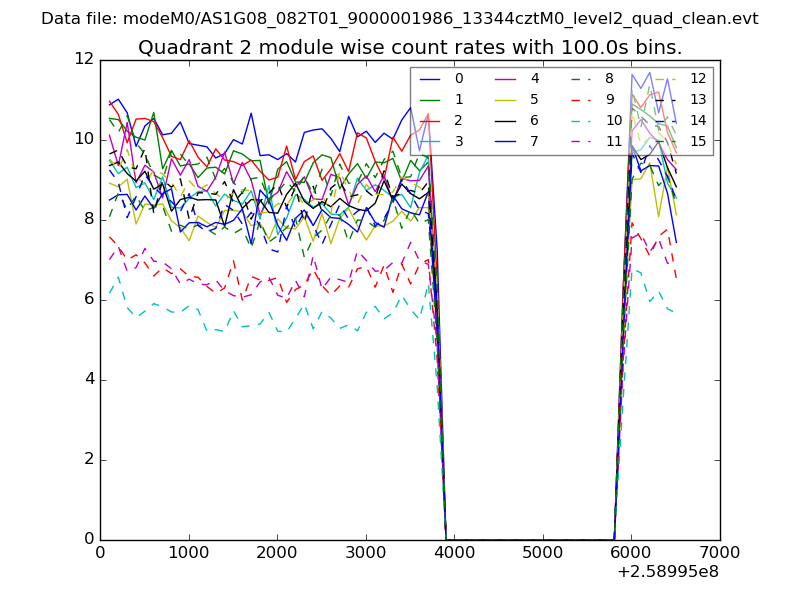
| Module-wise count rates for Quadrant B Data is divided into 100 sec bins |
 |
 |
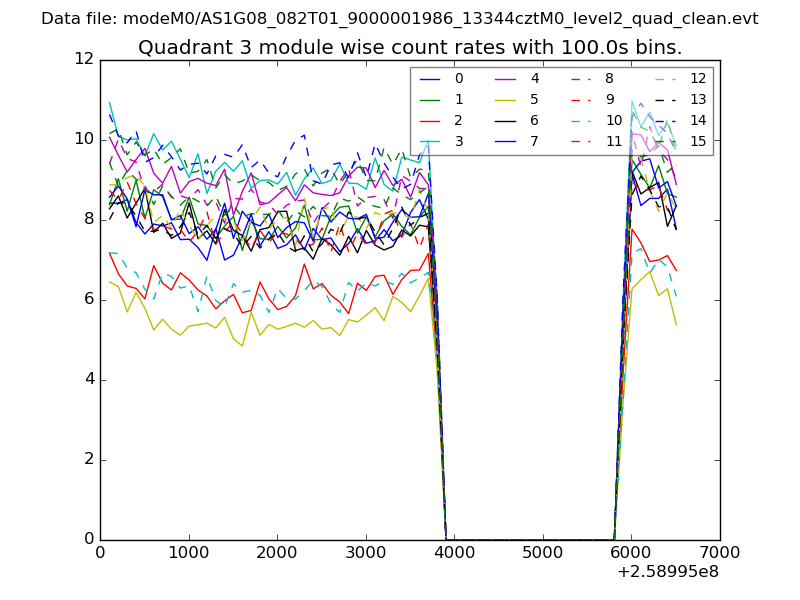
| Module-wise count rates for Quadrant C Data is divided into 100 sec bins |
 |
 |
| Module-wise count rates for Quadrant D Data is divided into 100 sec bins |
 |
 |
| Parameter | Plot |
|---|---|
| CZT HV Monitor | 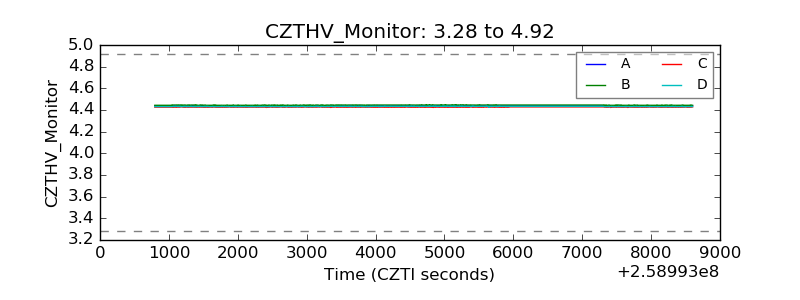 |
| D_VDD | 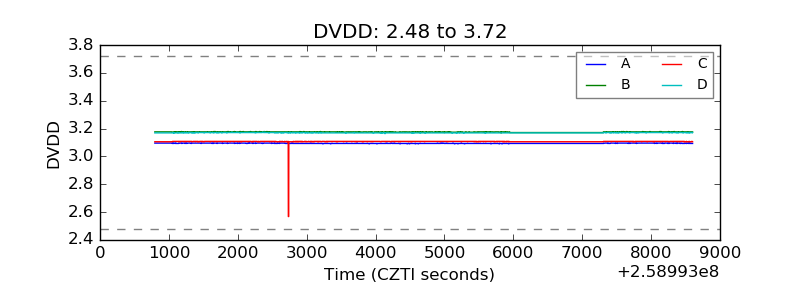 |
| Temperature 1 |  |
| Veto HV Monitor | 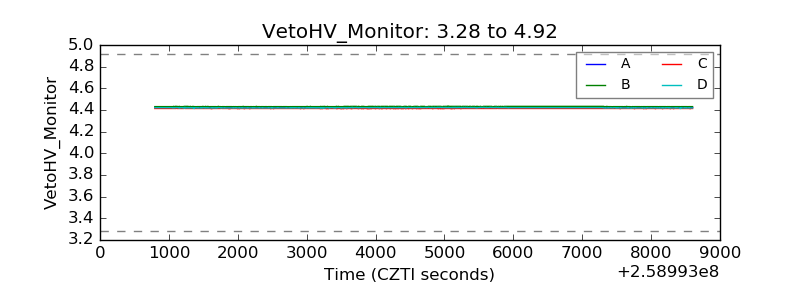 |
| Veto LLD | 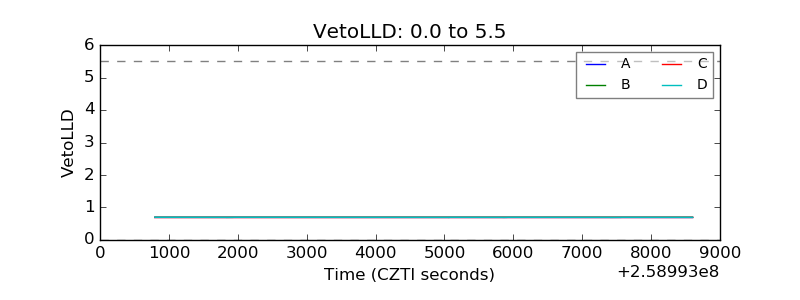 |
| Alpha Counter | 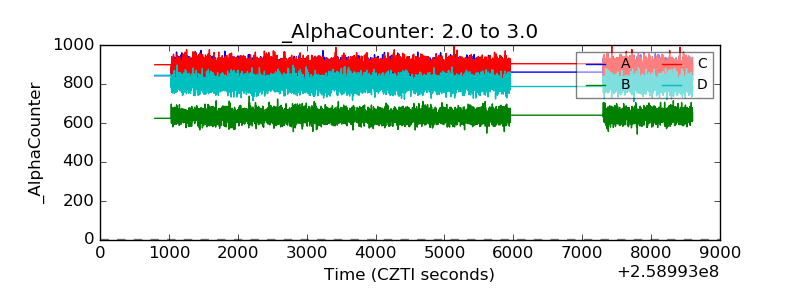 |
| _CPM_Rate | 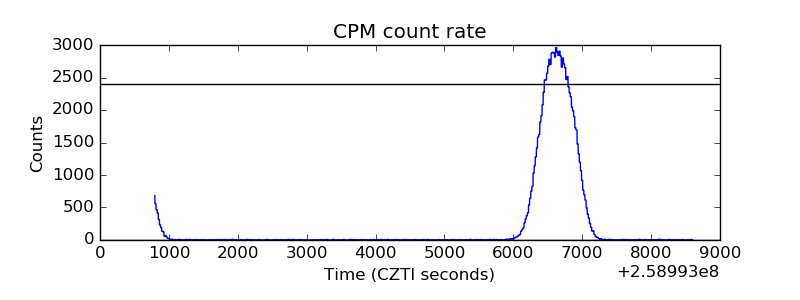 |
| CZT Counter | 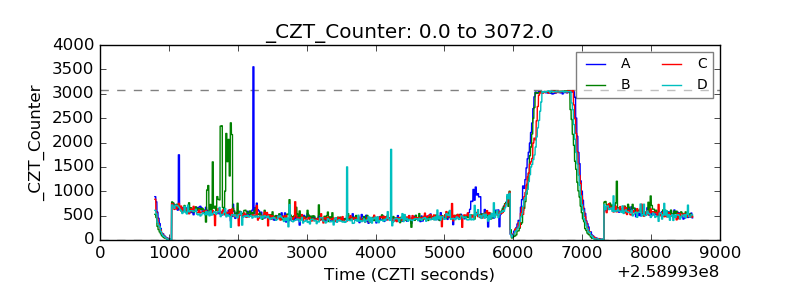 |
| +2.5 Volts monitor |  |
| +5 Volts monitor |  |
| _ROLL_ROT |  |
| _Roll_DEC | 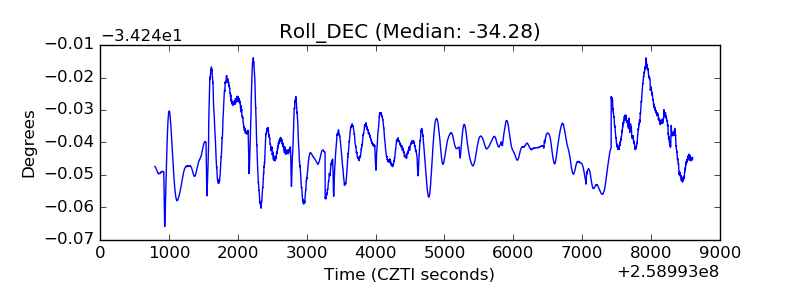 |
| _Roll_RA | 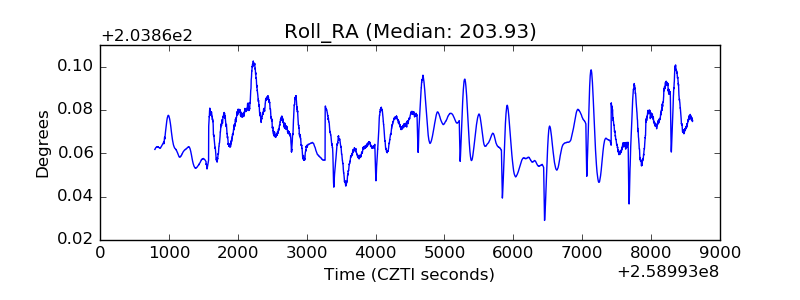 |
| Veto Counter | 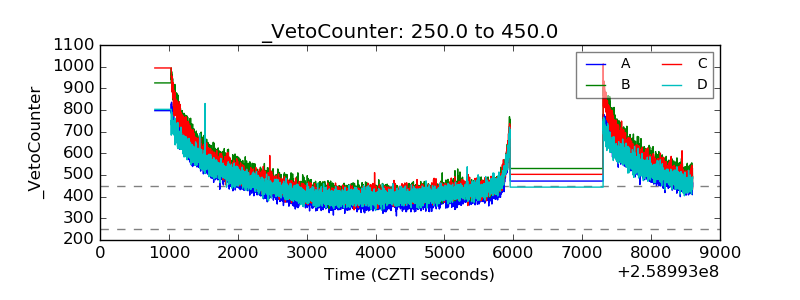 |