| Param | Original file | Final file |
|---|---|---|
| Filename | modeM0/AS1G08_082T01_9000001986_13345cztM0_level2.evt | modeM0/AS1G08_082T01_9000001986_13345cztM0_level2_quad_clean.evt |
| Size (bytes) | 433,863,360 | 102,055,680 |
| Size | 413.8 MB | 97.3 MB |
| Events in quadrant A | 3,077,465 | 677,290 |
| Events in quadrant B | 3,321,374 | 695,741 |
| Events in quadrant C | 3,217,276 | 663,265 |
| Events in quadrant D | 3,108,195 | 627,841 |
| Mode M9 | |||
|---|---|---|---|
| Quadrant | BADHDUFLAG | Total packets | Discarded packets |
| A | 0 | 20 | 0 |
| B | 0 | 20 | 0 |
| C | 0 | 20 | 0 |
| D | 0 | 21 | 0 |
| Mode M0 | |||
|---|---|---|---|
| Quadrant | BADHDUFLAG | Total packets | Discarded packets |
| A | 0 | 13054 | 3 |
| B | 0 | 13782 | 2 |
| C | 0 | 13335 | 2 |
| D | 0 | 13168 | 2 |
| Mode SS | |||
|---|---|---|---|
| Quadrant | BADHDUFLAG | Total packets | Discarded packets |
| A | 0 | 124 | 0 |
| B | 0 | 124 | 0 |
| C | 0 | 124 | 0 |
| D | 0 | 124 | 0 |
| Quadrant | Total seconds | Saturated seconds | Saturation percentage |
|---|---|---|---|
| A | 6112 | 41 | 0.670812% |
| B | 6112 | 68 | 1.112565% |
| C | 6112 | 56 | 0.916230% |
| D | 6112 | 34 | 0.556283% |
Noise dominated data is calculated using 1-second bins in cleaned event files. If a bin has >2000 counts, and if more than 50% of those come from <1% of pixels, then it is considered to be noise-dominated and hence unusable.
| Quadrant | # 1 sec bins | Bins with >0 counts | Bins with >2000 counts | High rate bins dominated by noise | Noise dominated (total time) | Noise dominated (detector-on time) | Marked lightcurve |
|---|---|---|---|---|---|---|---|
| A | 7503 | 6114 | 0 | 0 | 0.00% | 0.00% | 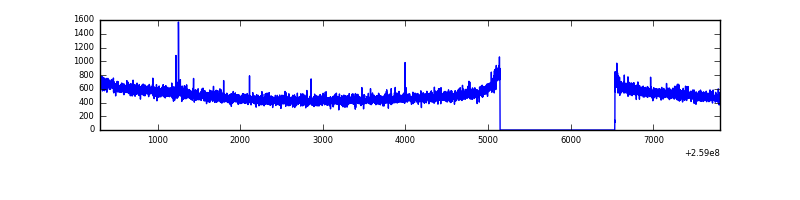 |
| B | 7503 | 6114 | 6 | 6 | 0.08% | 0.10% | 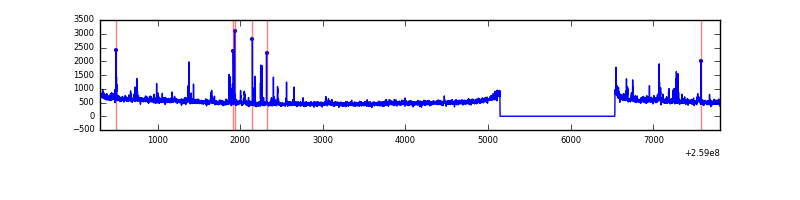 |
| C | 7503 | 6114 | 23 | 23 | 0.31% | 0.38% | 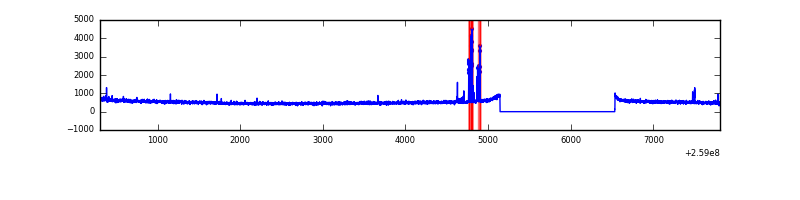 |
| D | 7503 | 6114 | 13 | 13 | 0.17% | 0.21% | 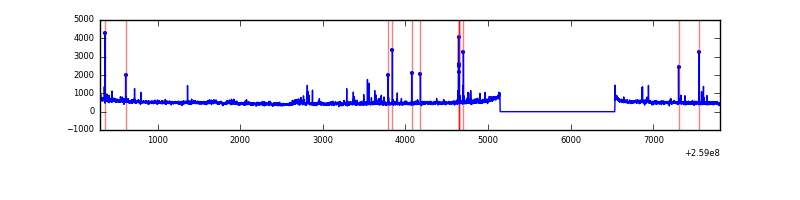 |
Top three noisy pixels from each quadrant. If the there are fewer than three noisy pixels in the level2.evt file, extra rows are filled as -1
| Pixel properties | Quadrant properties | ||||||
|---|---|---|---|---|---|---|---|
| Quadrant | DetID | PixID | Counts | Sigma | Mean | Median | Sigma |
| A | 15 | 69 | 7355 | 41.43 | 797 | 783 | 158.6 |
| A | 0 | 226 | 7252 | 40.78 | 797 | 783 | 158.6 |
| A | 12 | 194 | 6023 | 33.04 | 797 | 783 | 158.6 |
| B | 10 | 245 | 78303 | 518.3 | 805 | 787 | 149.6 |
| B | 3 | 64 | 42944 | 281.88 | 805 | 787 | 149.6 |
| B | 4 | 173 | 18343 | 117.39 | 805 | 787 | 149.6 |
| C | 3 | 233 | 123321 | 701.91 | 765 | 772 | 174.6 |
| C | 14 | 234 | 101762 | 578.43 | 765 | 772 | 174.6 |
| C | 6 | 96 | 10109 | 53.48 | 765 | 772 | 174.6 |
| D | 8 | 195 | 83788 | 465.19 | 751 | 730 | 178.5 |
| D | 2 | 136 | 68793 | 381.21 | 751 | 730 | 178.5 |
| D | 14 | 34 | 33926 | 185.93 | 751 | 730 | 178.5 |
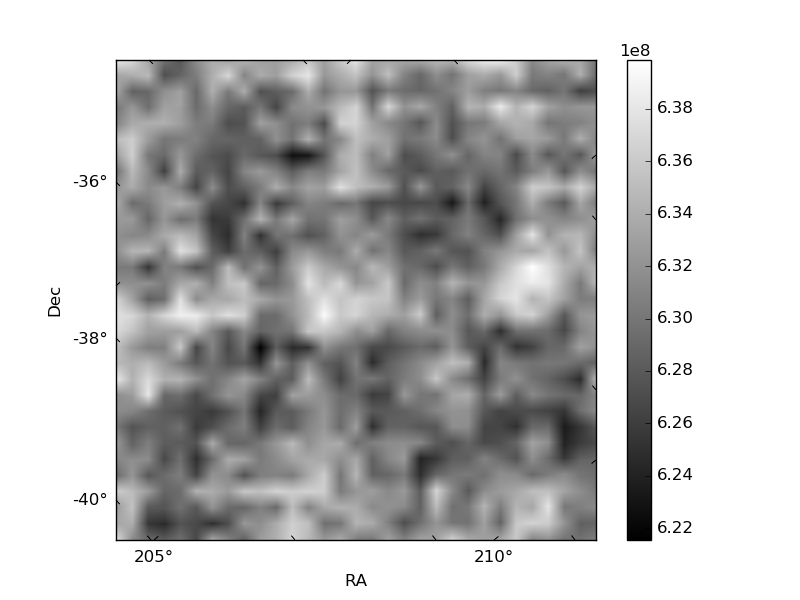
Histogram calculated using DETX and DETY for each event in the final _common_clean file
| Quadrant A | 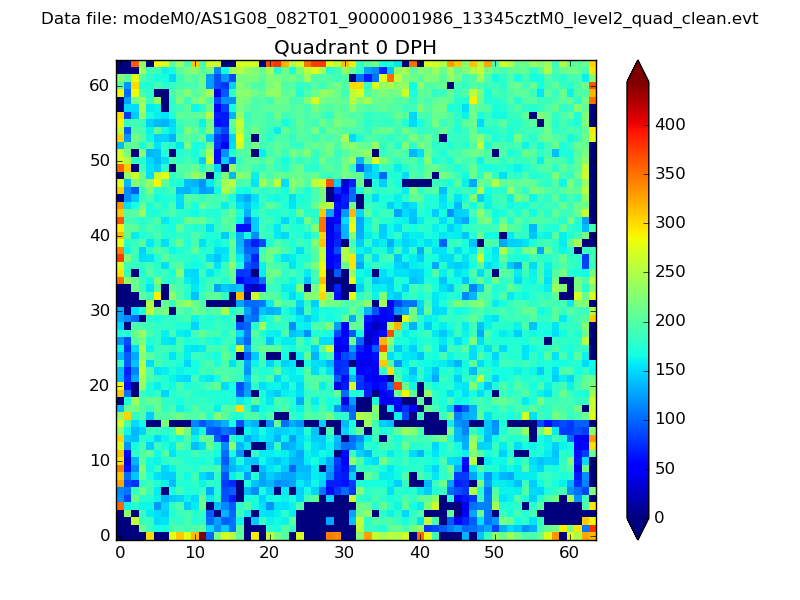 |
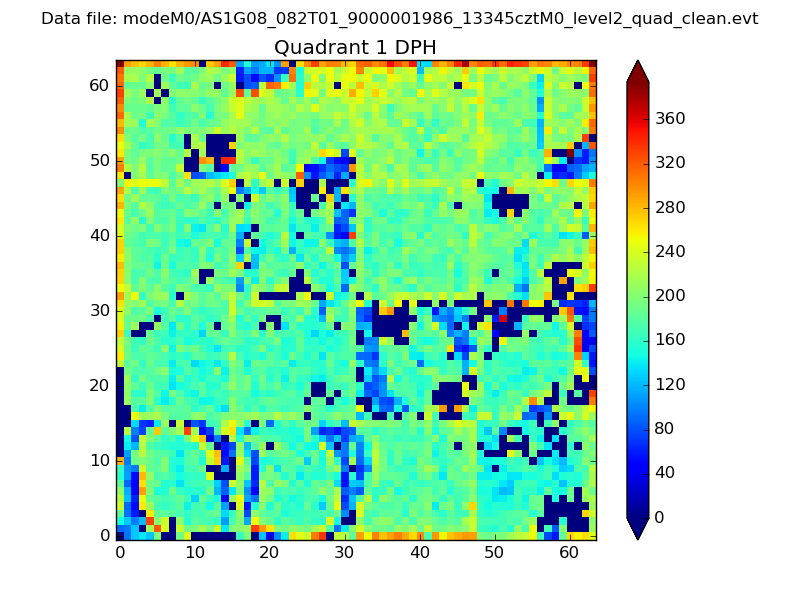 |
Quadrant B |
|---|---|---|---|
| Quadrant D | 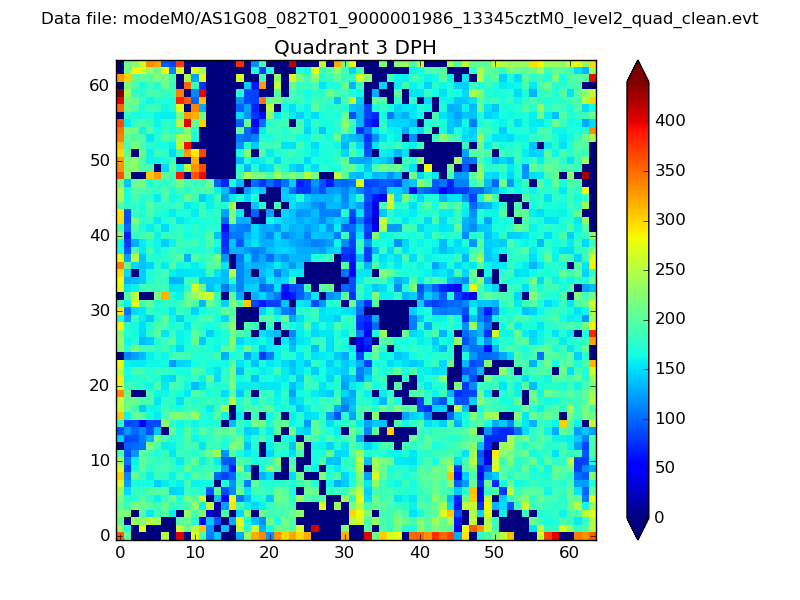 |
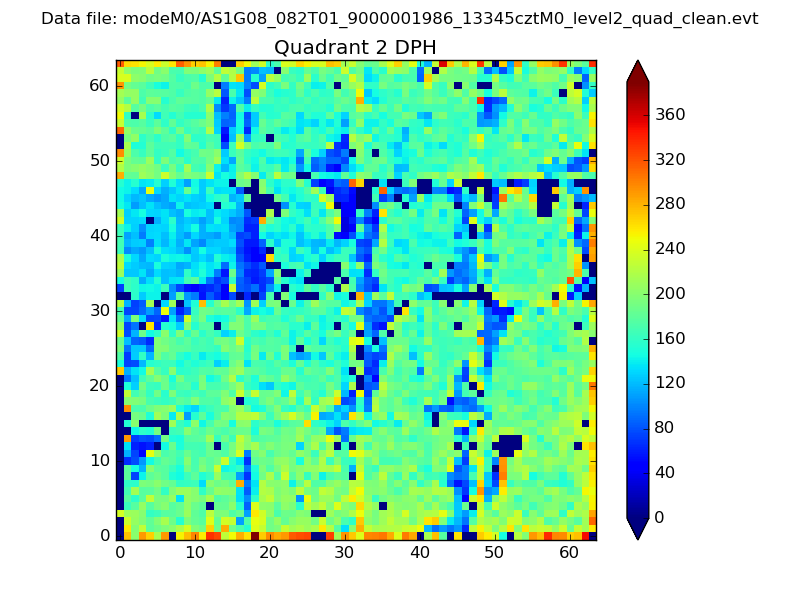 |
Quadrant C |
| Plot type | Count rate plots | Images |
|---|---|---|
| Comparison with Poisson distribution Blue bars denote a histogram of data divided into 1 sec bins. Red curve is a Poisson curve with rate = median count rate of data. |
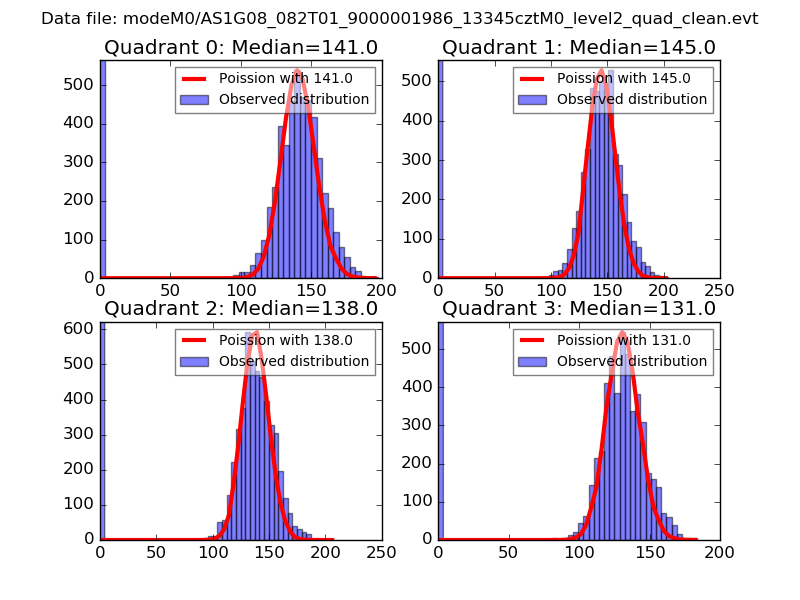 |
 |
| Quadrant-wise count rates Data is divided into 100 sec bins |
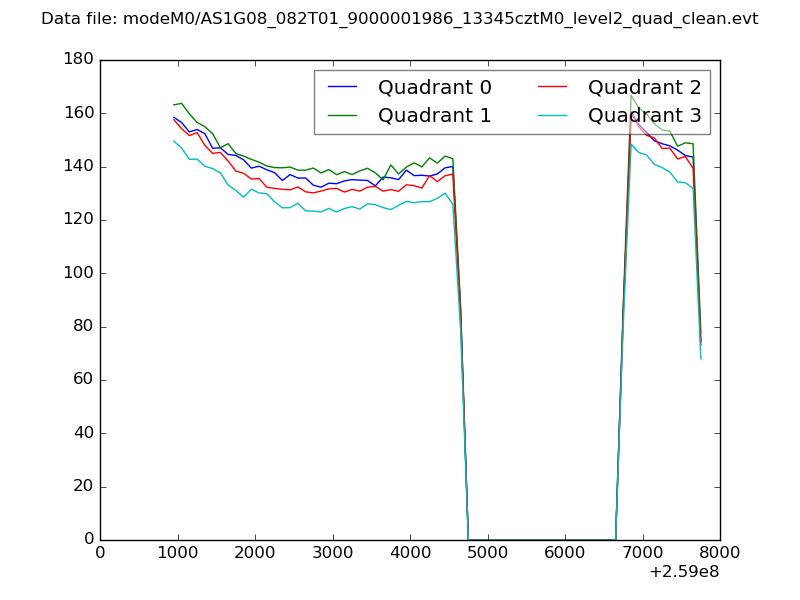 |
|
| Module-wise count rates for Quadrant A Data is divided into 100 sec bins |
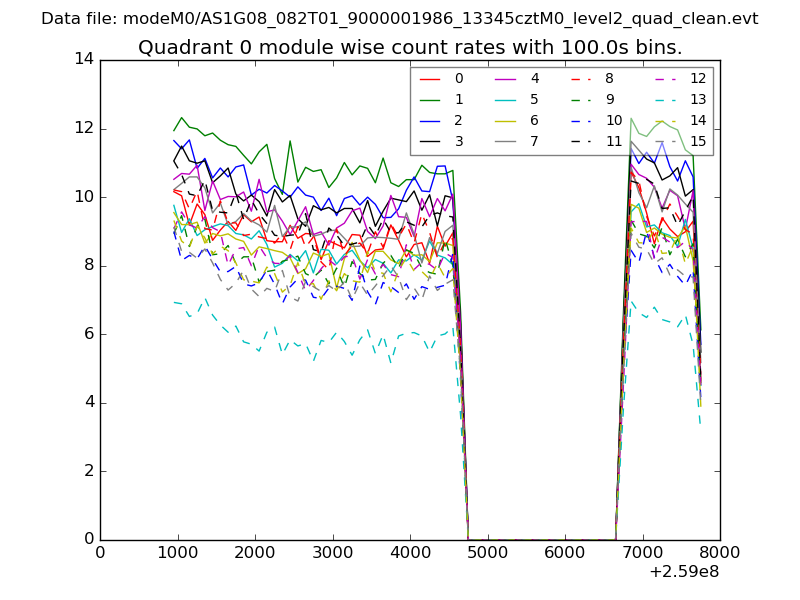 |
 |
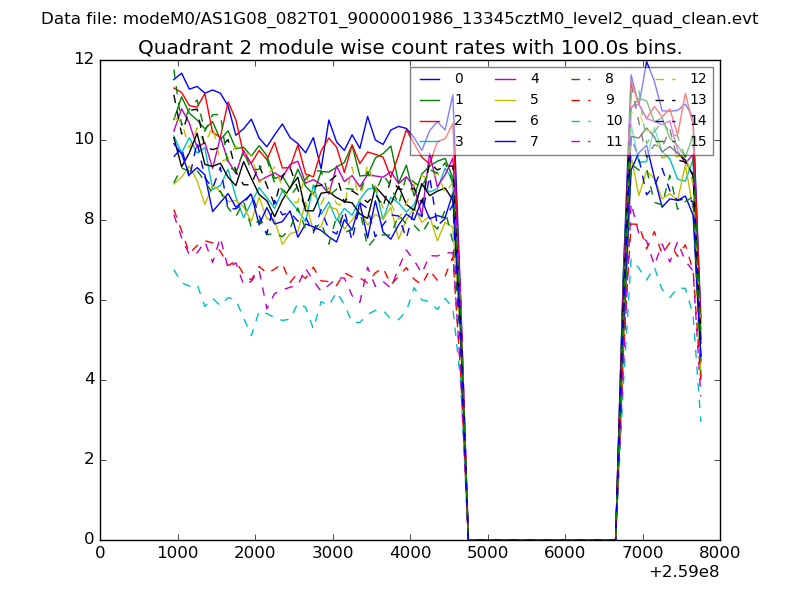
| Module-wise count rates for Quadrant B Data is divided into 100 sec bins |
 |
 |
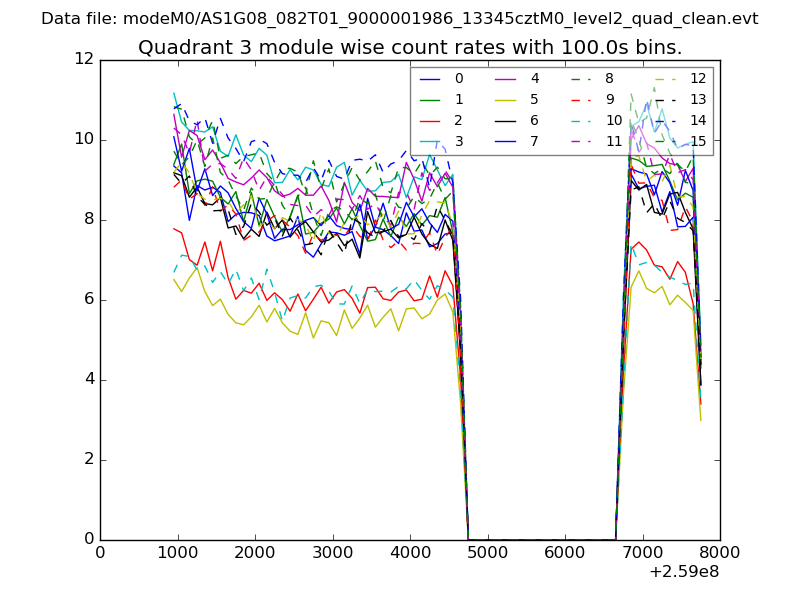
| Module-wise count rates for Quadrant C Data is divided into 100 sec bins |
 |
 |
| Module-wise count rates for Quadrant D Data is divided into 100 sec bins |
 |
 |
| Parameter | Plot |
|---|---|
| CZT HV Monitor | 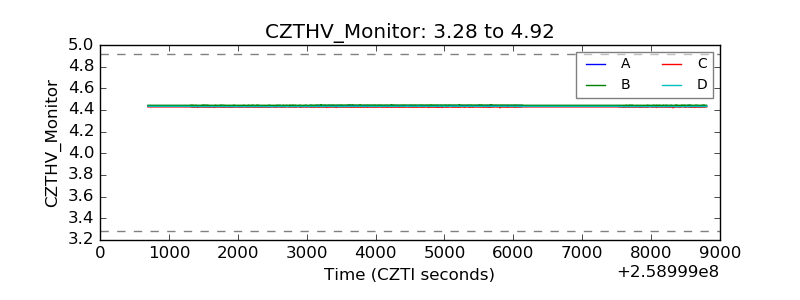 |
| D_VDD | 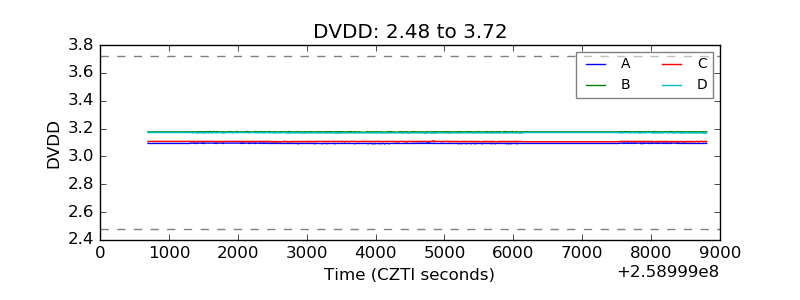 |
| Temperature 1 | 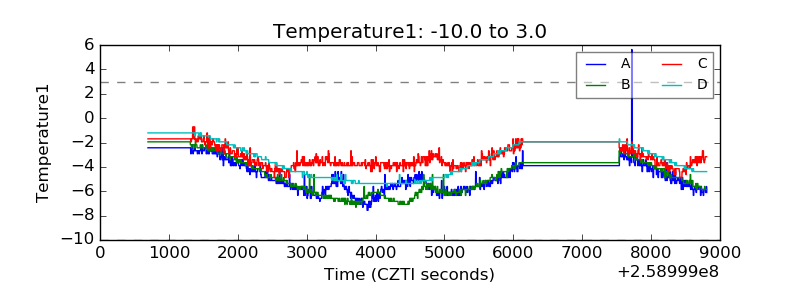 |
| Veto HV Monitor | 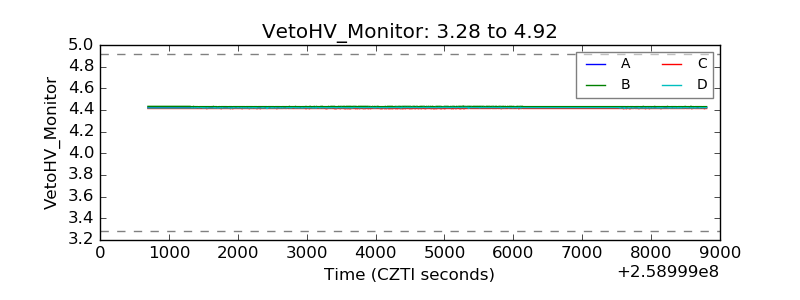 |
| Veto LLD | 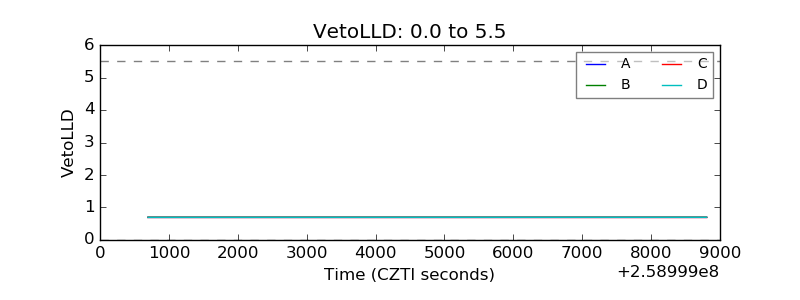 |
| Alpha Counter | 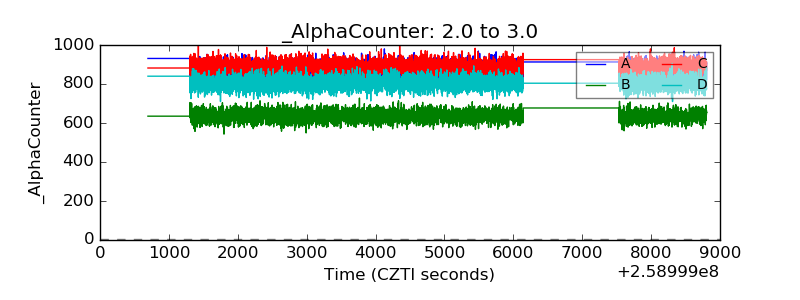 |
| _CPM_Rate | 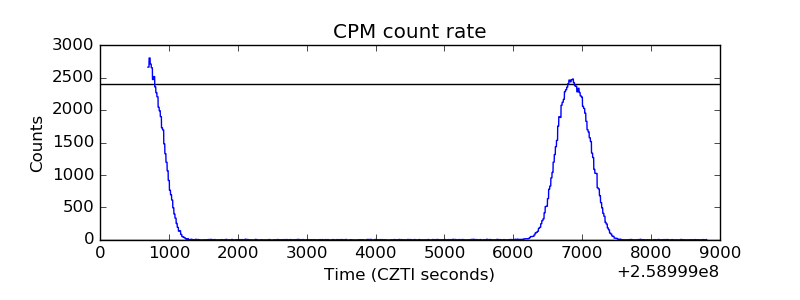 |
| CZT Counter | 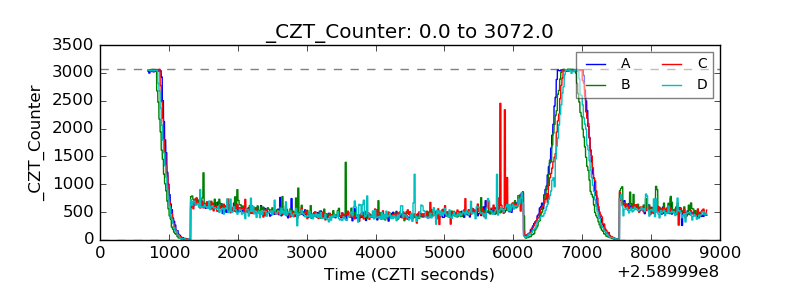 |
| +2.5 Volts monitor |  |
| +5 Volts monitor |  |
| _ROLL_ROT | 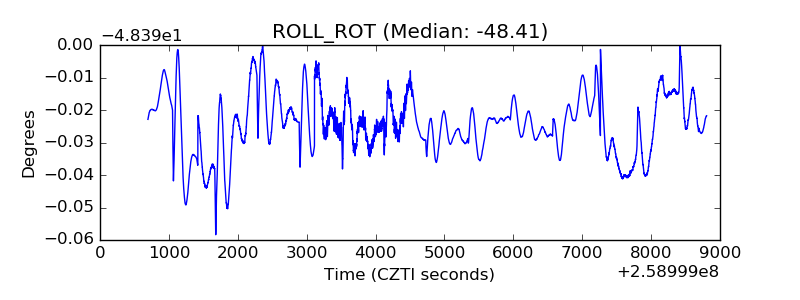 |
| _Roll_DEC | 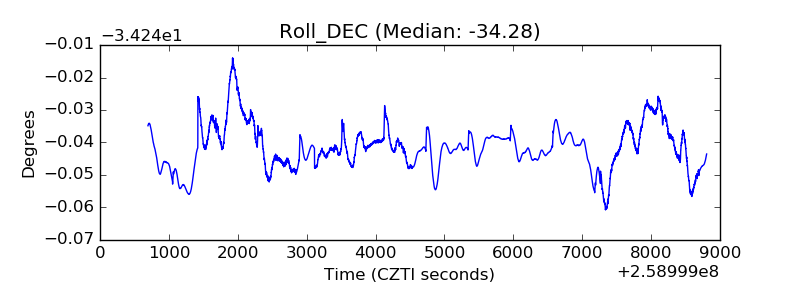 |
| _Roll_RA | 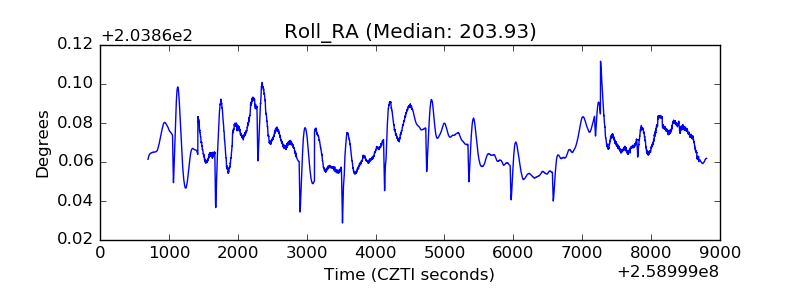 |
| Veto Counter |  |