| Param | Original file | Final file |
|---|---|---|
| Filename | modeM0/AS1G08_082T01_9000001986_13347cztM0_level2.evt | modeM0/AS1G08_082T01_9000001986_13347cztM0_level2_quad_clean.evt |
| Size (bytes) | 448,931,520 | 107,026,560 |
| Size | 428.1 MB | 102.1 MB |
| Events in quadrant A | 3,236,661 | 697,870 |
| Events in quadrant B | 3,374,539 | 718,054 |
| Events in quadrant C | 3,291,823 | 691,638 |
| Events in quadrant D | 3,224,048 | 653,356 |
| Mode M9 | |||
|---|---|---|---|
| Quadrant | BADHDUFLAG | Total packets | Discarded packets |
| A | 0 | 24 | 0 |
| B | 0 | 24 | 0 |
| C | 0 | 24 | 0 |
| D | 0 | 24 | 0 |
| Mode M0 | |||
|---|---|---|---|
| Quadrant | BADHDUFLAG | Total packets | Discarded packets |
| A | 0 | 14298 | 3 |
| B | 0 | 14557 | 2 |
| C | 0 | 14320 | 2 |
| D | 0 | 14609 | 2 |
| Mode SS | |||
|---|---|---|---|
| Quadrant | BADHDUFLAG | Total packets | Discarded packets |
| A | 0 | 142 | 0 |
| B | 0 | 142 | 0 |
| C | 0 | 142 | 0 |
| D | 0 | 142 | 0 |
| Quadrant | Total seconds | Saturated seconds | Saturation percentage |
|---|---|---|---|
| A | 6896 | 59 | 0.855568% |
| B | 6896 | 87 | 1.261601% |
| C | 6896 | 34 | 0.493039% |
| D | 6896 | 74 | 1.073086% |
Noise dominated data is calculated using 1-second bins in cleaned event files. If a bin has >2000 counts, and if more than 50% of those come from <1% of pixels, then it is considered to be noise-dominated and hence unusable.
| Quadrant | # 1 sec bins | Bins with >0 counts | Bins with >2000 counts | High rate bins dominated by noise | Noise dominated (total time) | Noise dominated (detector-on time) | Marked lightcurve |
|---|---|---|---|---|---|---|---|
| A | 9332 | 6898 | 1 | 1 | 0.01% | 0.01% | 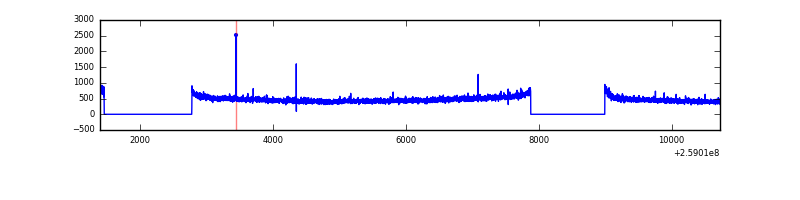 |
| B | 9332 | 6898 | 3 | 3 | 0.03% | 0.04% | 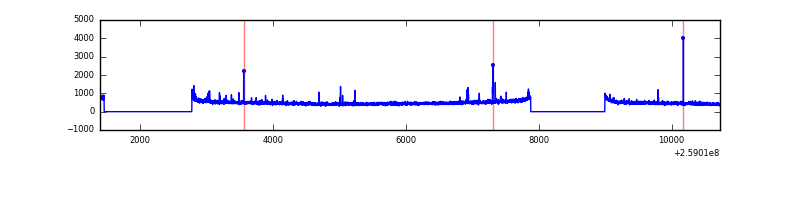 |
| C | 9332 | 6898 | 0 | 0 | 0.00% | 0.00% | 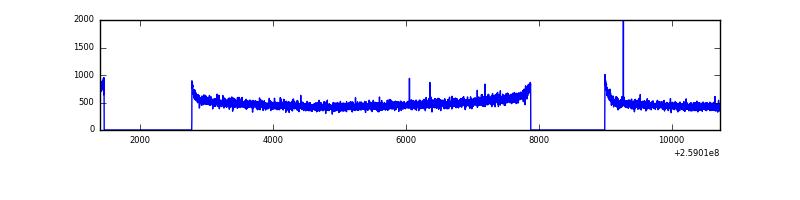 |
| D | 9332 | 6898 | 23 | 23 | 0.25% | 0.33% | 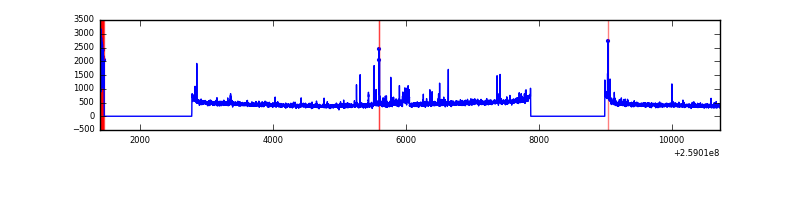 |
Top three noisy pixels from each quadrant. If the there are fewer than three noisy pixels in the level2.evt file, extra rows are filled as -1
| Pixel properties | Quadrant properties | ||||||
|---|---|---|---|---|---|---|---|
| Quadrant | DetID | PixID | Counts | Sigma | Mean | Median | Sigma |
| A | 1 | 162 | 15805 | 89.18 | 833 | 817 | 168.1 |
| A | 0 | 226 | 7504 | 39.79 | 833 | 817 | 168.1 |
| A | 12 | 194 | 6214 | 32.11 | 833 | 817 | 168.1 |
| B | 3 | 64 | 35352 | 218.31 | 843 | 822 | 158.2 |
| B | 12 | 111 | 18414 | 111.22 | 843 | 822 | 158.2 |
| B | 11 | 111 | 15373 | 91.99 | 843 | 822 | 158.2 |
| C | 3 | 233 | 116534 | 617.68 | 813 | 818 | 187.3 |
| C | 13 | 61 | 5970 | 27.5 | 813 | 818 | 187.3 |
| C | 14 | 234 | 5277 | 23.8 | 813 | 818 | 187.3 |
| D | 5 | 222 | 151887 | 799.04 | 793 | 773 | 189.1 |
| D | 2 | 136 | 45149 | 234.65 | 793 | 773 | 189.1 |
| D | 2 | 234 | 22337 | 114.02 | 793 | 773 | 189.1 |
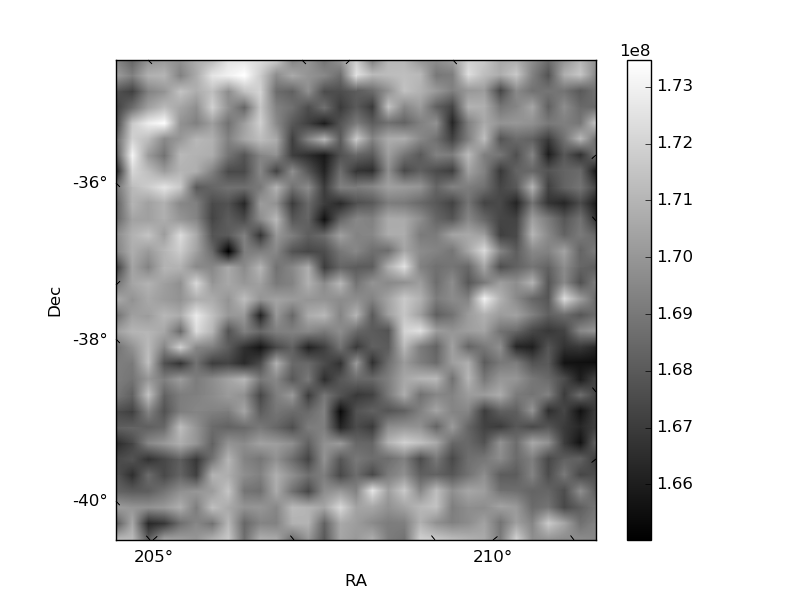
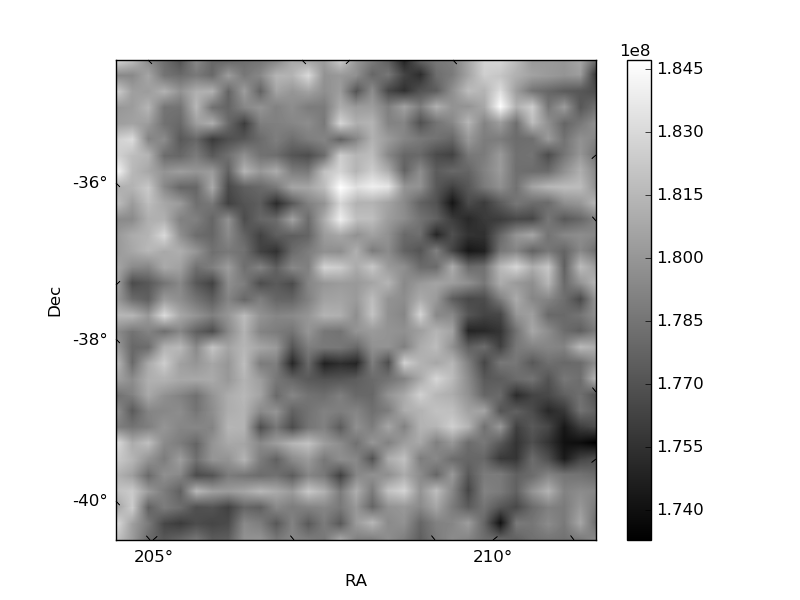
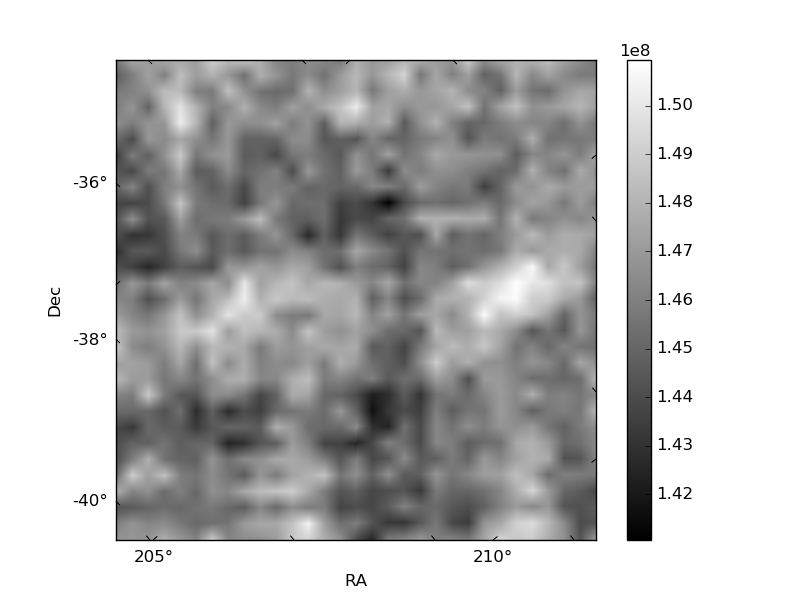
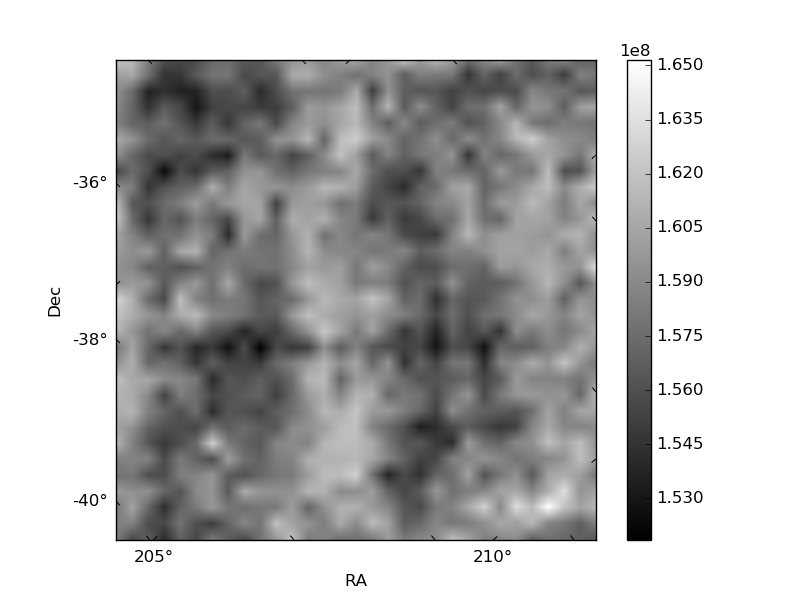
Histogram calculated using DETX and DETY for each event in the final _common_clean file
| Quadrant A | 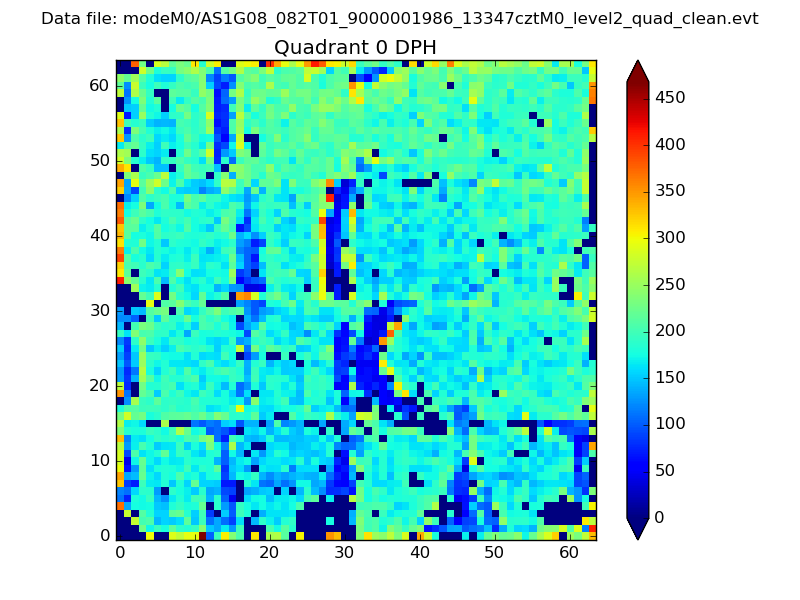 |
 |
Quadrant B |
|---|---|---|---|
| Quadrant D |  |
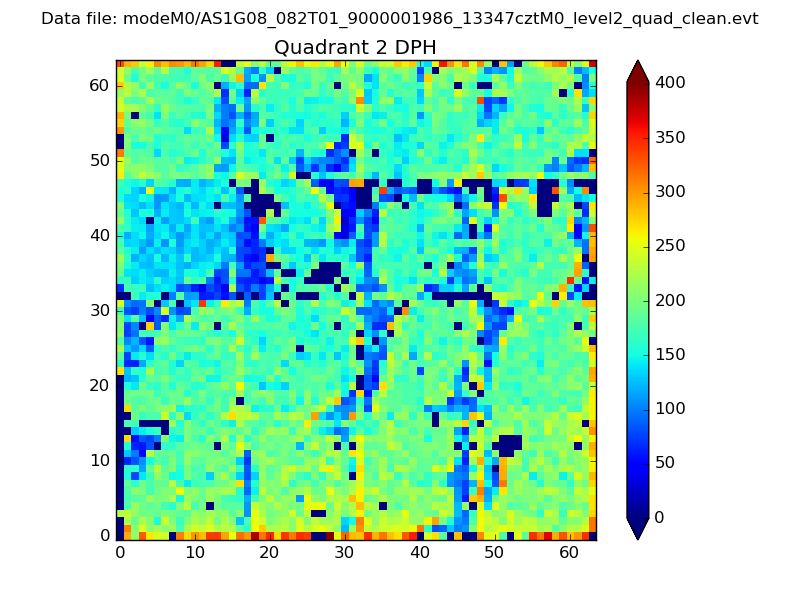 |
Quadrant C |
| Plot type | Count rate plots | Images |
|---|---|---|
| Comparison with Poisson distribution Blue bars denote a histogram of data divided into 1 sec bins. Red curve is a Poisson curve with rate = median count rate of data. |
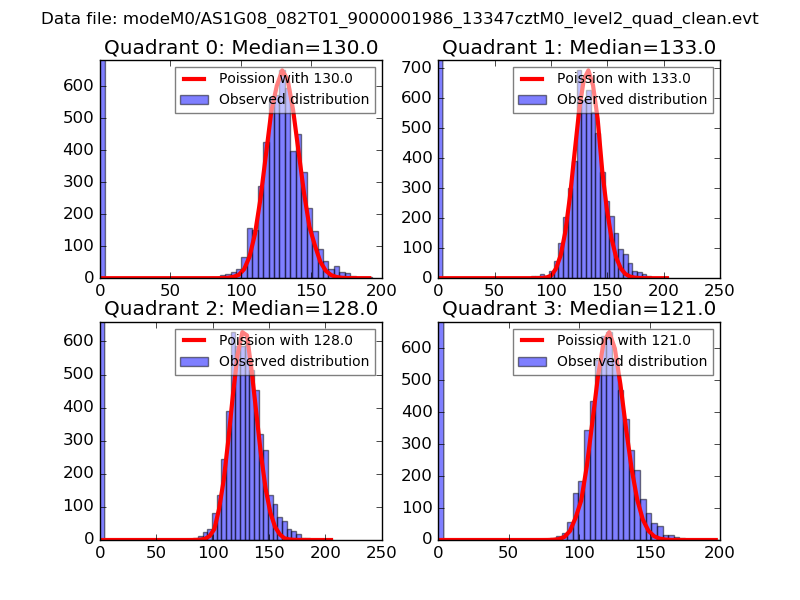 |
 |
| Quadrant-wise count rates Data is divided into 100 sec bins |
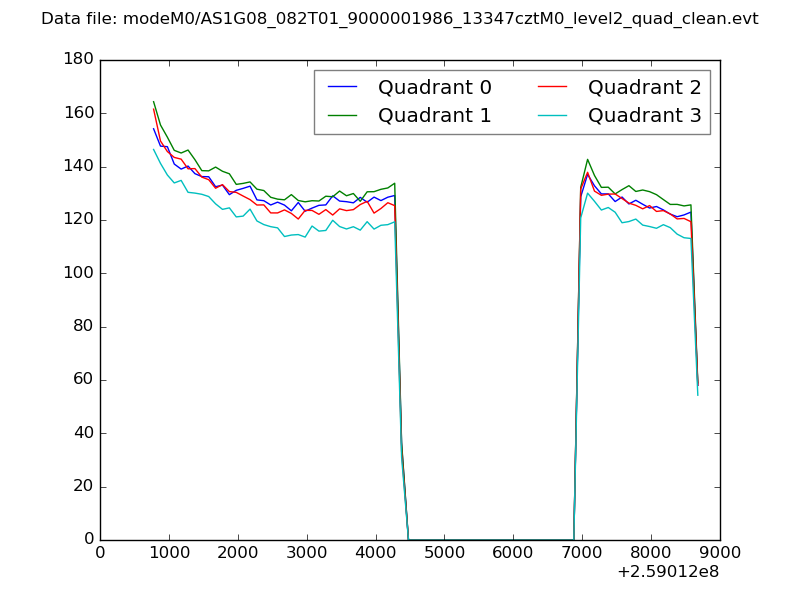 |
|
| Module-wise count rates for Quadrant A Data is divided into 100 sec bins |
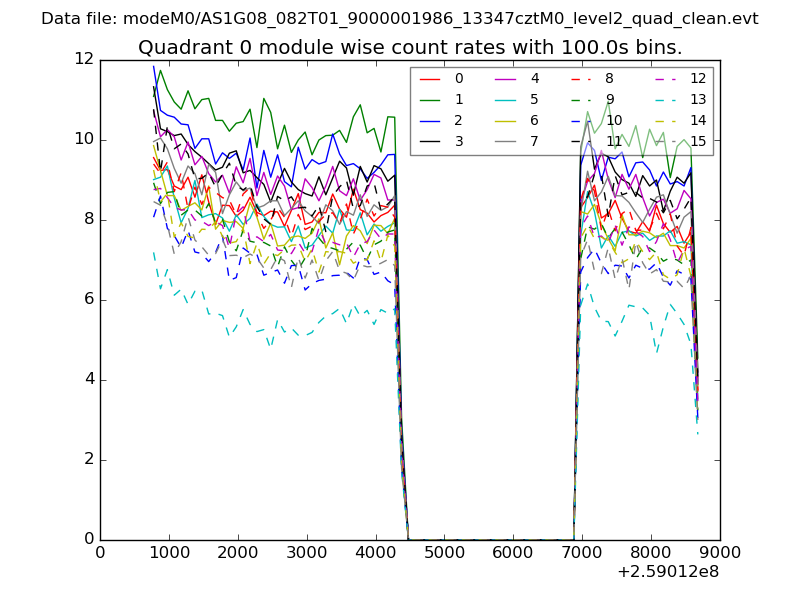 |
 |
| Module-wise count rates for Quadrant B Data is divided into 100 sec bins |
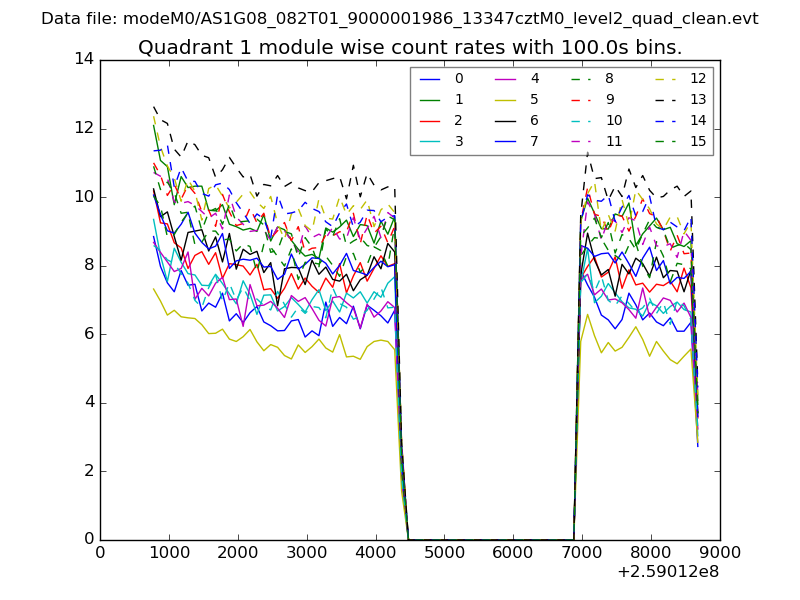 |
 |
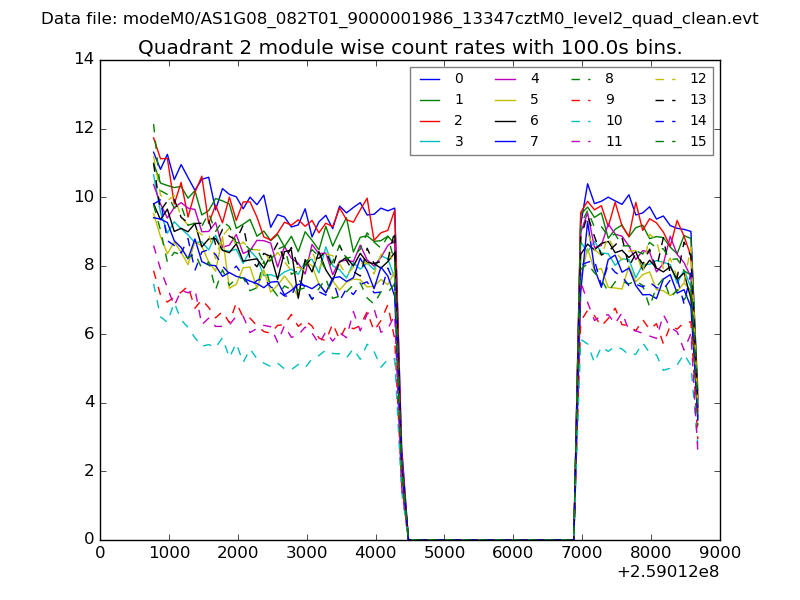
| Module-wise count rates for Quadrant C Data is divided into 100 sec bins |
 |
 |
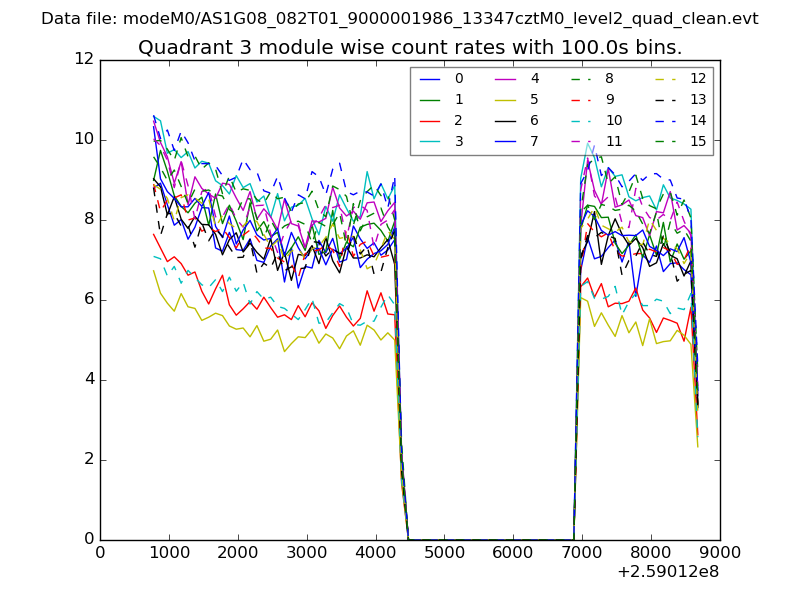
| Module-wise count rates for Quadrant D Data is divided into 100 sec bins |
 |
 |
| Parameter | Plot |
|---|---|
| CZT HV Monitor |  |
| D_VDD | 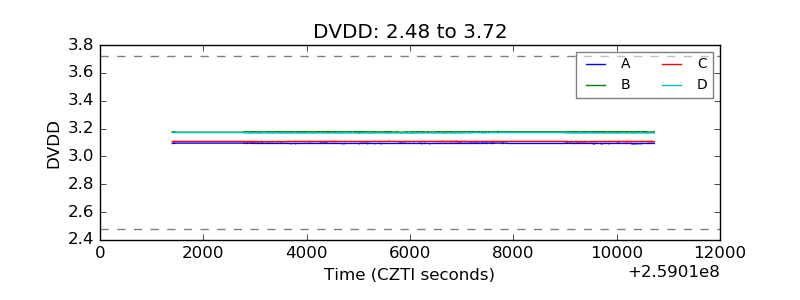 |
| Temperature 1 | 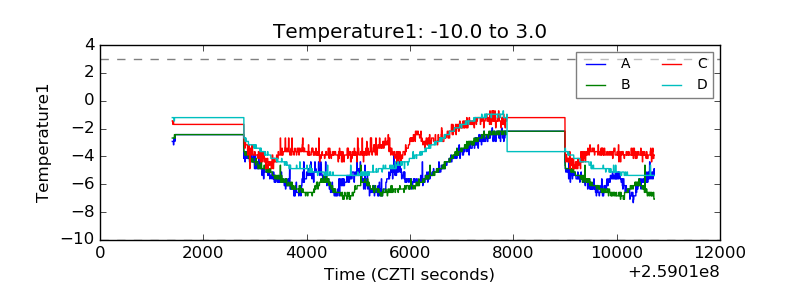 |
| Veto HV Monitor | 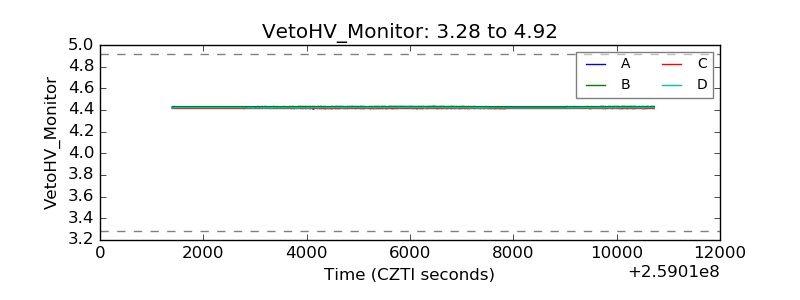 |
| Veto LLD | 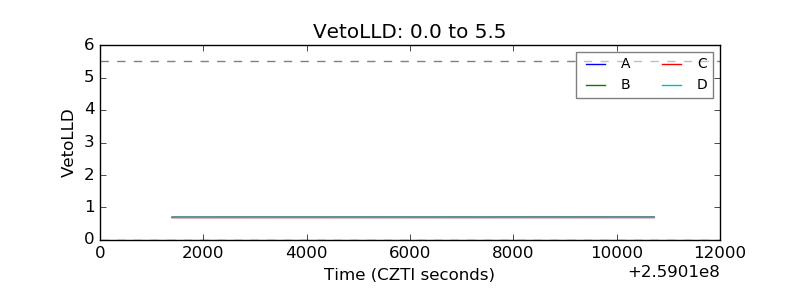 |
| Alpha Counter | 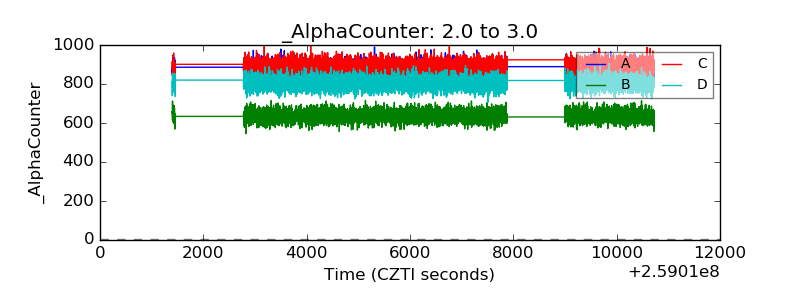 |
| _CPM_Rate | 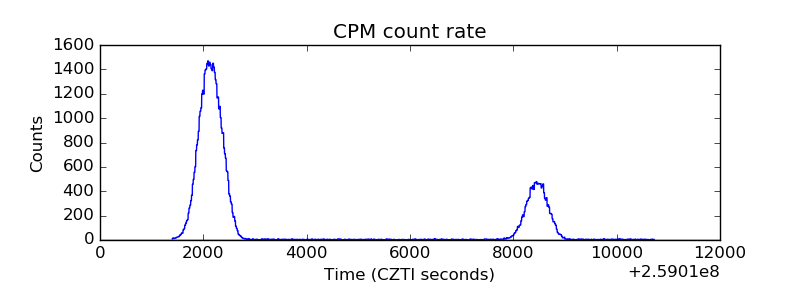 |
| CZT Counter | 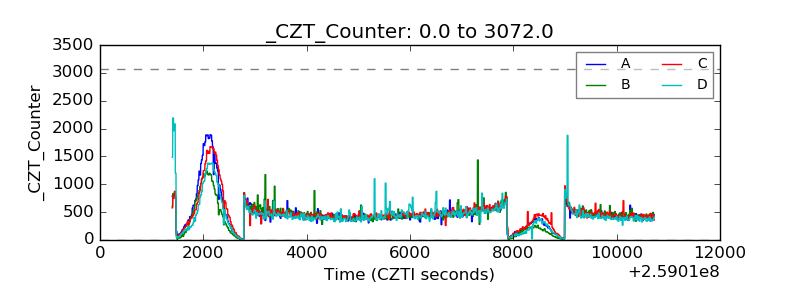 |
| +2.5 Volts monitor |  |
| +5 Volts monitor | 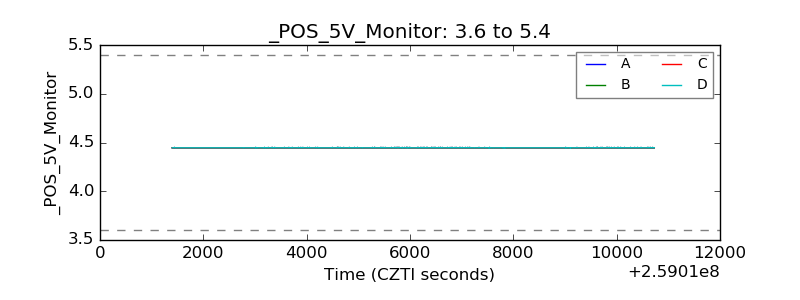 |
| _ROLL_ROT | 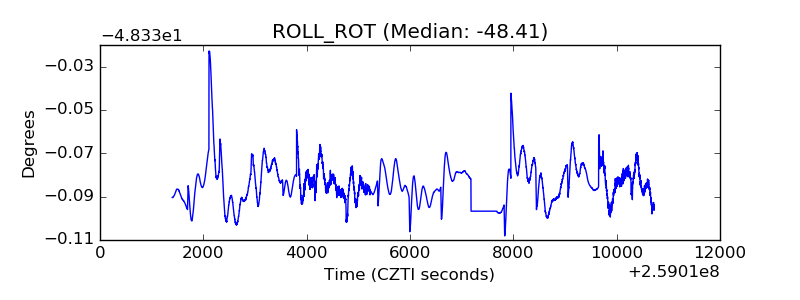 |
| _Roll_DEC | 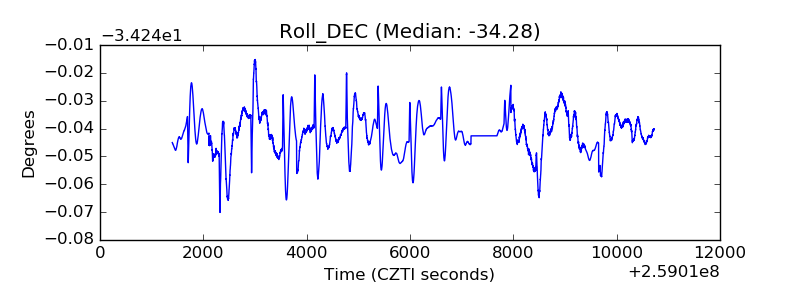 |
| _Roll_RA | 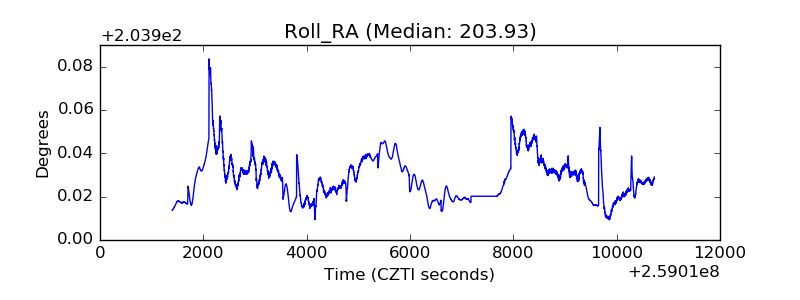 |
| Veto Counter | 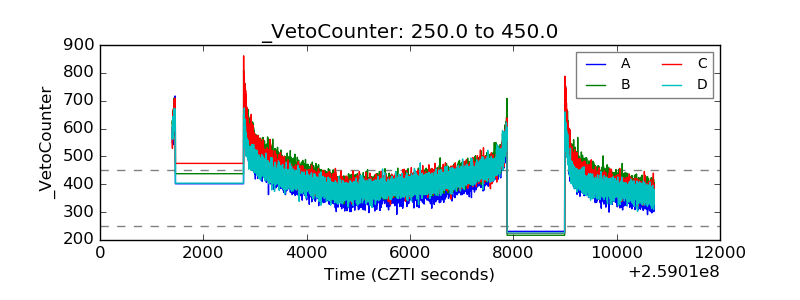 |