| Param | Original file | Final file |
|---|---|---|
| Filename | modeM0/AS1G08_082T01_9000001986_13348cztM0_level2.evt | modeM0/AS1G08_082T01_9000001986_13348cztM0_level2_quad_clean.evt |
| Size (bytes) | 472,602,240 | 99,745,920 |
| Size | 450.7 MB | 95.1 MB |
| Events in quadrant A | 3,406,152 | 631,691 |
| Events in quadrant B | 3,571,845 | 650,057 |
| Events in quadrant C | 3,464,534 | 627,874 |
| Events in quadrant D | 3,369,382 | 598,177 |
| Mode M9 | |||
|---|---|---|---|
| Quadrant | BADHDUFLAG | Total packets | Discarded packets |
| A | 0 | 19 | 0 |
| B | 0 | 19 | 0 |
| C | 0 | 19 | 0 |
| D | 0 | 19 | 0 |
| Mode M0 | |||
|---|---|---|---|
| Quadrant | BADHDUFLAG | Total packets | Discarded packets |
| A | 0 | 15234 | 3 |
| B | 0 | 15531 | 2 |
| C | 0 | 15194 | 2 |
| D | 0 | 15380 | 2 |
| Mode SS | |||
|---|---|---|---|
| Quadrant | BADHDUFLAG | Total packets | Discarded packets |
| A | 0 | 152 | 0 |
| B | 0 | 152 | 0 |
| C | 0 | 152 | 0 |
| D | 0 | 152 | 0 |
| Quadrant | Total seconds | Saturated seconds | Saturation percentage |
|---|---|---|---|
| A | 7367 | 33 | 0.447944% |
| B | 7367 | 72 | 0.977331% |
| C | 7367 | 13 | 0.176463% |
| D | 7367 | 19 | 0.257907% |
Noise dominated data is calculated using 1-second bins in cleaned event files. If a bin has >2000 counts, and if more than 50% of those come from <1% of pixels, then it is considered to be noise-dominated and hence unusable.
| Quadrant | # 1 sec bins | Bins with >0 counts | Bins with >2000 counts | High rate bins dominated by noise | Noise dominated (total time) | Noise dominated (detector-on time) | Marked lightcurve |
|---|---|---|---|---|---|---|---|
| A | 9228 | 7369 | 0 | 0 | 0.00% | 0.00% | 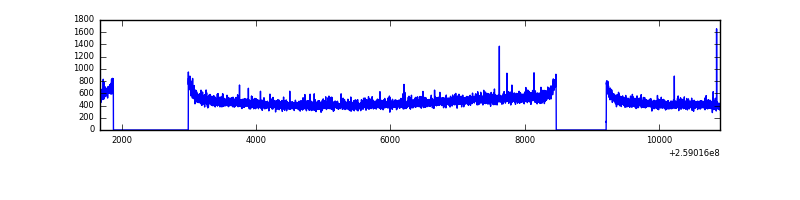 |
| B | 9228 | 7369 | 12 | 12 | 0.13% | 0.16% | 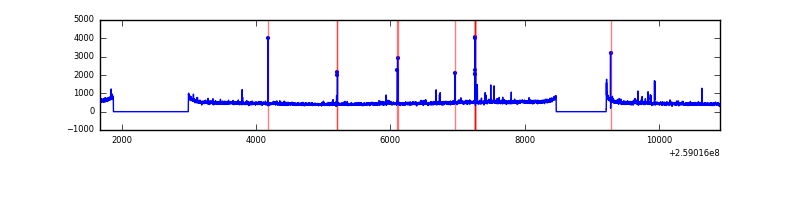 |
| C | 9228 | 7369 | 0 | 0 | 0.00% | 0.00% | 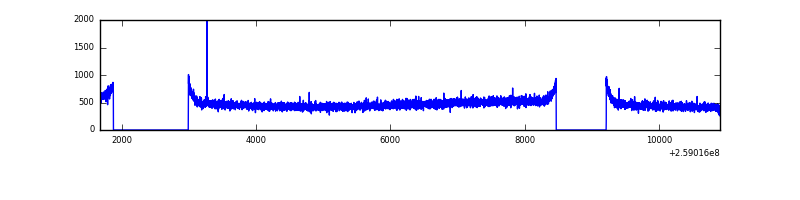 |
| D | 9228 | 7369 | 6 | 6 | 0.07% | 0.08% | 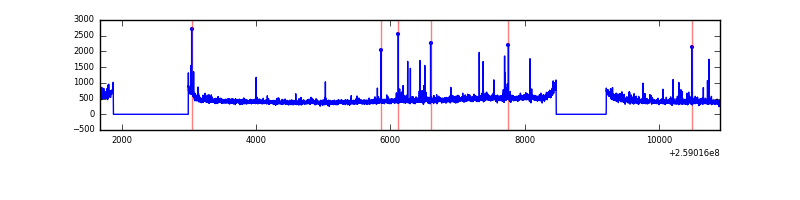 |
Top three noisy pixels from each quadrant. If the there are fewer than three noisy pixels in the level2.evt file, extra rows are filled as -1
| Pixel properties | Quadrant properties | ||||||
|---|---|---|---|---|---|---|---|
| Quadrant | DetID | PixID | Counts | Sigma | Mean | Median | Sigma |
| A | 1 | 162 | 14818 | 77.99 | 878 | 859 | 179.0 |
| A | 0 | 226 | 7788 | 38.71 | 878 | 859 | 179.0 |
| A | 12 | 194 | 6520 | 31.63 | 878 | 859 | 179.0 |
| B | 3 | 64 | 60662 | 355.31 | 886 | 863 | 168.3 |
| B | 12 | 111 | 19700 | 111.92 | 886 | 863 | 168.3 |
| B | 0 | 245 | 17289 | 97.6 | 886 | 863 | 168.3 |
| C | 3 | 233 | 113837 | 567.22 | 858 | 861 | 199.2 |
| C | 13 | 61 | 6267 | 27.14 | 858 | 861 | 199.2 |
| C | 14 | 234 | 5083 | 21.2 | 858 | 861 | 199.2 |
| D | 8 | 195 | 81275 | 395.14 | 844 | 822 | 203.6 |
| D | 2 | 136 | 46040 | 222.08 | 844 | 822 | 203.6 |
| D | 2 | 234 | 23961 | 113.65 | 844 | 822 | 203.6 |
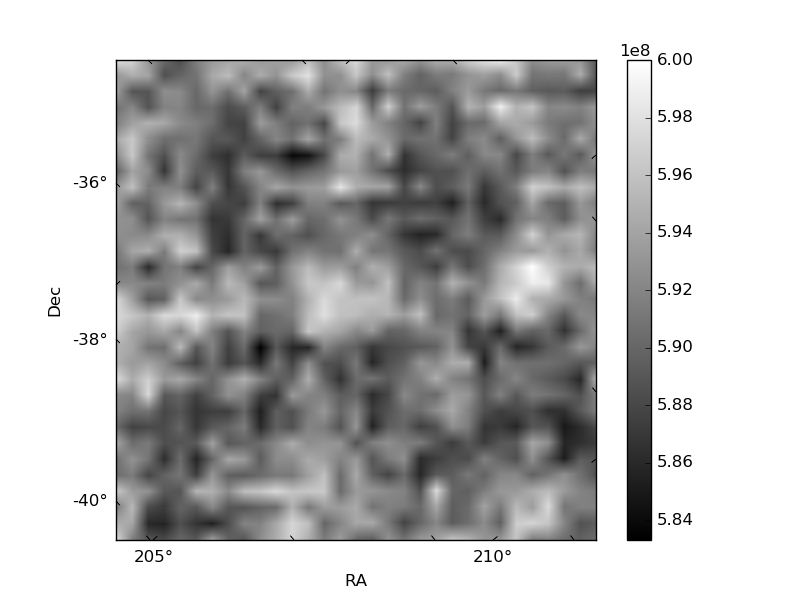
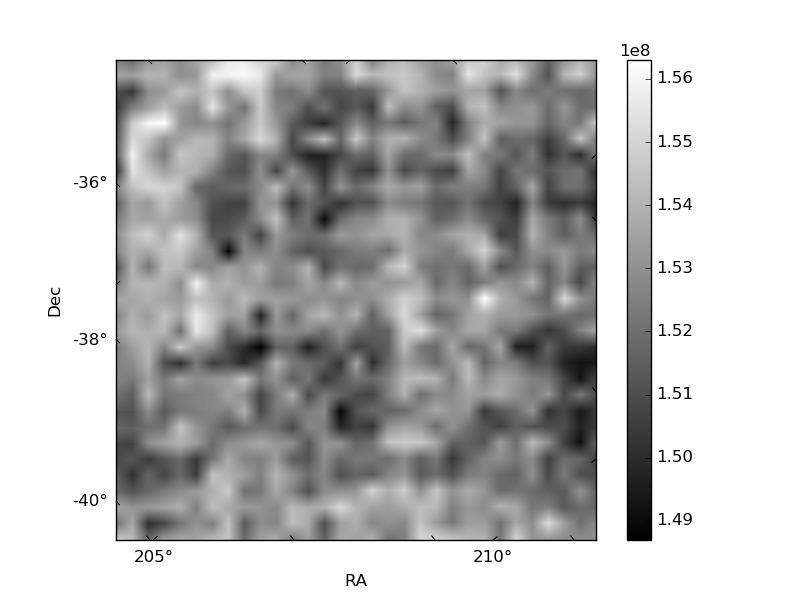
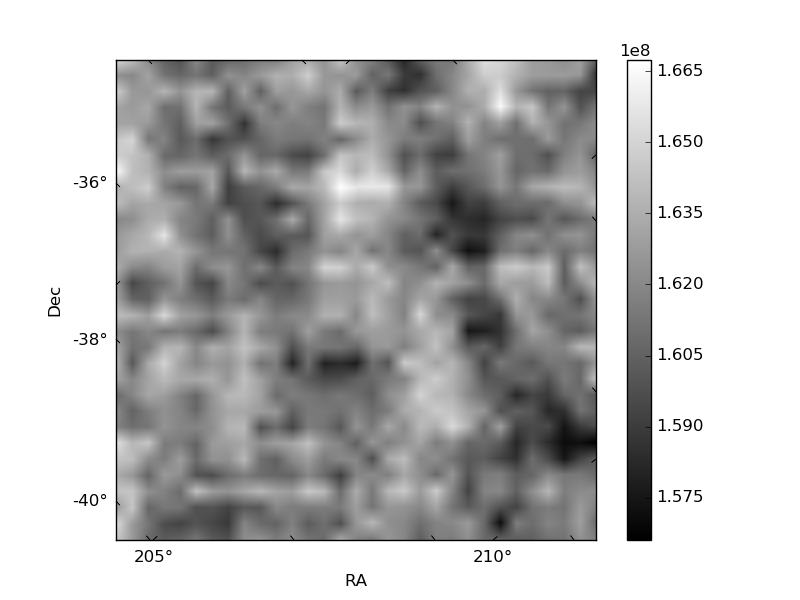
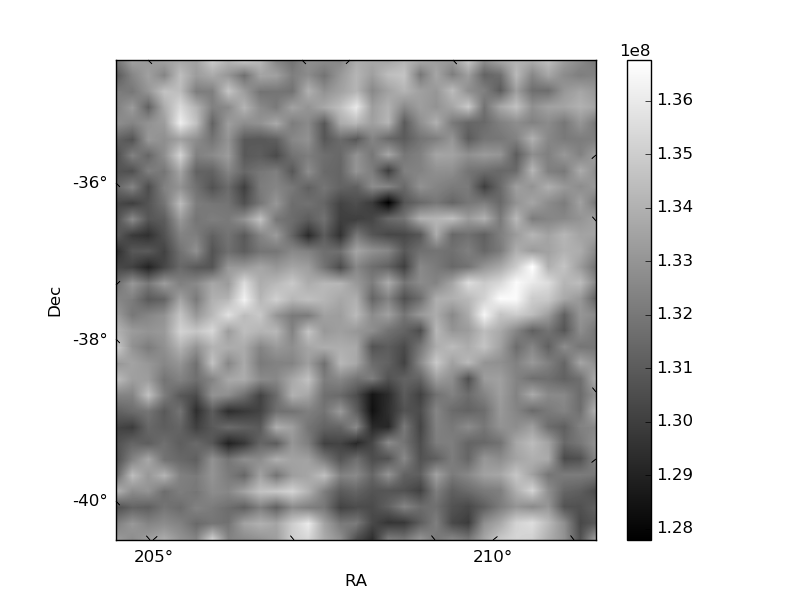
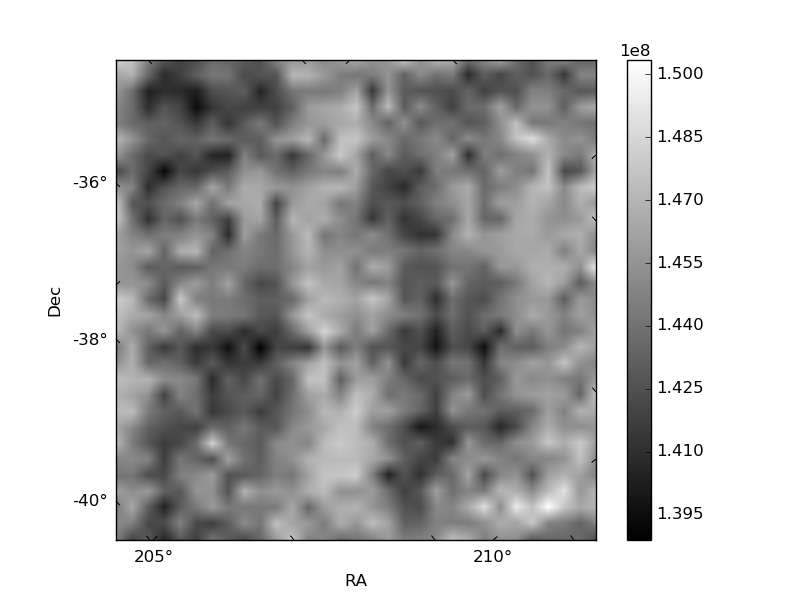
Histogram calculated using DETX and DETY for each event in the final _common_clean file
| Quadrant A | 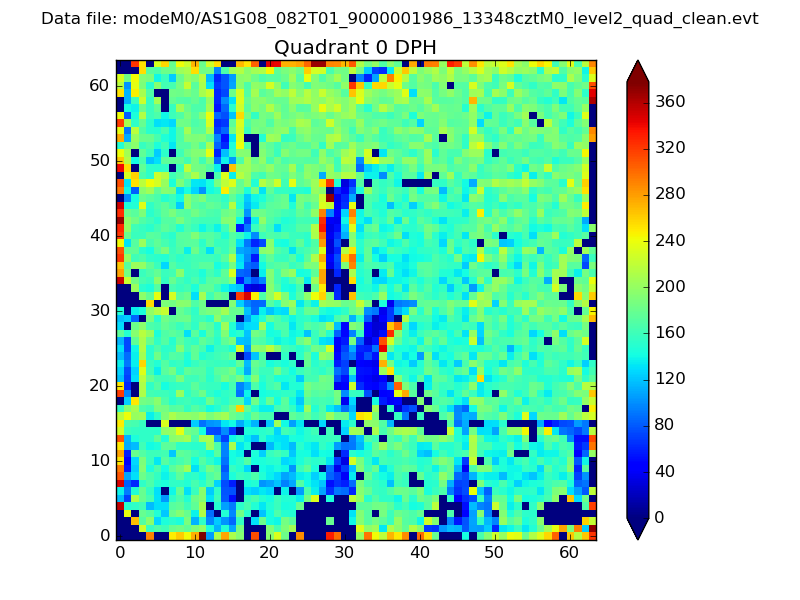 |
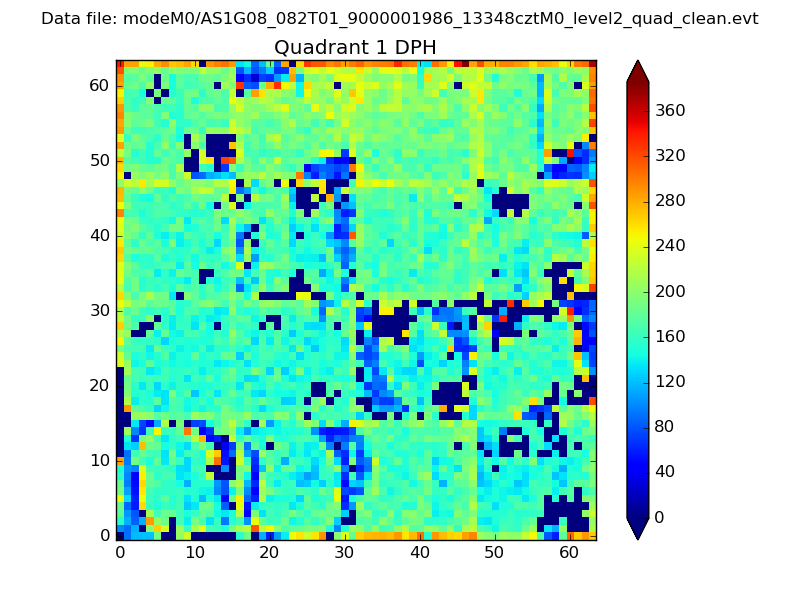 |
Quadrant B |
|---|---|---|---|
| Quadrant D | 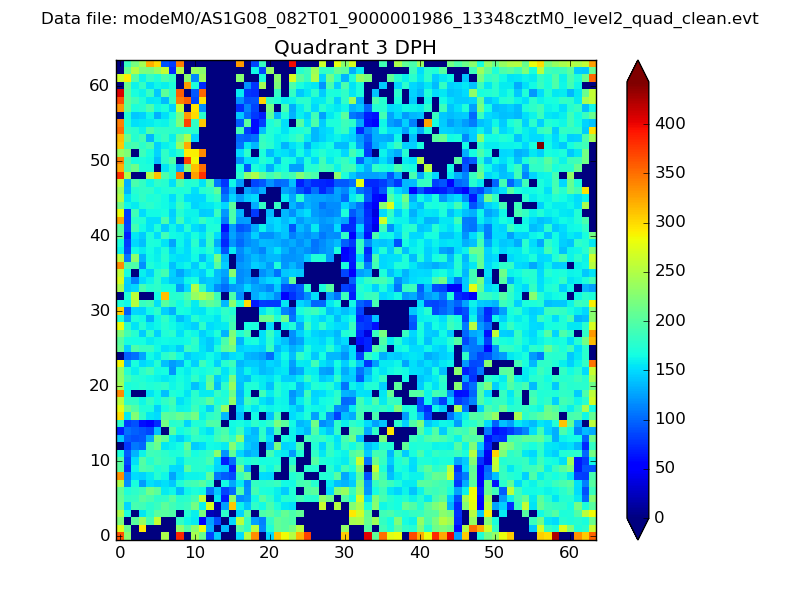 |
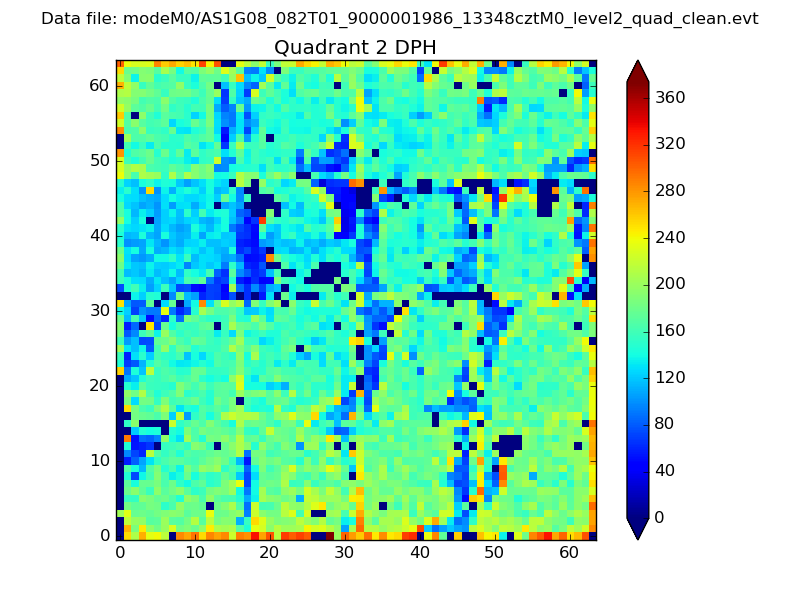 |
Quadrant C |
| Plot type | Count rate plots | Images |
|---|---|---|
| Comparison with Poisson distribution Blue bars denote a histogram of data divided into 1 sec bins. Red curve is a Poisson curve with rate = median count rate of data. |
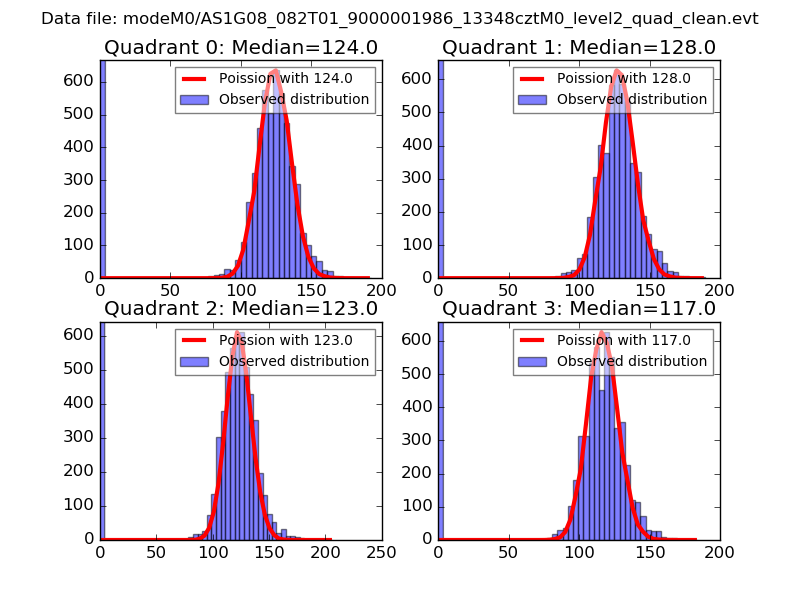 |
 |
| Quadrant-wise count rates Data is divided into 100 sec bins |
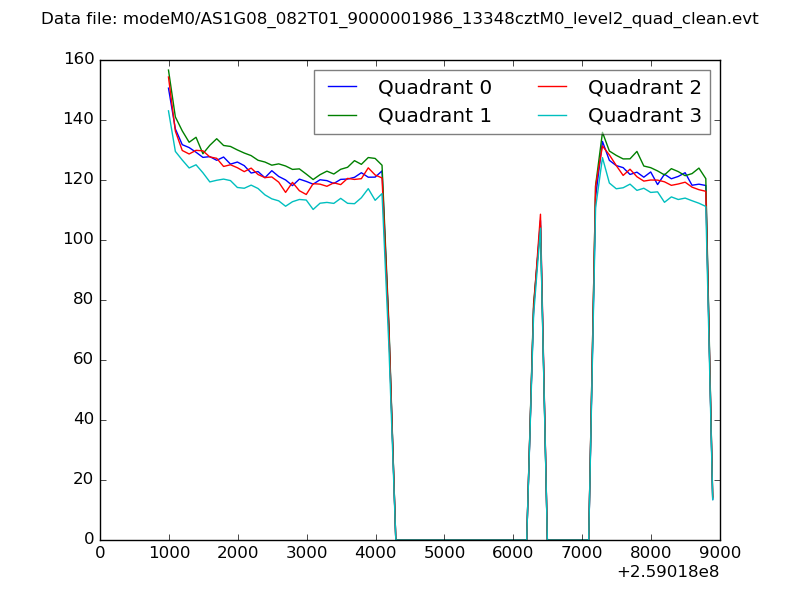 |
|
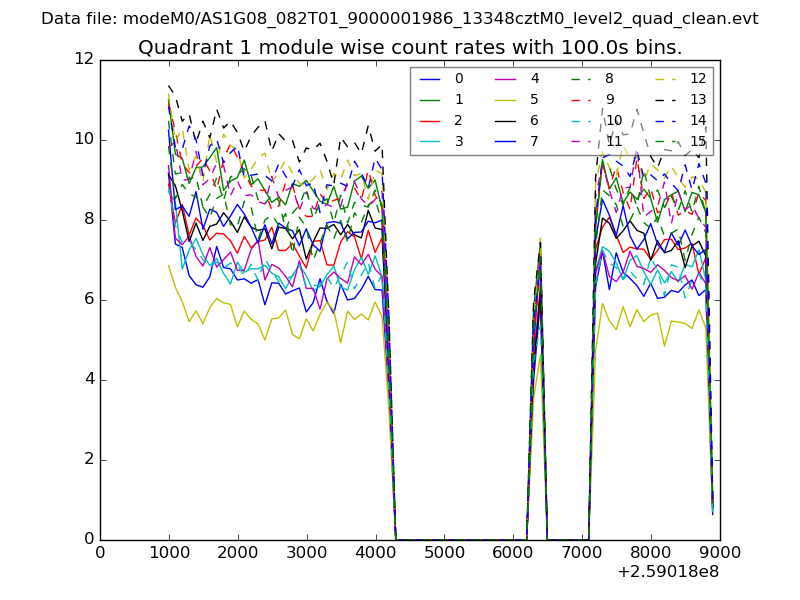
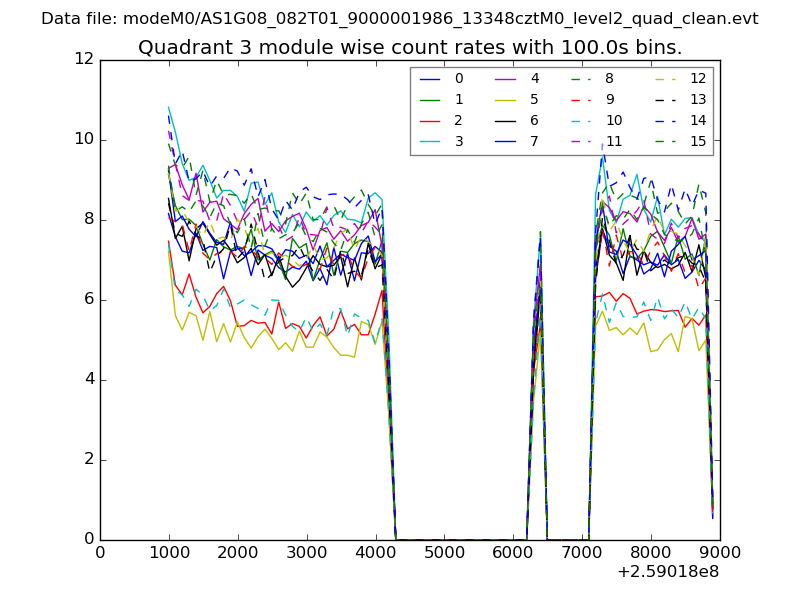
| Module-wise count rates for Quadrant A Data is divided into 100 sec bins |
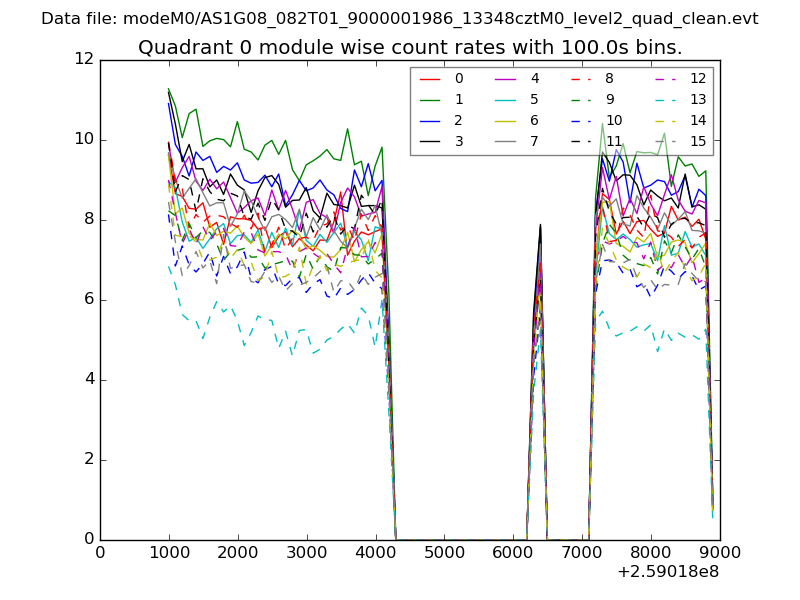 |
 |
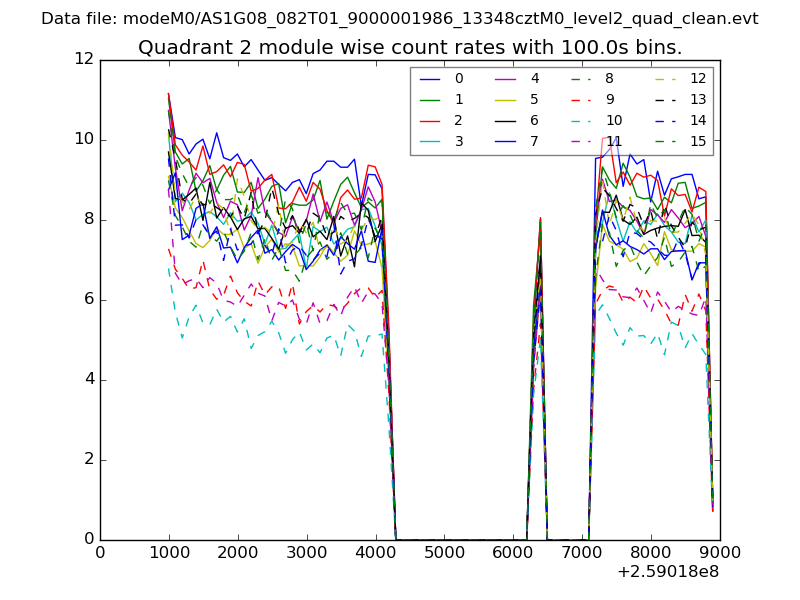
| Module-wise count rates for Quadrant B Data is divided into 100 sec bins |
 |
 |
| Module-wise count rates for Quadrant C Data is divided into 100 sec bins |
 |
 |
| Module-wise count rates for Quadrant D Data is divided into 100 sec bins |
 |
 |
| Parameter | Plot |
|---|---|
| CZT HV Monitor | 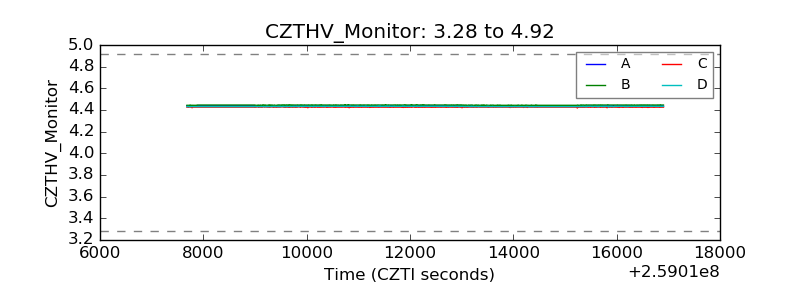 |
| D_VDD | 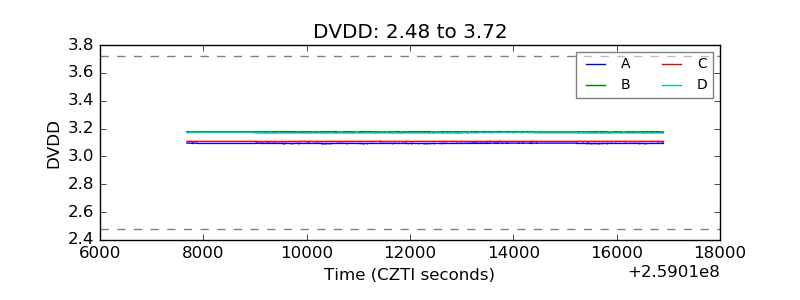 |
| Temperature 1 | 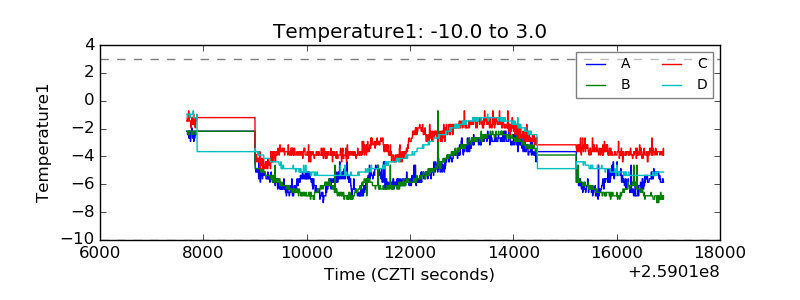 |
| Veto HV Monitor | 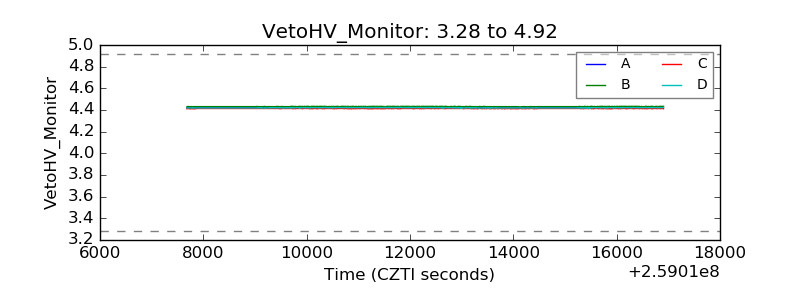 |
| Veto LLD | 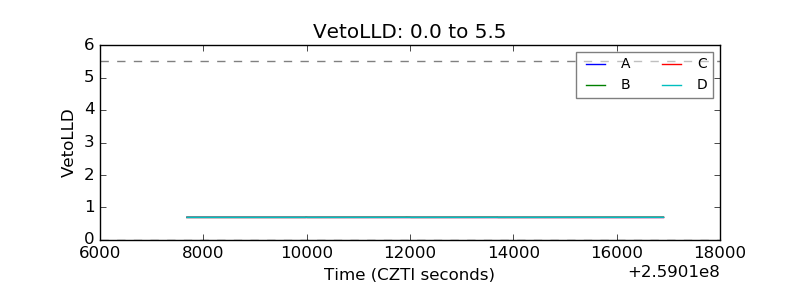 |
| Alpha Counter | 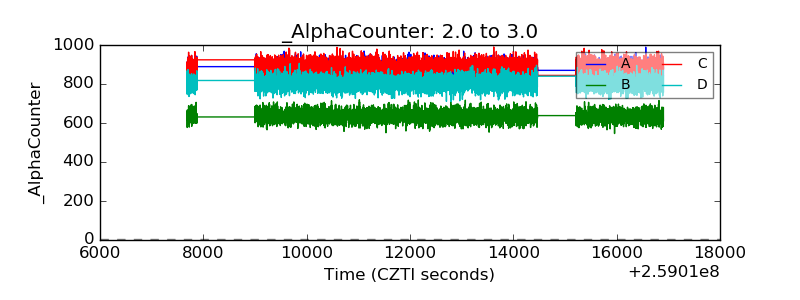 |
| _CPM_Rate | 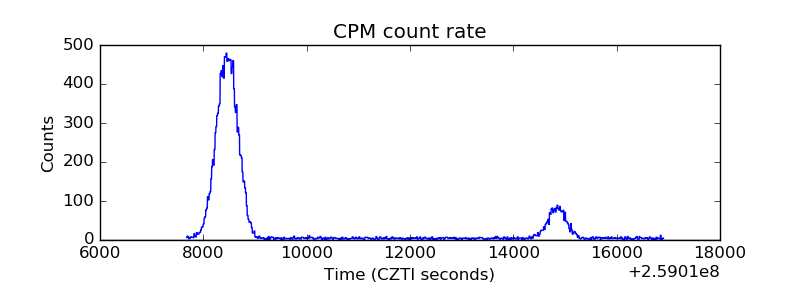 |
| CZT Counter | 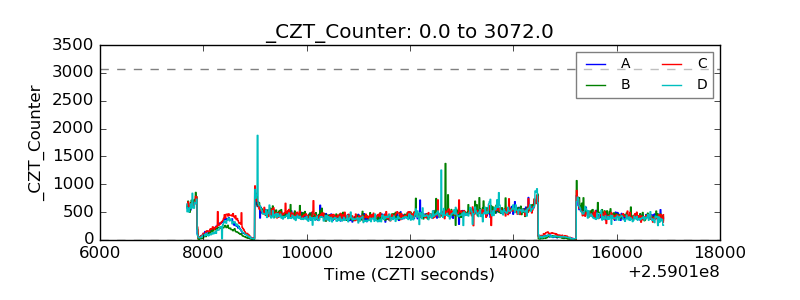 |
| +2.5 Volts monitor |  |
| +5 Volts monitor |  |
| _ROLL_ROT | 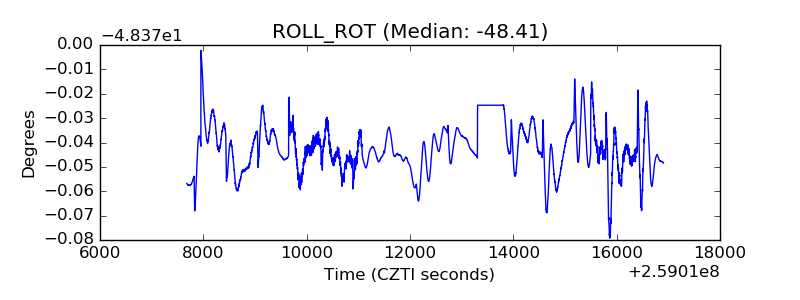 |
| _Roll_DEC | 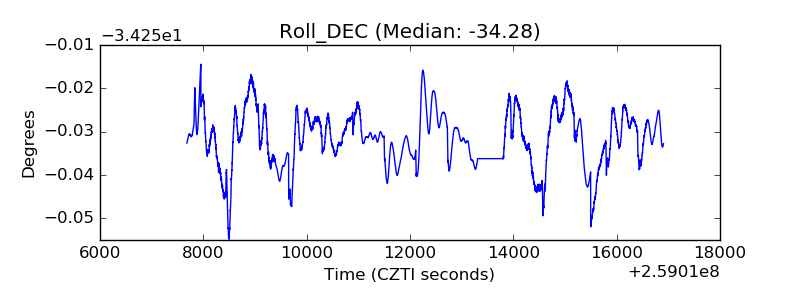 |
| _Roll_RA | 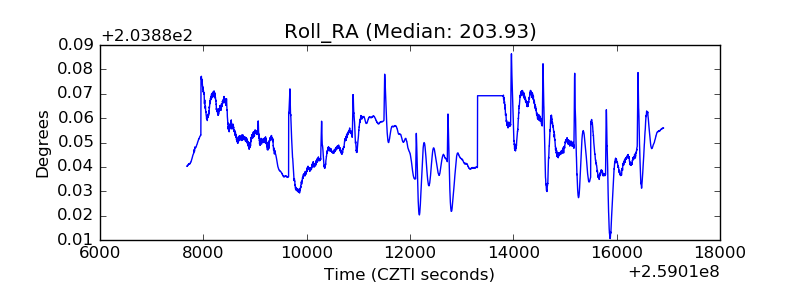 |
| Veto Counter | 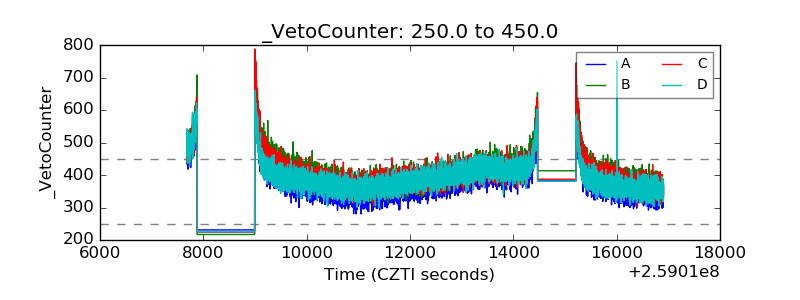 |