| Param | Original file | Final file |
|---|---|---|
| Filename | modeM0/AS1G08_082T01_9000001986_13349cztM0_level2.evt | modeM0/AS1G08_082T01_9000001986_13349cztM0_level2_quad_clean.evt |
| Size (bytes) | 537,986,880 | 110,833,920 |
| Size | 513.1 MB | 105.7 MB |
| Events in quadrant A | 3,848,724 | 699,964 |
| Events in quadrant B | 4,015,530 | 718,211 |
| Events in quadrant C | 3,897,546 | 695,296 |
| Events in quadrant D | 3,966,941 | 665,959 |
| Mode M9 | |||
|---|---|---|---|
| Quadrant | BADHDUFLAG | Total packets | Discarded packets |
| A | 0 | 11 | 0 |
| B | 0 | 11 | 0 |
| C | 0 | 11 | 0 |
| D | 0 | 11 | 0 |
| Mode M0 | |||
|---|---|---|---|
| Quadrant | BADHDUFLAG | Total packets | Discarded packets |
| A | 0 | 17126 | 3 |
| B | 0 | 17477 | 2 |
| C | 0 | 17112 | 2 |
| D | 0 | 17609 | 2 |
| Mode SS | |||
|---|---|---|---|
| Quadrant | BADHDUFLAG | Total packets | Discarded packets |
| A | 0 | 170 | 0 |
| B | 0 | 170 | 0 |
| C | 0 | 170 | 0 |
| D | 0 | 170 | 0 |
| Quadrant | Total seconds | Saturated seconds | Saturation percentage |
|---|---|---|---|
| A | 8317 | 35 | 0.420825% |
| B | 8317 | 65 | 0.781532% |
| C | 8317 | 33 | 0.396778% |
| D | 8317 | 24 | 0.288566% |
Noise dominated data is calculated using 1-second bins in cleaned event files. If a bin has >2000 counts, and if more than 50% of those come from <1% of pixels, then it is considered to be noise-dominated and hence unusable.
| Quadrant | # 1 sec bins | Bins with >0 counts | Bins with >2000 counts | High rate bins dominated by noise | Noise dominated (total time) | Noise dominated (detector-on time) | Marked lightcurve |
|---|---|---|---|---|---|---|---|
| A | 9348 | 8321 | 0 | 0 | 0.00% | 0.00% | 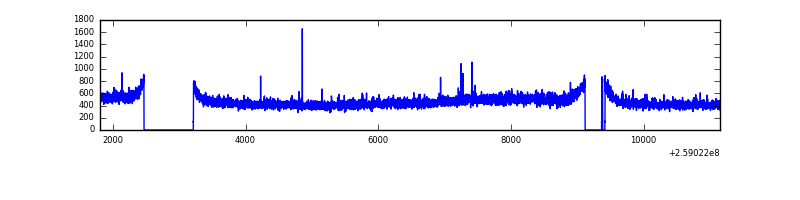 |
| B | 9348 | 8321 | 5 | 5 | 0.05% | 0.06% | 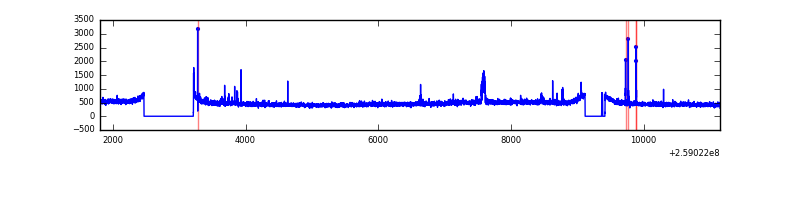 |
| C | 9348 | 8321 | 2 | 2 | 0.02% | 0.02% |  |
| D | 9348 | 8321 | 7 | 7 | 0.07% | 0.08% | 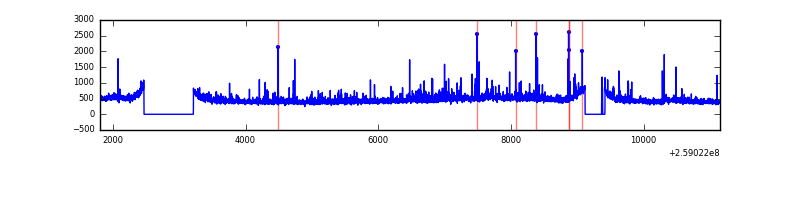 |
Top three noisy pixels from each quadrant. If the there are fewer than three noisy pixels in the level2.evt file, extra rows are filled as -1
| Pixel properties | Quadrant properties | ||||||
|---|---|---|---|---|---|---|---|
| Quadrant | DetID | PixID | Counts | Sigma | Mean | Median | Sigma |
| A | 1 | 162 | 17364 | 80.66 | 992 | 971 | 203.2 |
| A | 0 | 226 | 8680 | 37.93 | 992 | 971 | 203.2 |
| A | 12 | 194 | 7504 | 32.15 | 992 | 971 | 203.2 |
| B | 0 | 230 | 57663 | 296.29 | 998 | 972 | 191.3 |
| B | 3 | 64 | 29544 | 149.33 | 998 | 972 | 191.3 |
| B | 12 | 111 | 22602 | 113.05 | 998 | 972 | 191.3 |
| C | 3 | 233 | 92267 | 404.62 | 971 | 976 | 225.6 |
| C | 6 | 253 | 10325 | 41.44 | 971 | 976 | 225.6 |
| C | 13 | 61 | 7130 | 27.28 | 971 | 976 | 225.6 |
| D | 1 | 52 | 126731 | 544.82 | 958 | 930 | 230.9 |
| D | 8 | 195 | 112438 | 482.92 | 958 | 930 | 230.9 |
| D | 5 | 222 | 35976 | 151.78 | 958 | 930 | 230.9 |
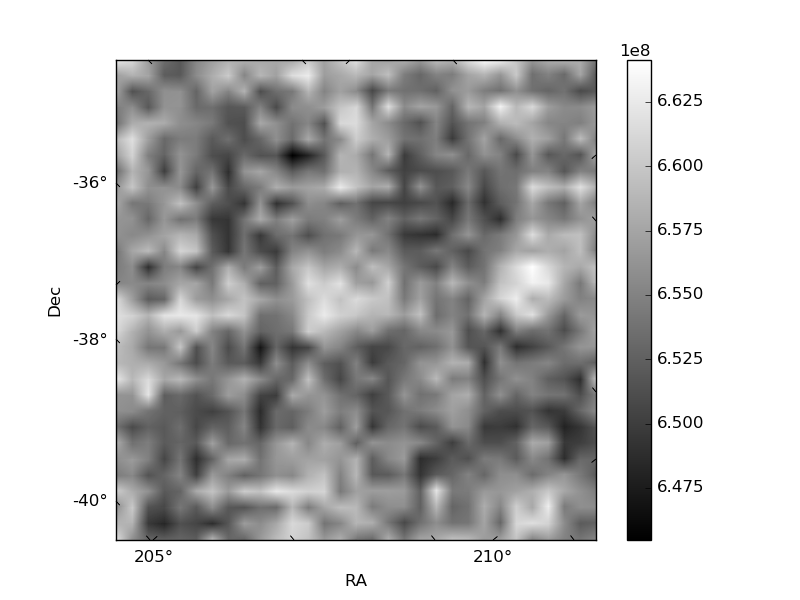
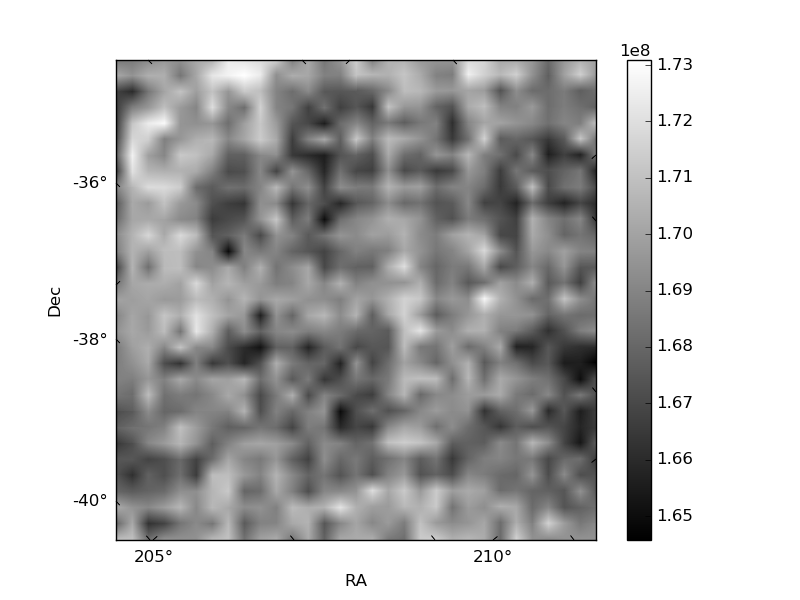
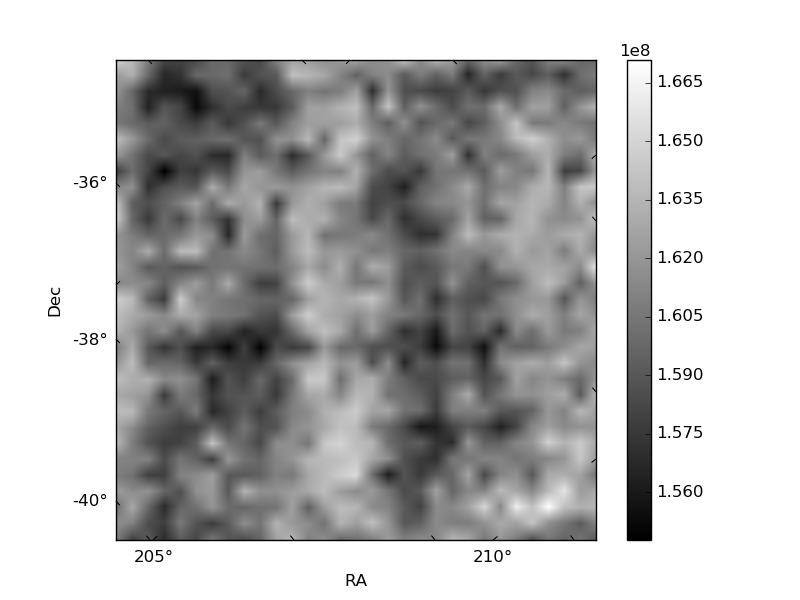
Histogram calculated using DETX and DETY for each event in the final _common_clean file
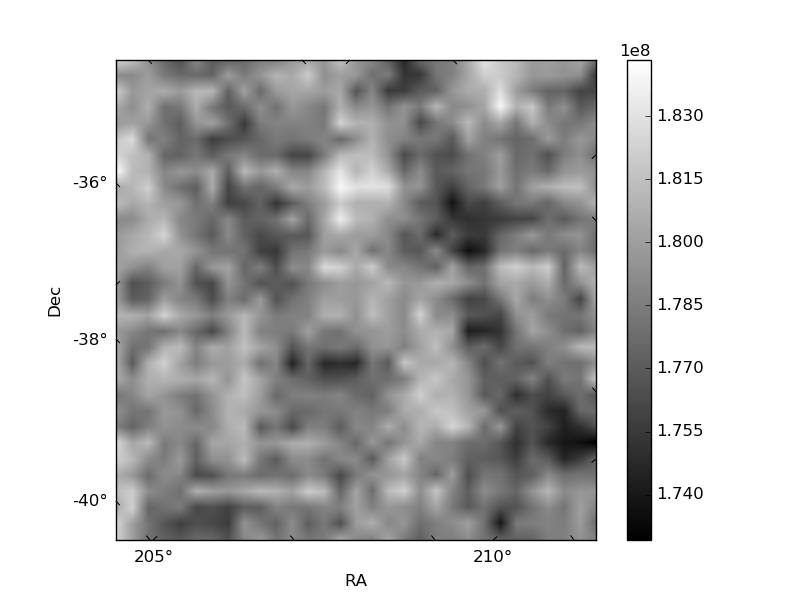
| Quadrant A | 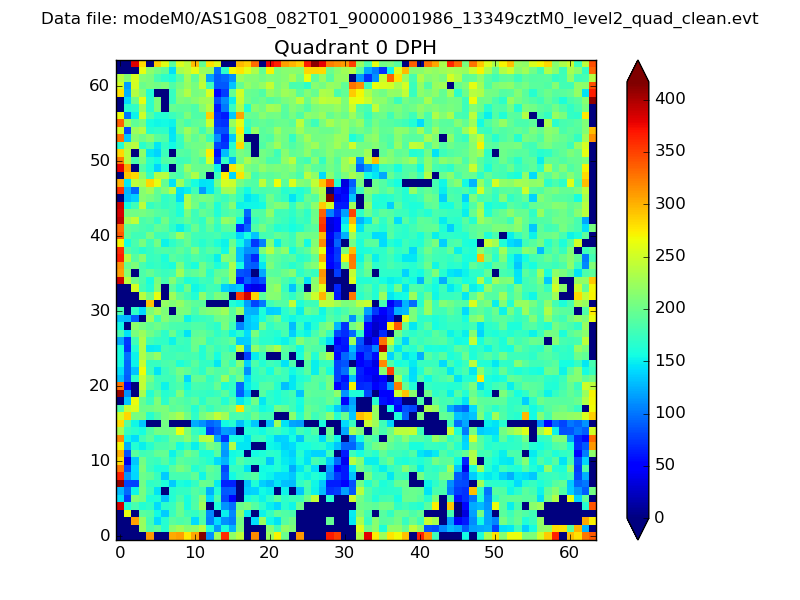 |
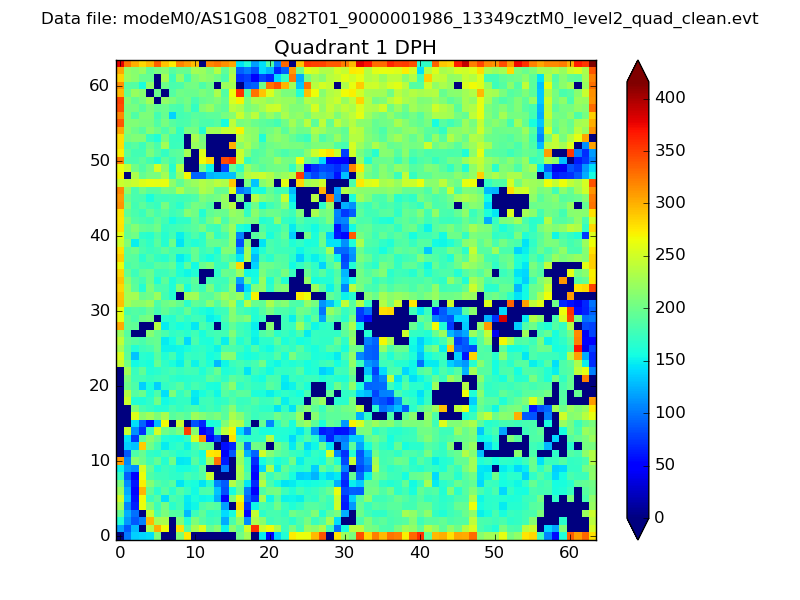 |
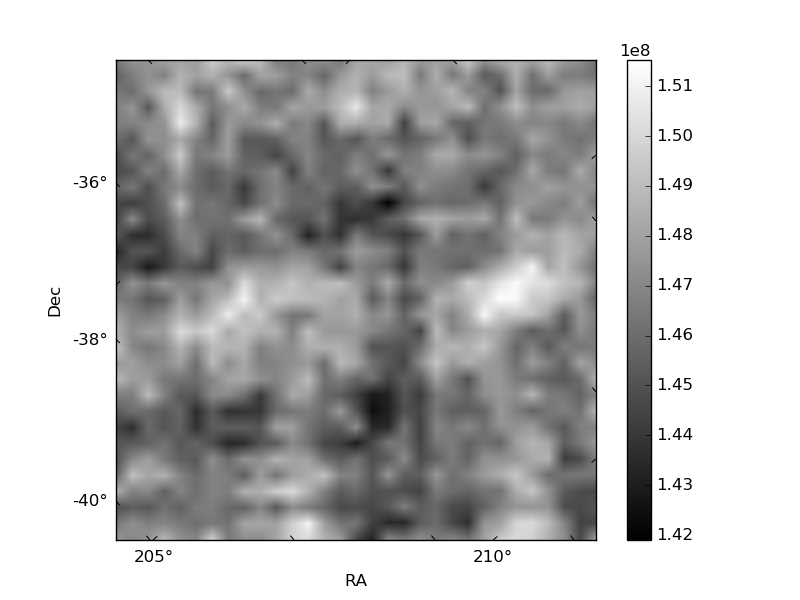
Quadrant B |
|---|---|---|---|
| Quadrant D | 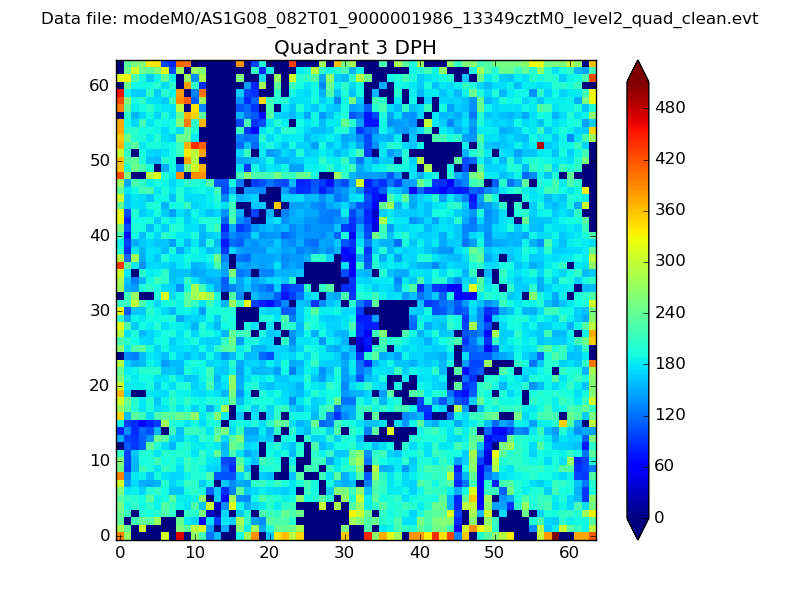 |
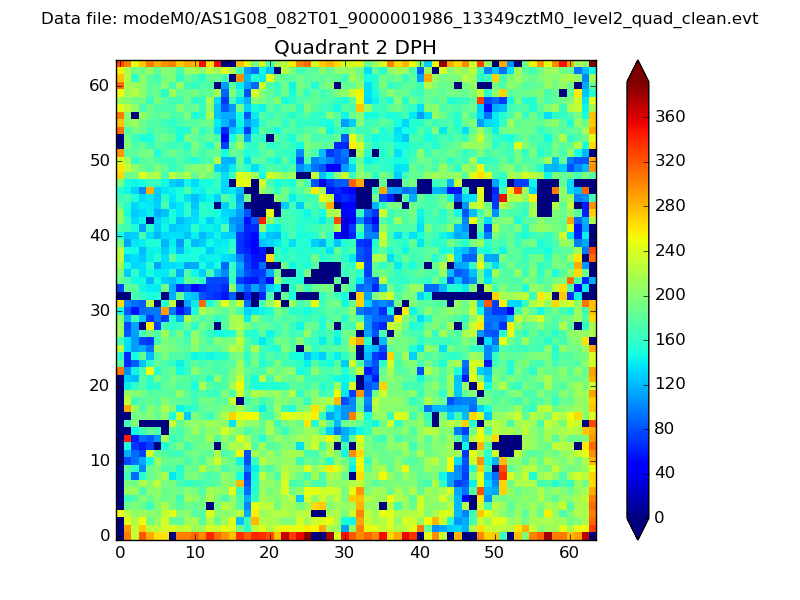 |
Quadrant C |
| Plot type | Count rate plots | Images |
|---|---|---|
| Comparison with Poisson distribution Blue bars denote a histogram of data divided into 1 sec bins. Red curve is a Poisson curve with rate = median count rate of data. |
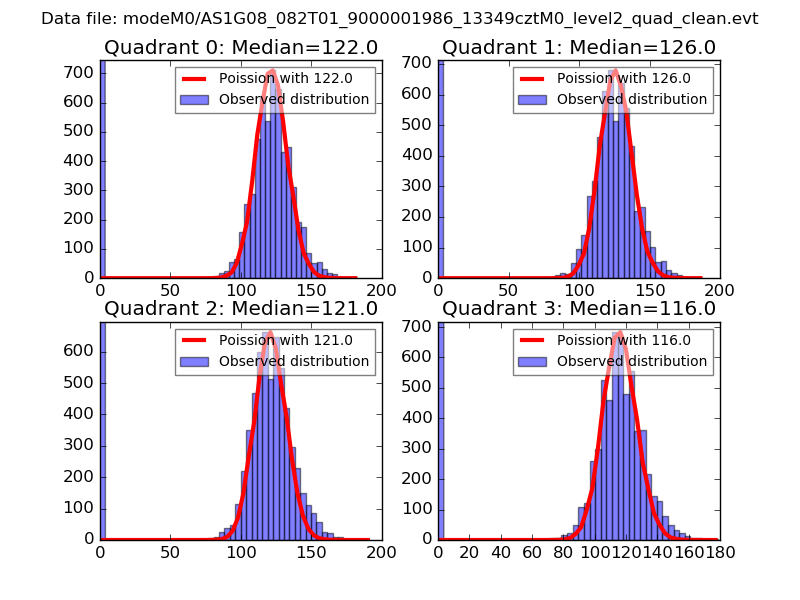 |
 |
| Quadrant-wise count rates Data is divided into 100 sec bins |
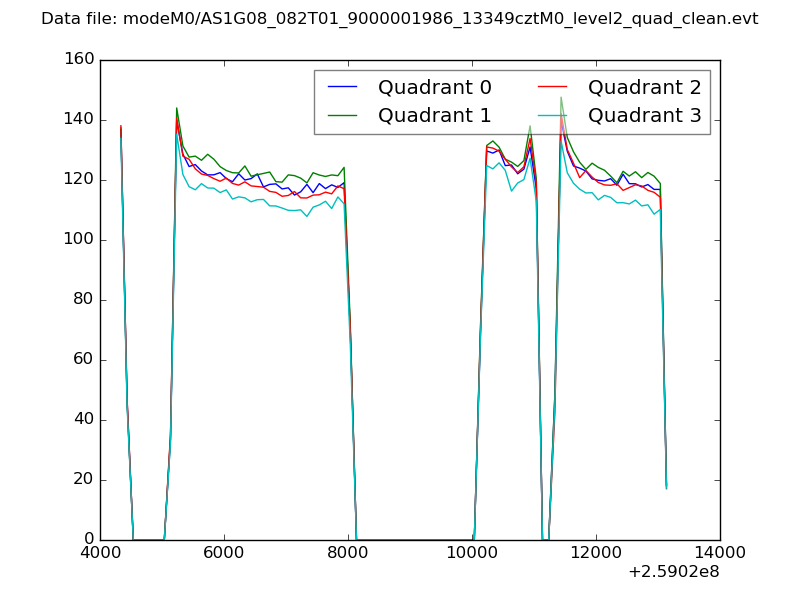 |
|
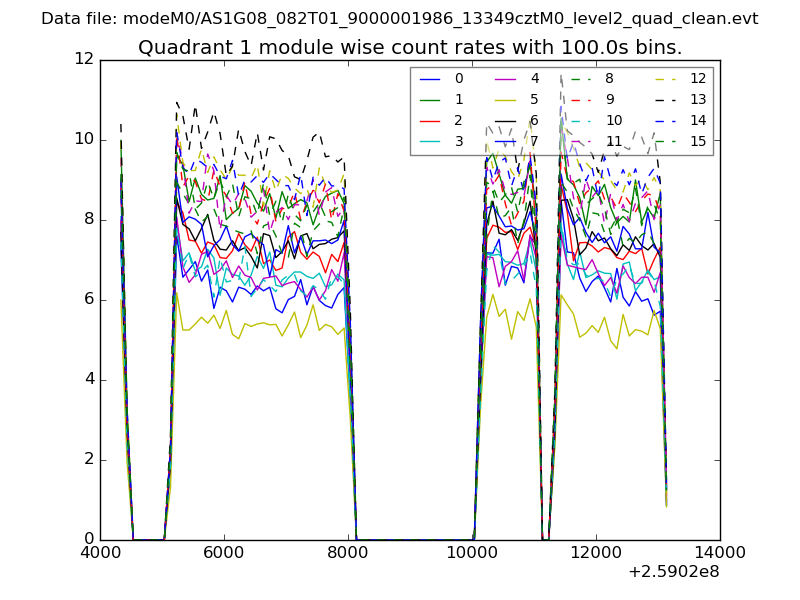
| Module-wise count rates for Quadrant A Data is divided into 100 sec bins |
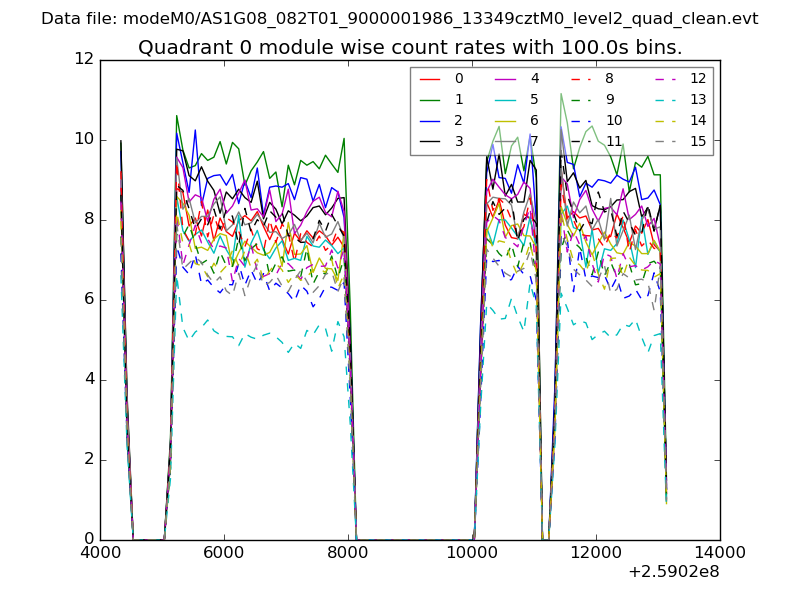 |
 |
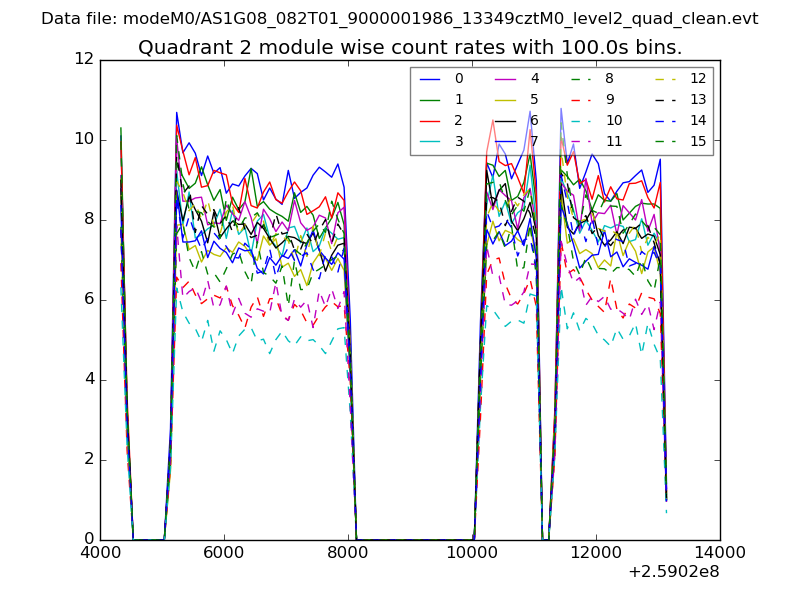
| Module-wise count rates for Quadrant B Data is divided into 100 sec bins |
 |
 |
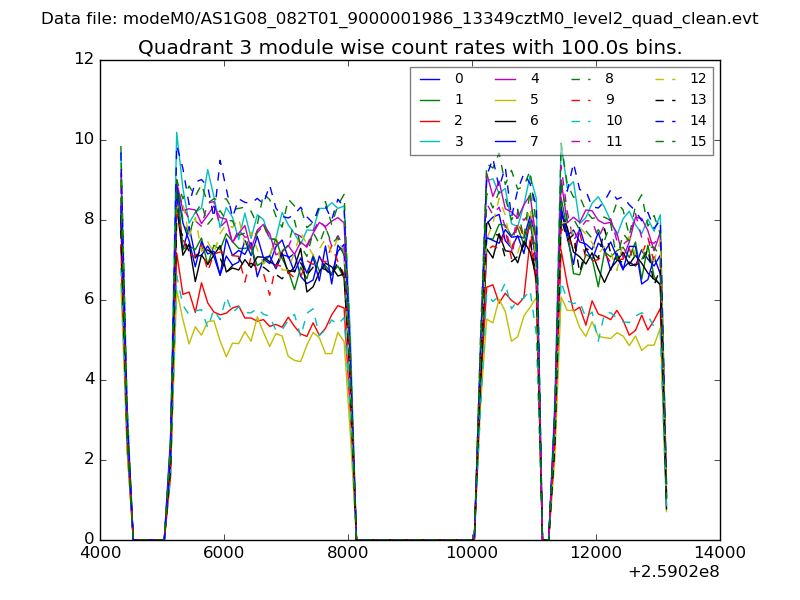
| Module-wise count rates for Quadrant C Data is divided into 100 sec bins |
 |
 |
| Module-wise count rates for Quadrant D Data is divided into 100 sec bins |
 |
 |
| Parameter | Plot |
|---|---|
| CZT HV Monitor | 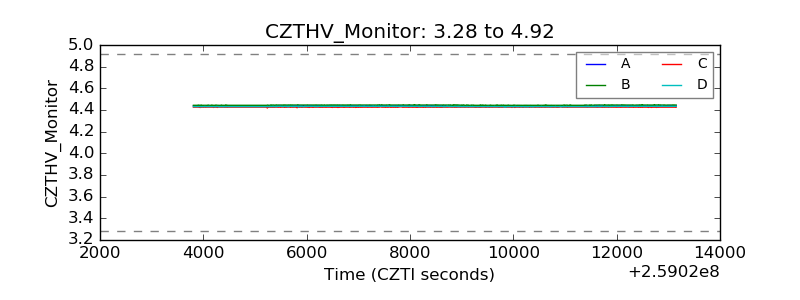 |
| D_VDD | 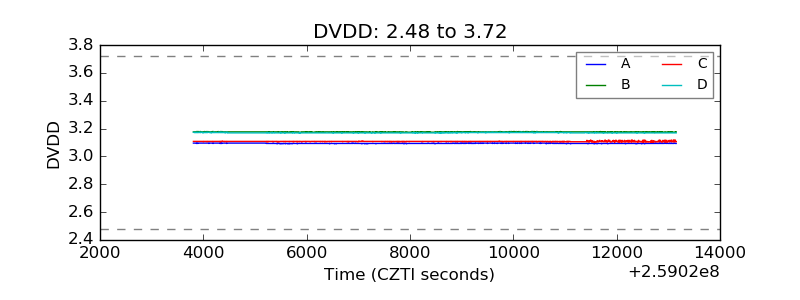 |
| Temperature 1 | 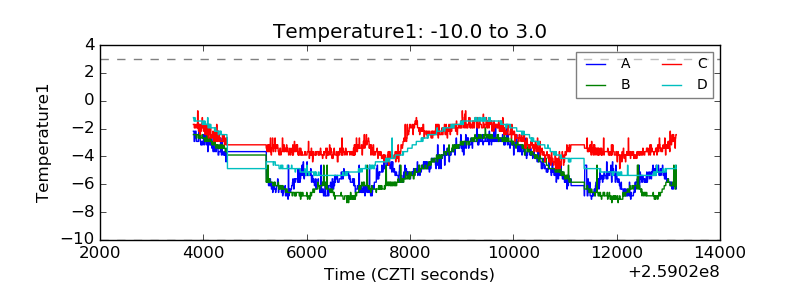 |
| Veto HV Monitor | 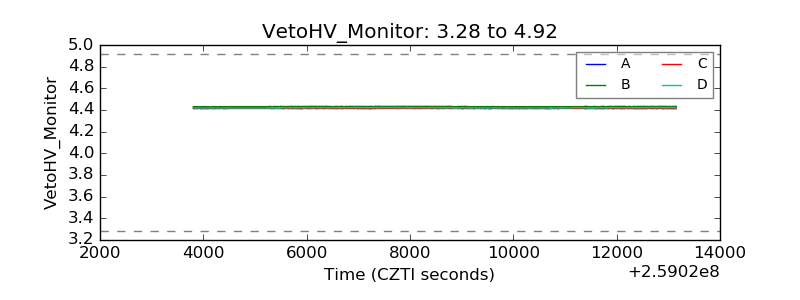 |
| Veto LLD | 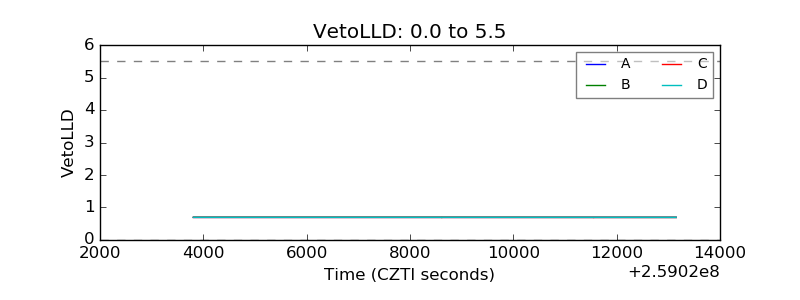 |
| Alpha Counter | 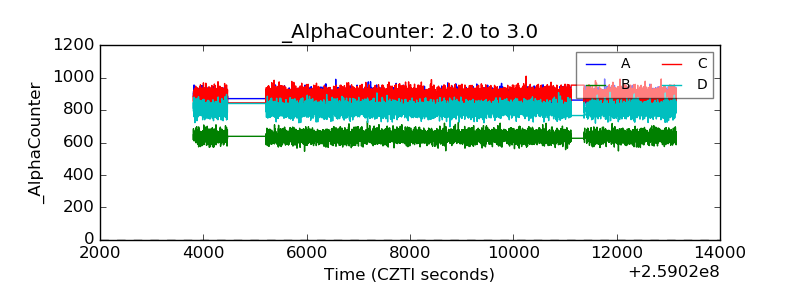 |
| _CPM_Rate | 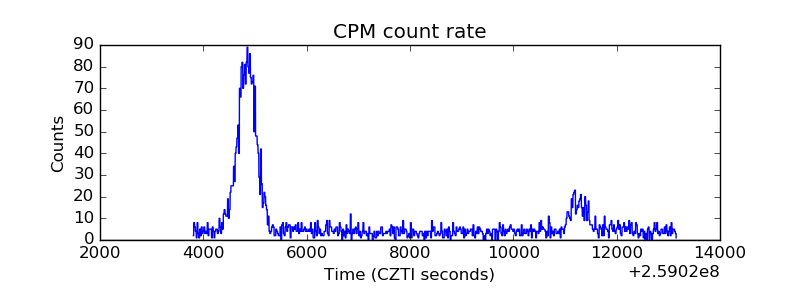 |
| CZT Counter | 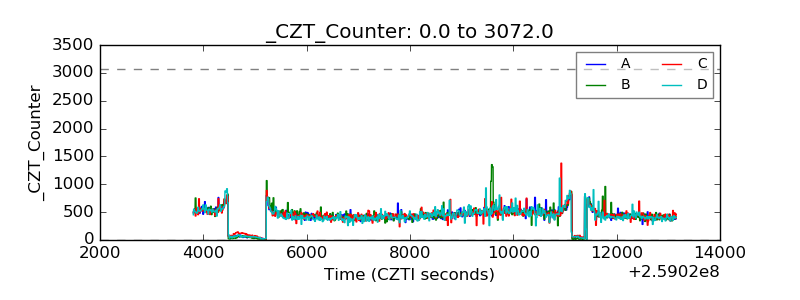 |
| +2.5 Volts monitor |  |
| +5 Volts monitor | 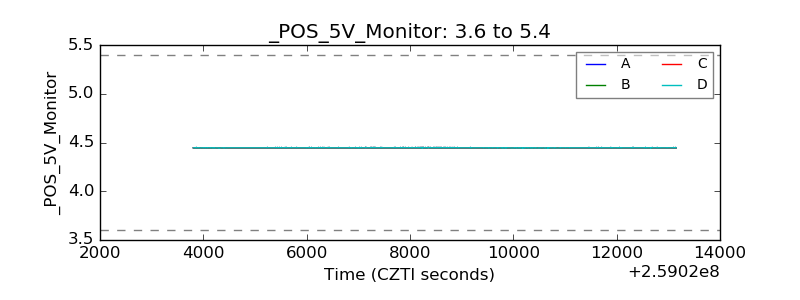 |
| _ROLL_ROT | 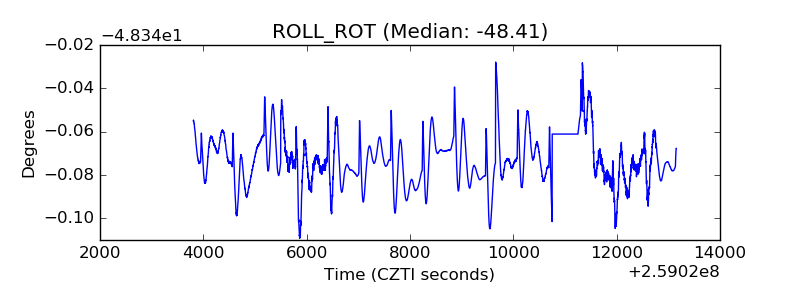 |
| _Roll_DEC | 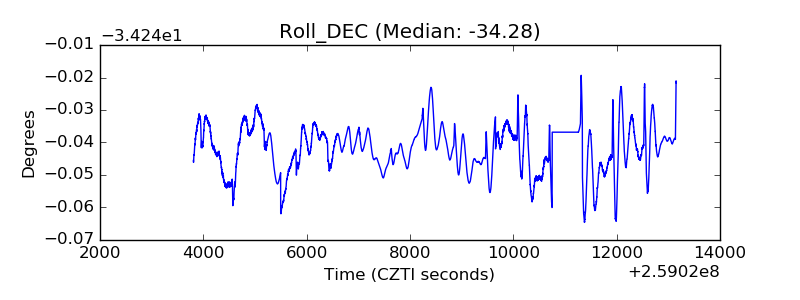 |
| _Roll_RA | 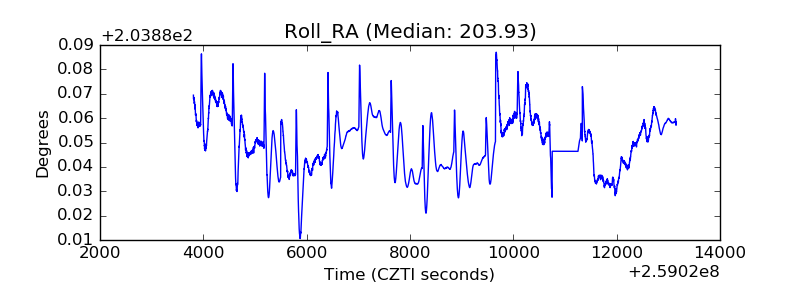 |
| Veto Counter | 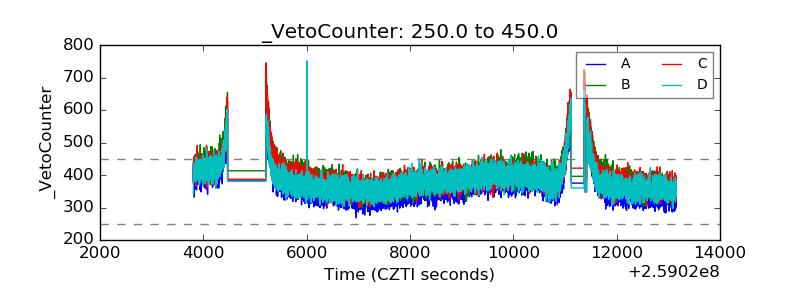 |