| Param | Original file | Final file |
|---|---|---|
| Filename | modeM0/AS1G08_082T01_9000001986_13353cztM0_level2.evt | modeM0/AS1G08_082T01_9000001986_13353cztM0_level2_quad_clean.evt |
| Size (bytes) | 219,231,360 | 30,862,080 |
| Size | 209.1 MB | 29.4 MB |
| Events in quadrant A | 1,422,231 | 176,357 |
| Events in quadrant B | 1,444,279 | 182,355 |
| Events in quadrant C | 1,460,672 | 175,936 |
| Events in quadrant D | 2,088,979 | 168,018 |
| Mode M0 | |||
|---|---|---|---|
| Quadrant | BADHDUFLAG | Total packets | Discarded packets |
| A | 0 | 6523 | 1 |
| B | 0 | 6532 | 0 |
| C | 0 | 6560 | 0 |
| D | 0 | 8464 | 0 |
| Mode SS | |||
|---|---|---|---|
| Quadrant | BADHDUFLAG | Total packets | Discarded packets |
| A | 0 | 66 | 0 |
| B | 0 | 66 | 0 |
| C | 0 | 66 | 0 |
| D | 0 | 66 | 0 |
| Quadrant | Total seconds | Saturated seconds | Saturation percentage |
|---|---|---|---|
| A | 3252 | 2 | 0.061501% |
| B | 3252 | 1 | 0.030750% |
| C | 3252 | 1 | 0.030750% |
| D | 3252 | 117 | 3.597786% |
Noise dominated data is calculated using 1-second bins in cleaned event files. If a bin has >2000 counts, and if more than 50% of those come from <1% of pixels, then it is considered to be noise-dominated and hence unusable.
| Quadrant | # 1 sec bins | Bins with >0 counts | Bins with >2000 counts | High rate bins dominated by noise | Noise dominated (total time) | Noise dominated (detector-on time) | Marked lightcurve |
|---|---|---|---|---|---|---|---|
| A | 3253 | 3253 | 0 | 0 | 0.00% | 0.00% | 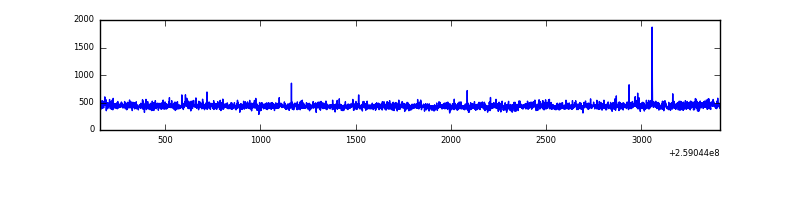 |
| B | 3253 | 3253 | 0 | 0 | 0.00% | 0.00% | 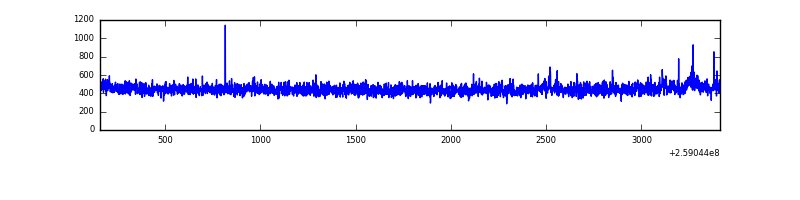 |
| C | 3253 | 3253 | 0 | 0 | 0.00% | 0.00% | 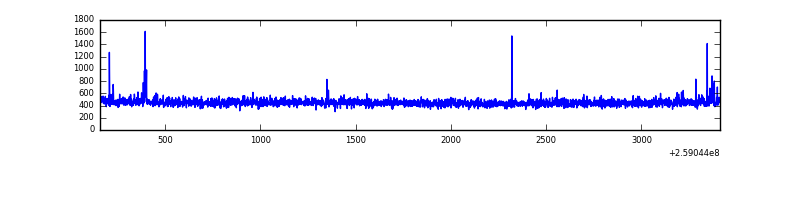 |
| D | 3253 | 3253 | 97 | 97 | 2.98% | 2.98% | 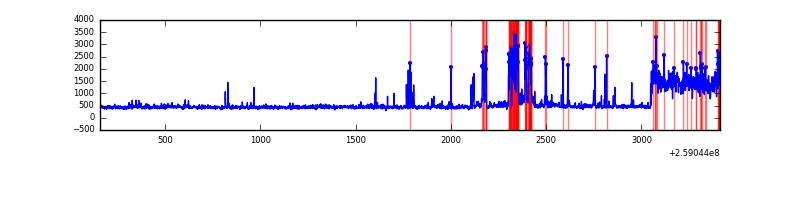 |
Top three noisy pixels from each quadrant. If the there are fewer than three noisy pixels in the level2.evt file, extra rows are filled as -1
| Pixel properties | Quadrant properties | ||||||
|---|---|---|---|---|---|---|---|
| Quadrant | DetID | PixID | Counts | Sigma | Mean | Median | Sigma |
| A | 9 | 143 | 5578 | 68.84 | 365 | 358 | 75.8 |
| A | 1 | 162 | 3946 | 47.32 | 365 | 358 | 75.8 |
| A | 0 | 226 | 3142 | 36.72 | 365 | 358 | 75.8 |
| B | 0 | 230 | 9549 | 130.01 | 364 | 355 | 70.7 |
| B | 12 | 111 | 8150 | 110.22 | 364 | 355 | 70.7 |
| B | 11 | 111 | 6829 | 91.54 | 364 | 355 | 70.7 |
| C | 3 | 233 | 32224 | 373.89 | 361 | 362 | 85.2 |
| C | 14 | 220 | 17741 | 203.94 | 361 | 362 | 85.2 |
| C | 13 | 61 | 2585 | 26.09 | 361 | 362 | 85.2 |
| D | 5 | 222 | 598858 | 6834.09 | 355 | 344 | 87.6 |
| D | 8 | 195 | 68811 | 781.79 | 355 | 344 | 87.6 |
| D | 13 | 249 | 59211 | 672.17 | 355 | 344 | 87.6 |
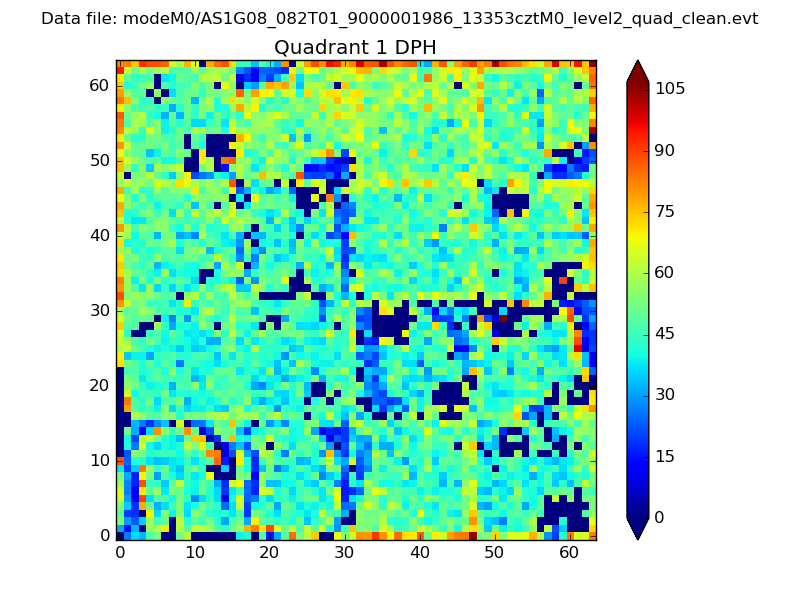
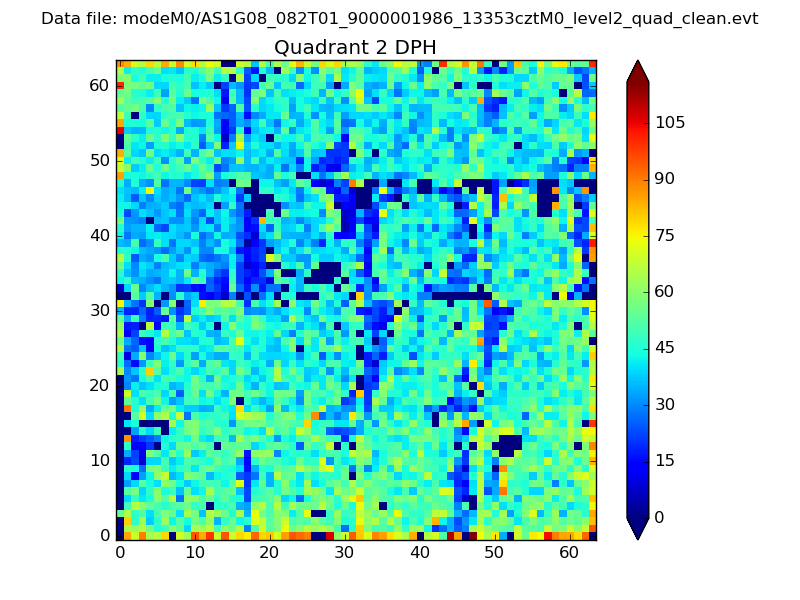
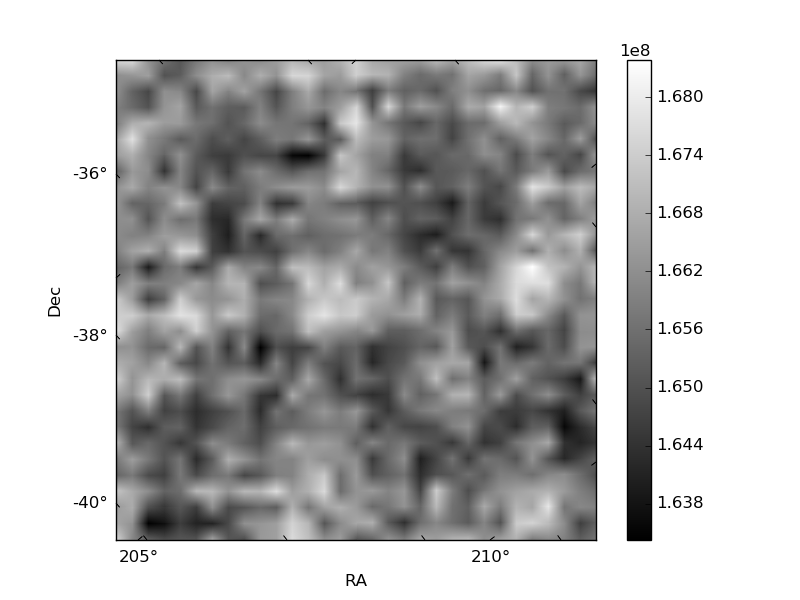
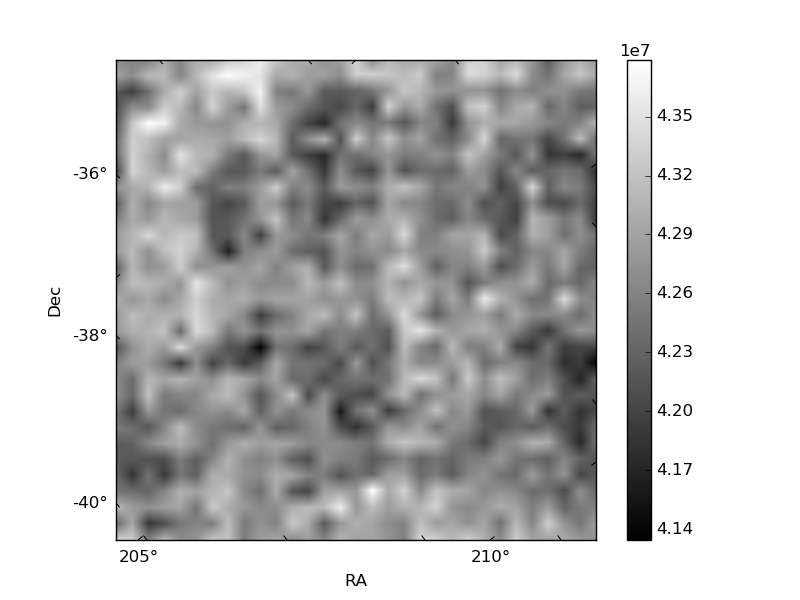
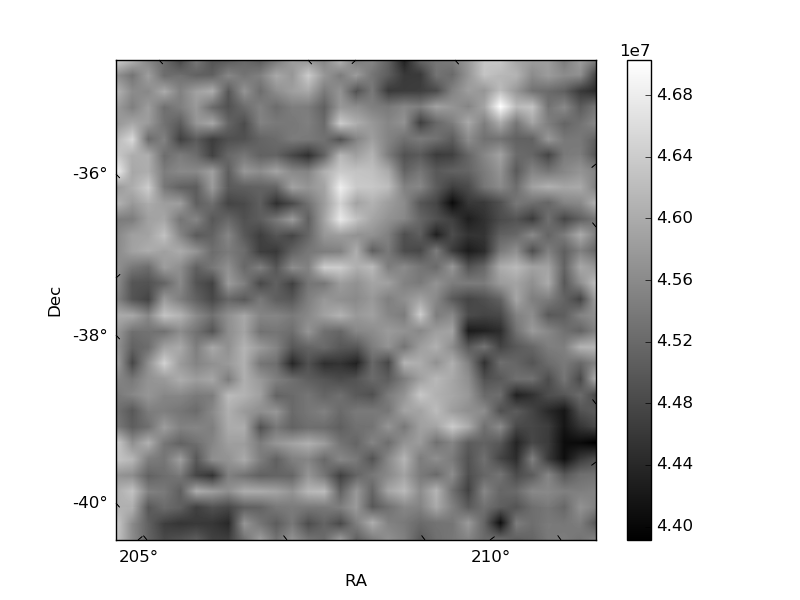
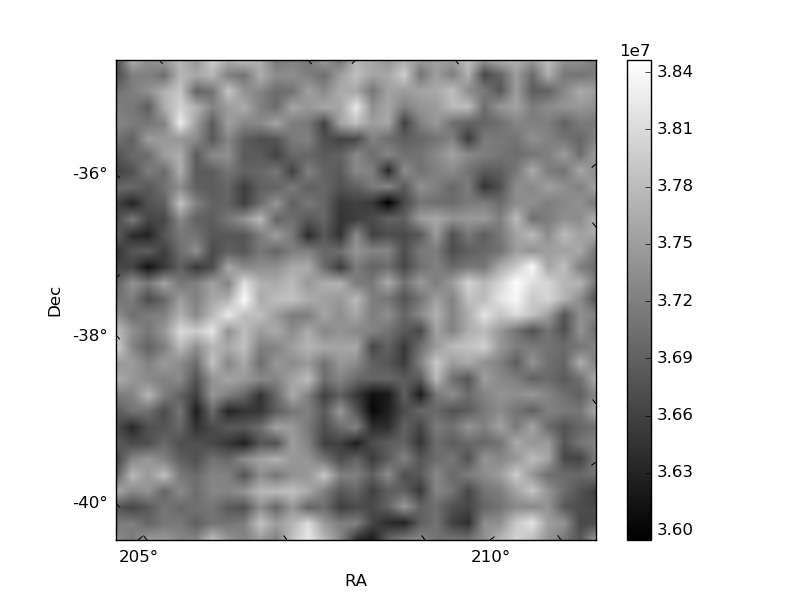
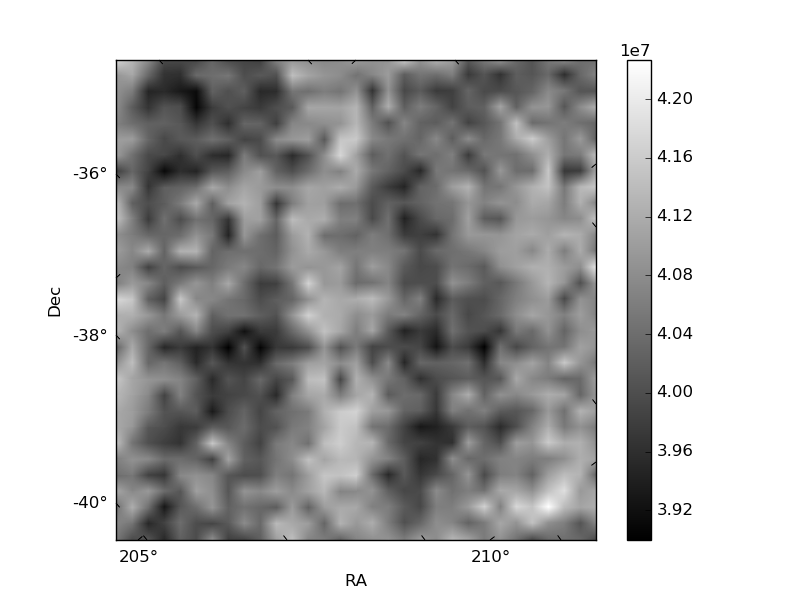
Histogram calculated using DETX and DETY for each event in the final _common_clean file
| Quadrant A |  |
 |
Quadrant B |
|---|---|---|---|
| Quadrant D | 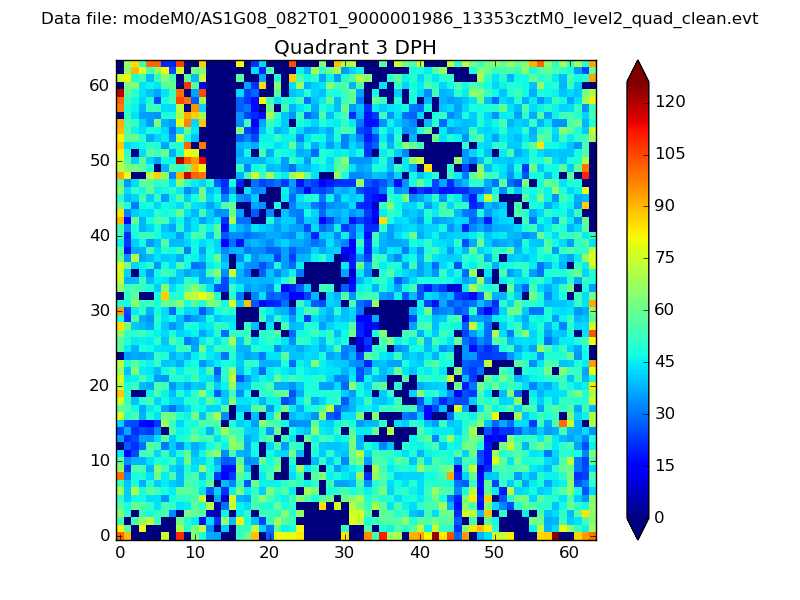 |
 |
Quadrant C |
| Plot type | Count rate plots | Images |
|---|---|---|
| Comparison with Poisson distribution Blue bars denote a histogram of data divided into 1 sec bins. Red curve is a Poisson curve with rate = median count rate of data. |
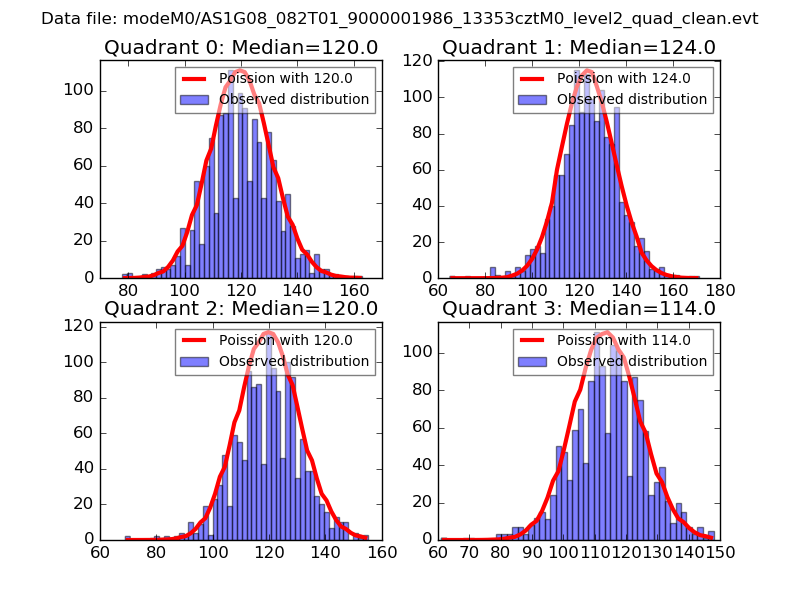 |
 |
| Quadrant-wise count rates Data is divided into 100 sec bins |
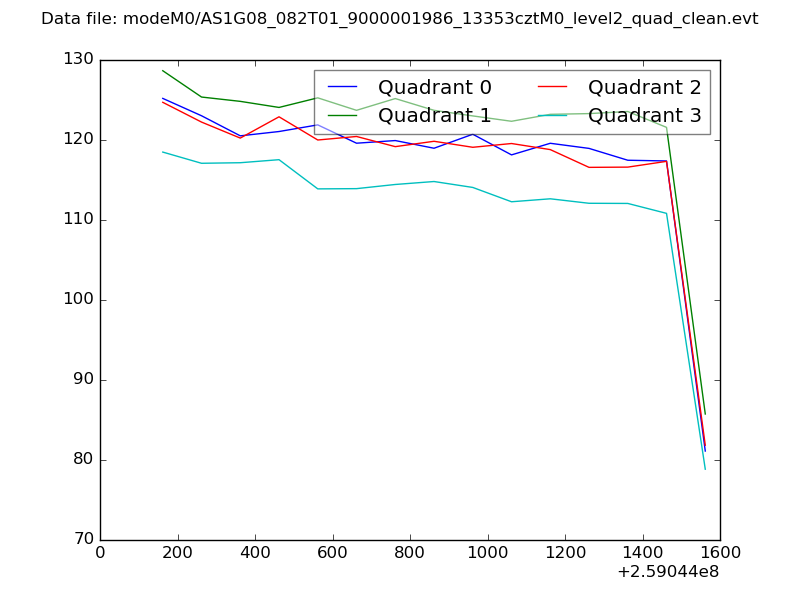 |
|
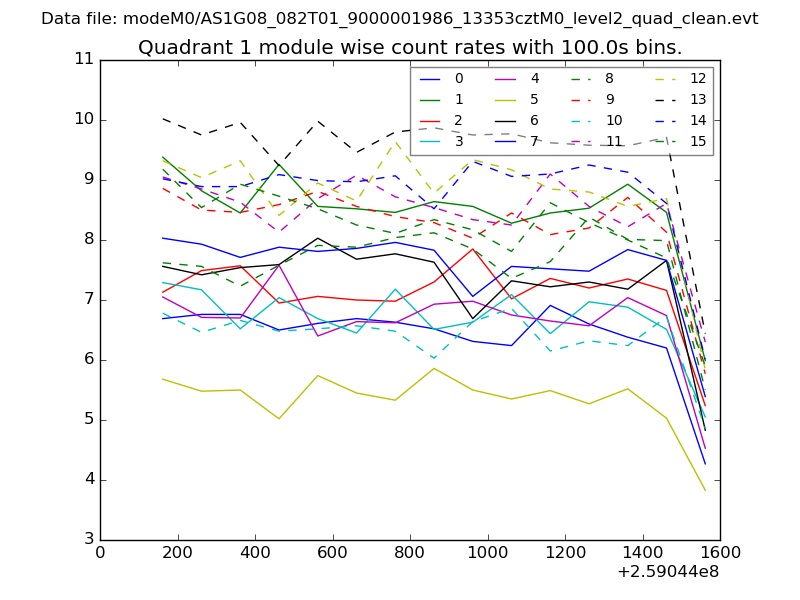
| Module-wise count rates for Quadrant A Data is divided into 100 sec bins |
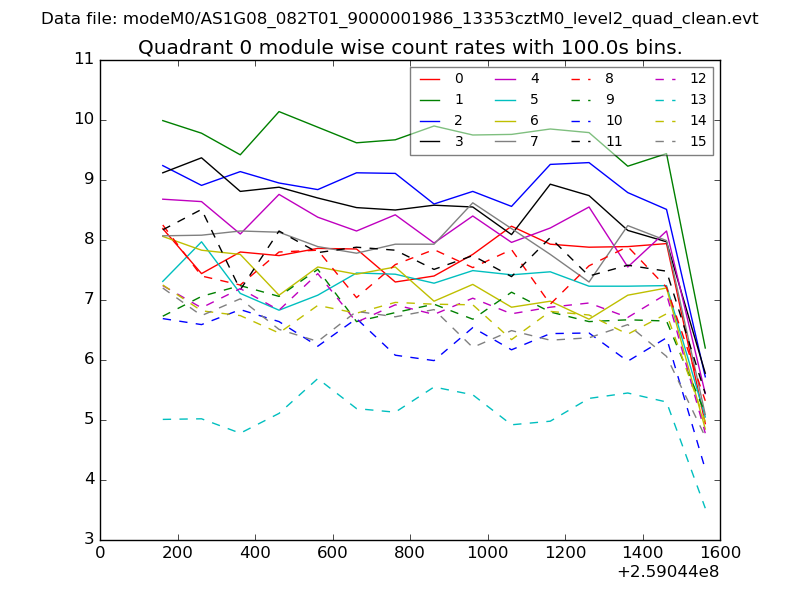 |
 |
| Module-wise count rates for Quadrant B Data is divided into 100 sec bins |
 |
 |
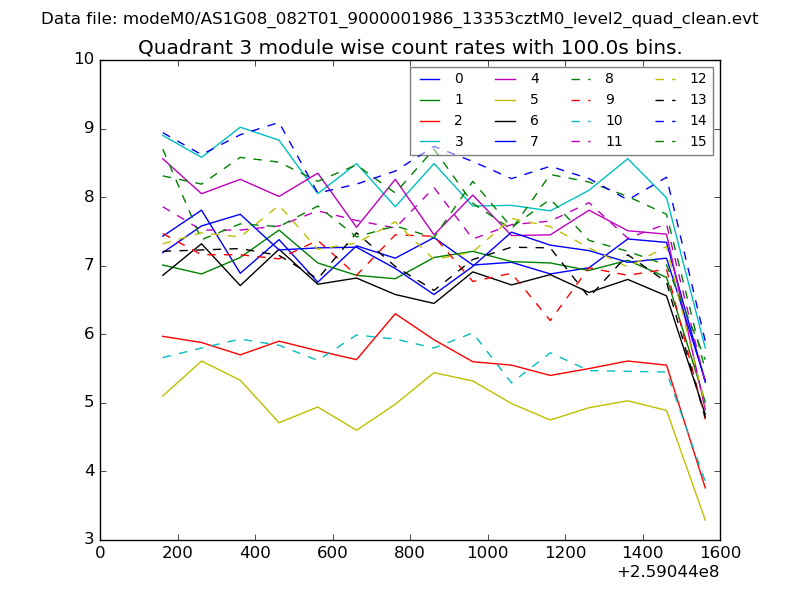
| Module-wise count rates for Quadrant C Data is divided into 100 sec bins |
 |
 |
| Module-wise count rates for Quadrant D Data is divided into 100 sec bins |
 |
 |
| Parameter | Plot |
|---|---|
| CZT HV Monitor | 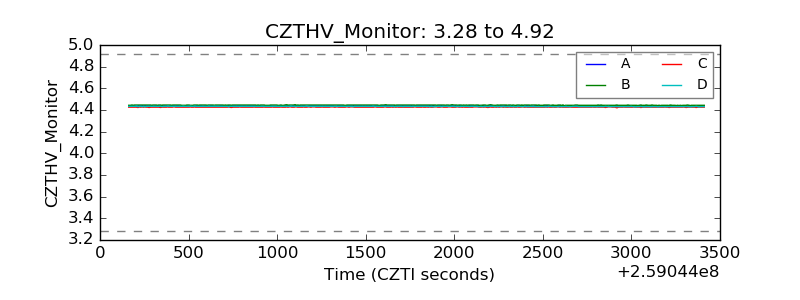 |
| D_VDD | 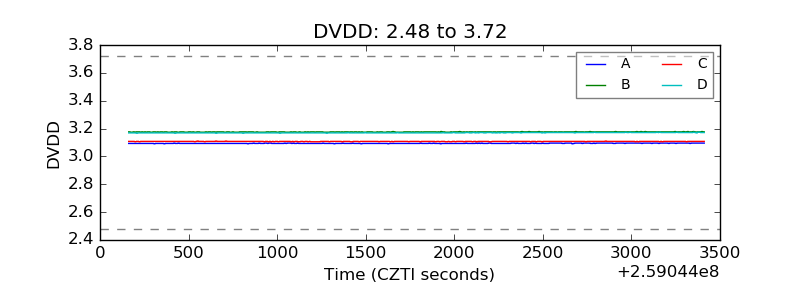 |
| Temperature 1 | 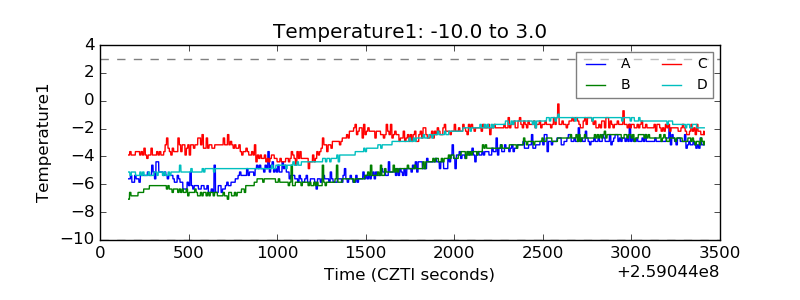 |
| Veto HV Monitor | 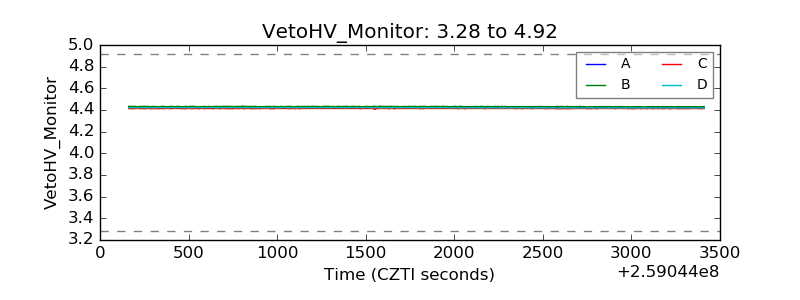 |
| Veto LLD | 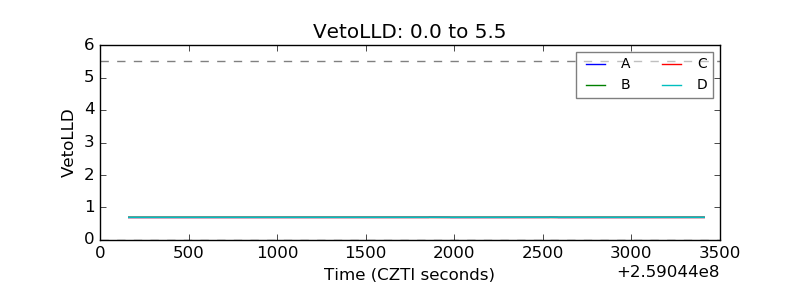 |
| Alpha Counter | 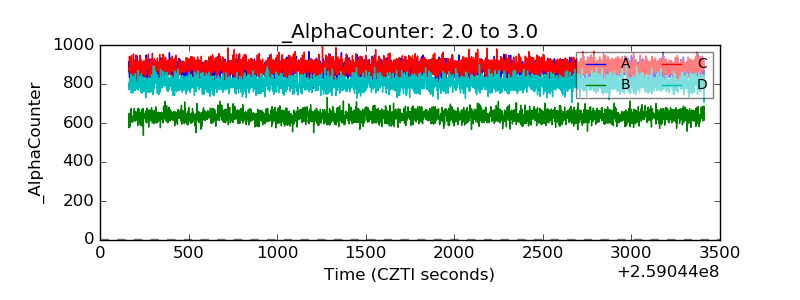 |
| _CPM_Rate | 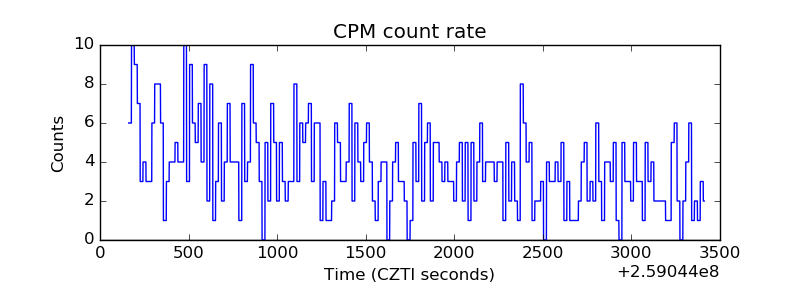 |
| CZT Counter | 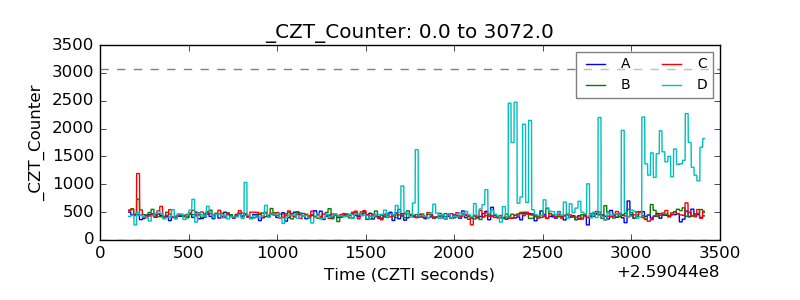 |
| +2.5 Volts monitor |  |
| +5 Volts monitor |  |
| _ROLL_ROT | 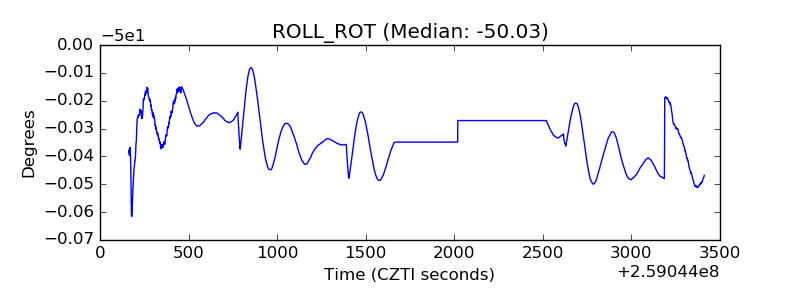 |
| _Roll_DEC | 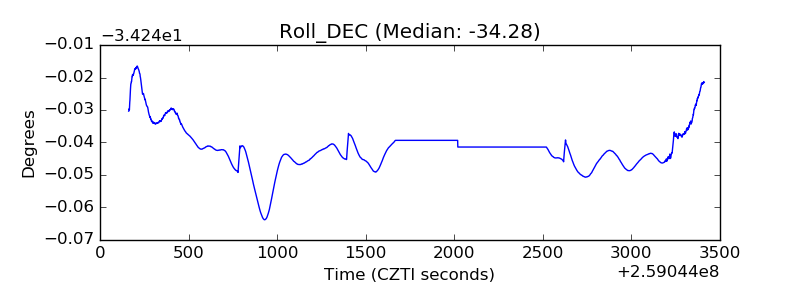 |
| _Roll_RA | 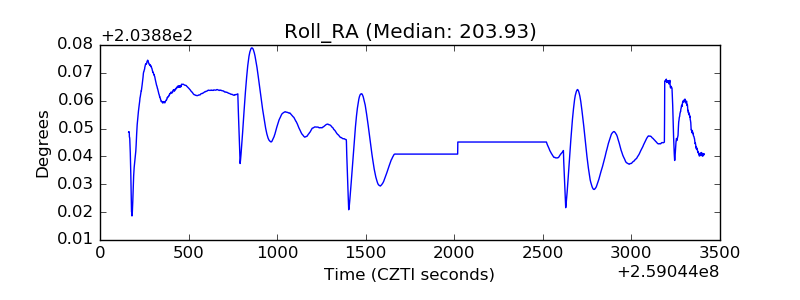 |
| Veto Counter | 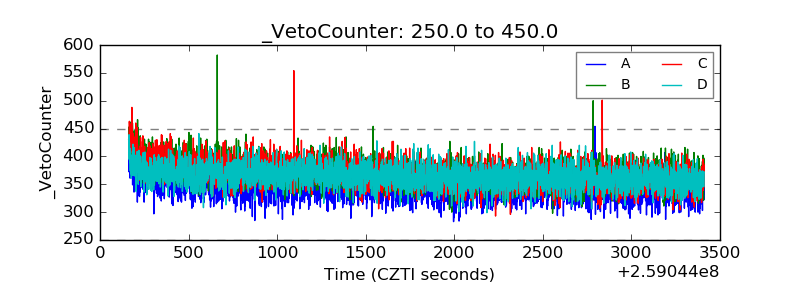 |