| Param | Original file | Final file |
|---|---|---|
| Filename | modeM0/AS1G08_082T01_9000001986_13354cztM0_level2.evt | modeM0/AS1G08_082T01_9000001986_13354cztM0_level2_quad_clean.evt |
| Size (bytes) | 953,593,920 | 177,096,960 |
| Size | 909.4 MB | 168.9 MB |
| Events in quadrant A | 6,597,078 | 1,100,274 |
| Events in quadrant B | 6,994,184 | 1,120,488 |
| Events in quadrant C | 6,740,590 | 1,100,343 |
| Events in quadrant D | 7,576,020 | 1,051,436 |
| Mode M9 | |||
|---|---|---|---|
| Quadrant | BADHDUFLAG | Total packets | Discarded packets |
| A | 0 | 20 | 0 |
| B | 0 | 19 | 0 |
| C | 0 | 19 | 0 |
| D | 0 | 19 | 0 |
| Mode M0 | |||
|---|---|---|---|
| Quadrant | BADHDUFLAG | Total packets | Discarded packets |
| A | 0 | 29310 | 2 |
| B | 0 | 30035 | 2 |
| C | 0 | 29749 | 2 |
| D | 0 | 32560 | 2 |
| Mode SS | |||
|---|---|---|---|
| Quadrant | BADHDUFLAG | Total packets | Discarded packets |
| A | 0 | 294 | 0 |
| B | 0 | 294 | 0 |
| C | 0 | 294 | 0 |
| D | 0 | 294 | 0 |
| Quadrant | Total seconds | Saturated seconds | Saturation percentage |
|---|---|---|---|
| A | 14349 | 166 | 1.156875% |
| B | 14349 | 209 | 1.456547% |
| C | 14349 | 168 | 1.170813% |
| D | 14349 | 277 | 1.930448% |
Noise dominated data is calculated using 1-second bins in cleaned event files. If a bin has >2000 counts, and if more than 50% of those come from <1% of pixels, then it is considered to be noise-dominated and hence unusable.
| Quadrant | # 1 sec bins | Bins with >0 counts | Bins with >2000 counts | High rate bins dominated by noise | Noise dominated (total time) | Noise dominated (detector-on time) | Marked lightcurve |
|---|---|---|---|---|---|---|---|
| A | 15581 | 14353 | 4 | 4 | 0.03% | 0.03% | 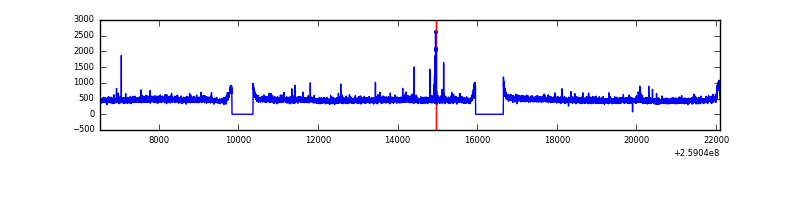 |
| B | 15581 | 14353 | 30 | 30 | 0.19% | 0.21% | 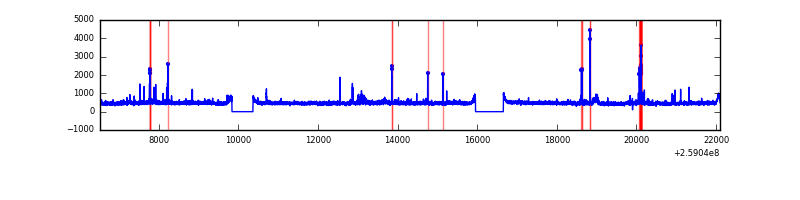 |
| C | 15581 | 14353 | 30 | 30 | 0.19% | 0.21% | 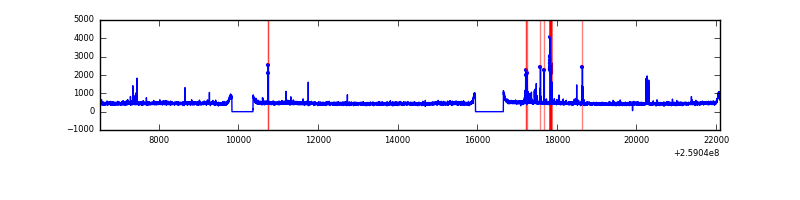 |
| D | 15581 | 14353 | 124 | 124 | 0.80% | 0.86% | 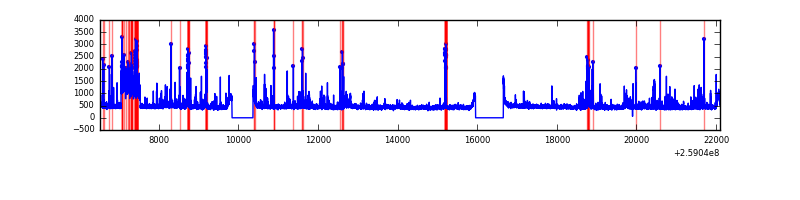 |
Top three noisy pixels from each quadrant. If the there are fewer than three noisy pixels in the level2.evt file, extra rows are filled as -1
| Pixel properties | Quadrant properties | ||||||
|---|---|---|---|---|---|---|---|
| Quadrant | DetID | PixID | Counts | Sigma | Mean | Median | Sigma |
| A | 9 | 143 | 39634 | 110.75 | 1679 | 1640 | 343.1 |
| A | 1 | 162 | 33069 | 91.62 | 1679 | 1640 | 343.1 |
| A | 5 | 98 | 23139 | 62.67 | 1679 | 1640 | 343.1 |
| B | 0 | 230 | 145741 | 448.4 | 1684 | 1636 | 321.4 |
| B | 3 | 64 | 100670 | 308.16 | 1684 | 1636 | 321.4 |
| B | 4 | 142 | 77062 | 234.7 | 1684 | 1636 | 321.4 |
| C | 14 | 220 | 192285 | 498.36 | 1642 | 1647 | 382.5 |
| C | 3 | 233 | 130624 | 337.17 | 1642 | 1647 | 382.5 |
| C | 15 | 208 | 13592 | 31.23 | 1642 | 1647 | 382.5 |
| D | 5 | 222 | 662007 | 1675.86 | 1624 | 1575 | 394.1 |
| D | 13 | 249 | 305762 | 771.88 | 1624 | 1575 | 394.1 |
| D | 1 | 52 | 215529 | 542.91 | 1624 | 1575 | 394.1 |
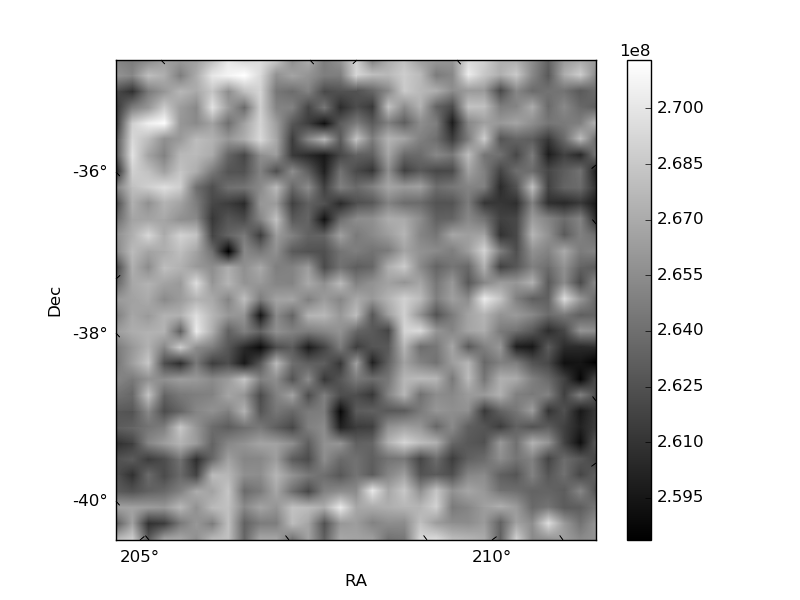
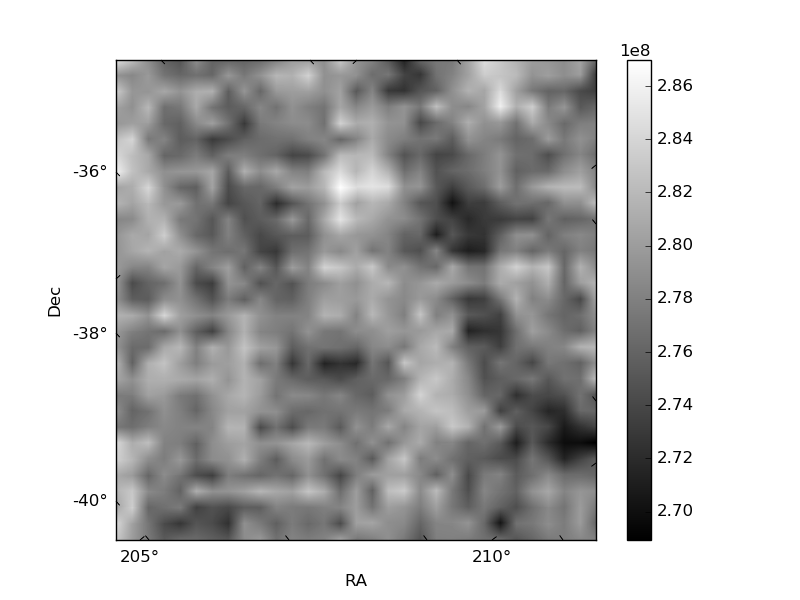
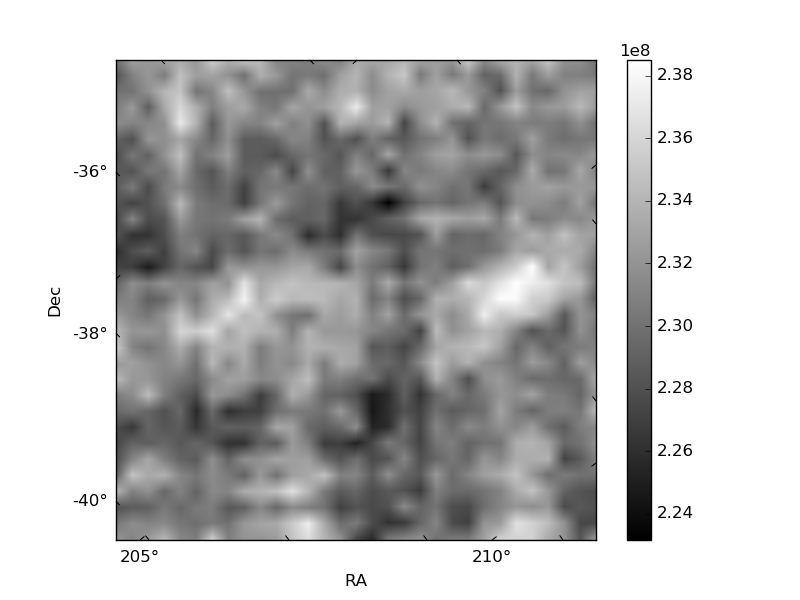
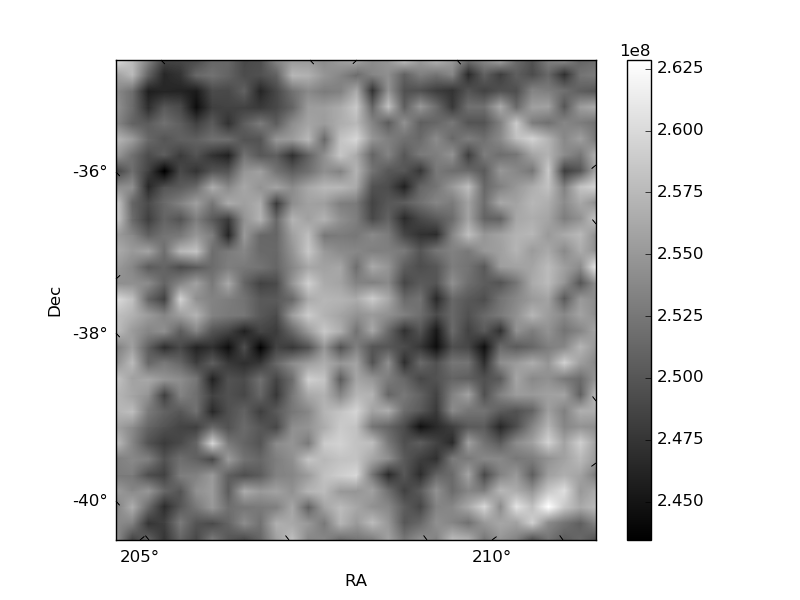
Histogram calculated using DETX and DETY for each event in the final _common_clean file
| Quadrant A | 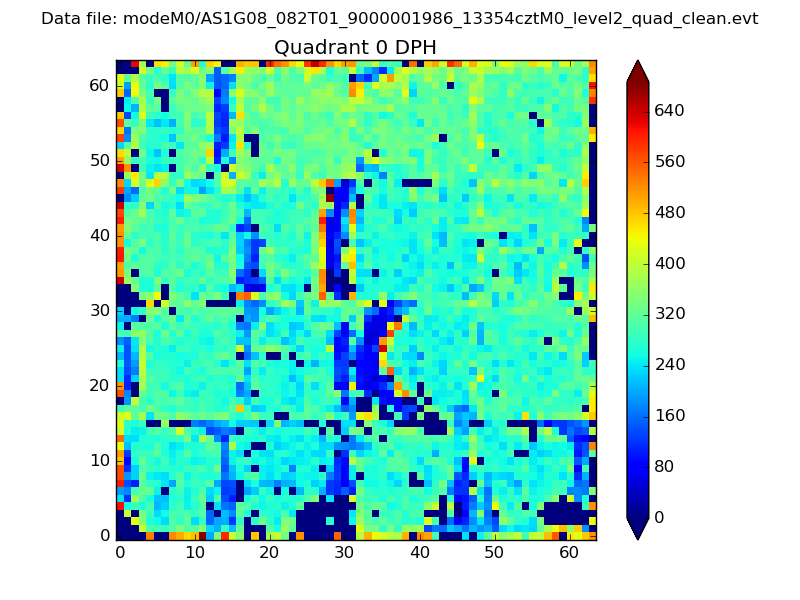 |
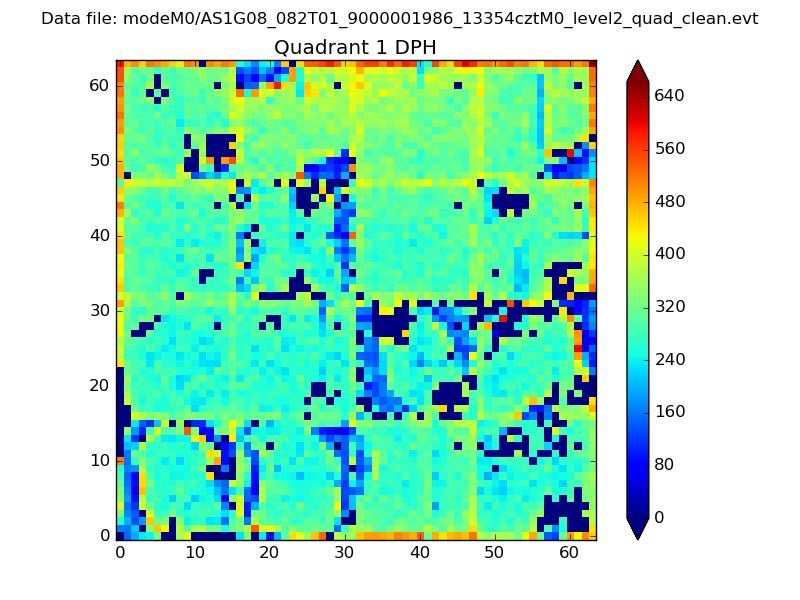 |
Quadrant B |
|---|---|---|---|
| Quadrant D |  |
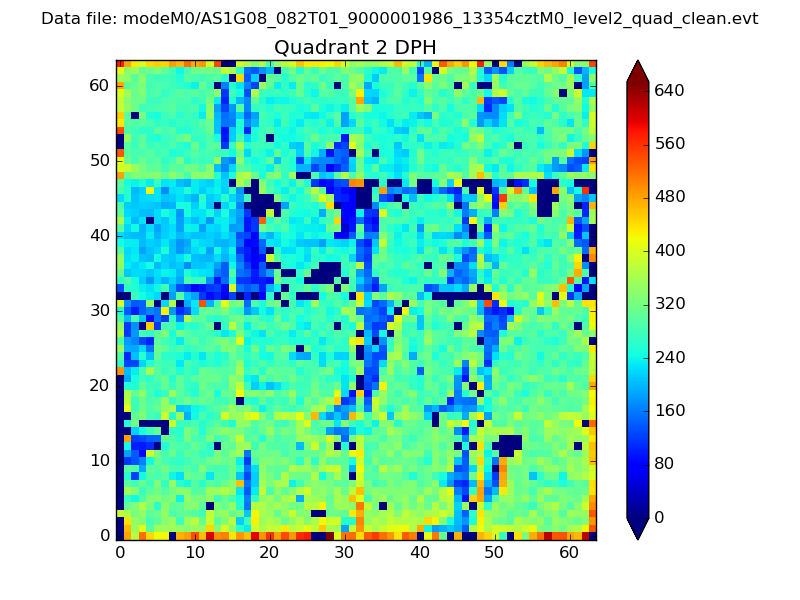 |
Quadrant C |
| Plot type | Count rate plots | Images |
|---|---|---|
| Comparison with Poisson distribution Blue bars denote a histogram of data divided into 1 sec bins. Red curve is a Poisson curve with rate = median count rate of data. |
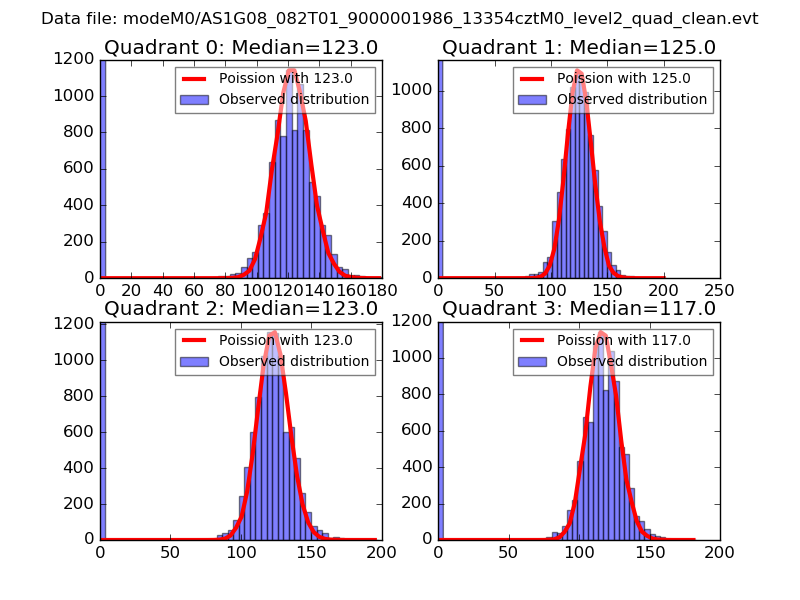 |
 |
| Quadrant-wise count rates Data is divided into 100 sec bins |
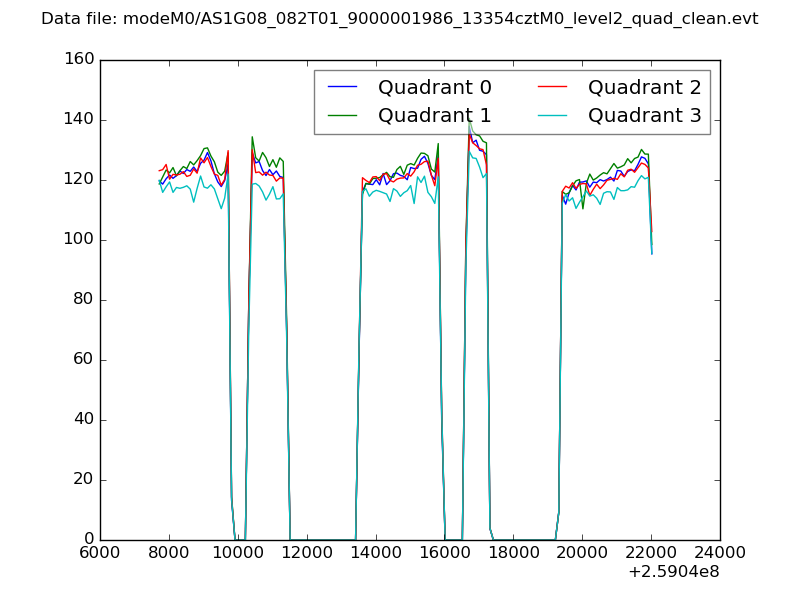 |
|
| Module-wise count rates for Quadrant A Data is divided into 100 sec bins |
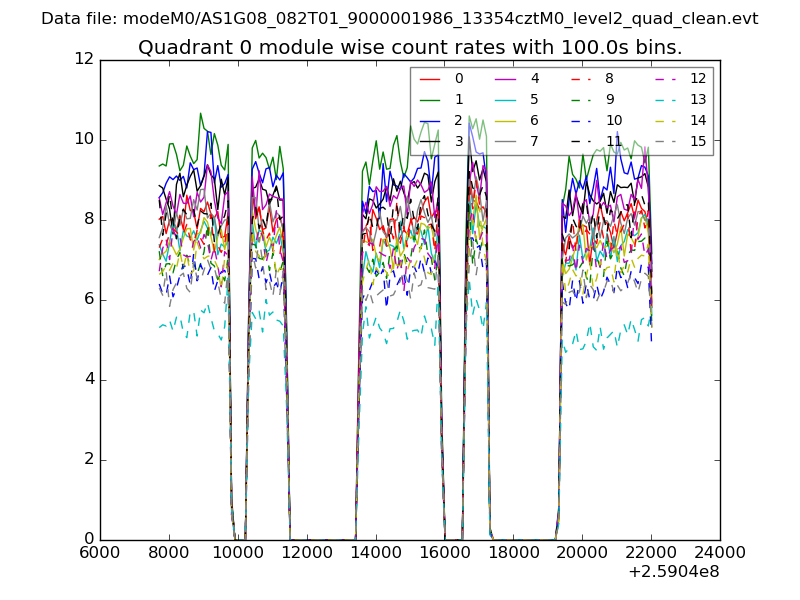 |
 |
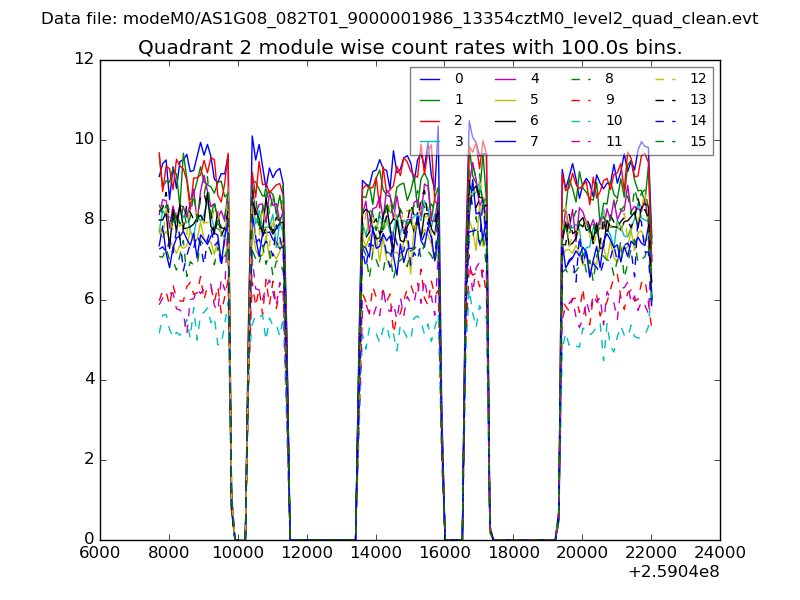
| Module-wise count rates for Quadrant B Data is divided into 100 sec bins |
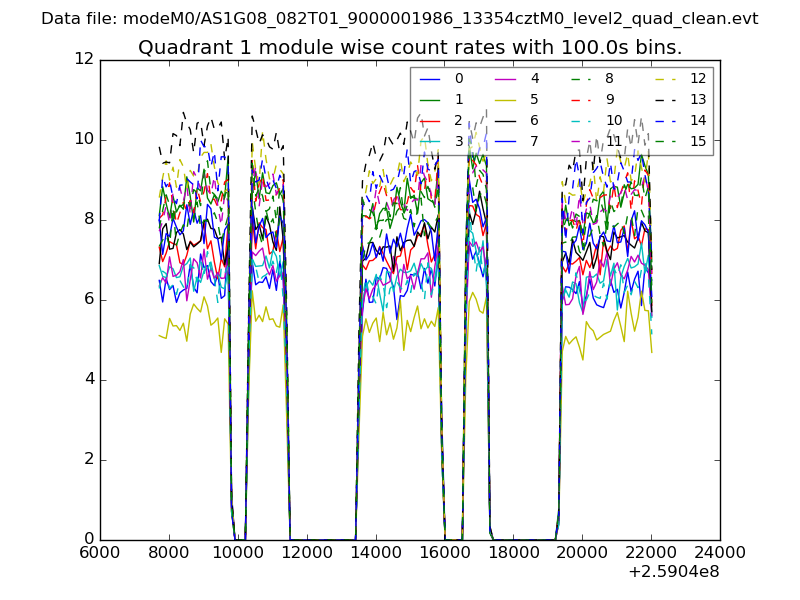 |
 |
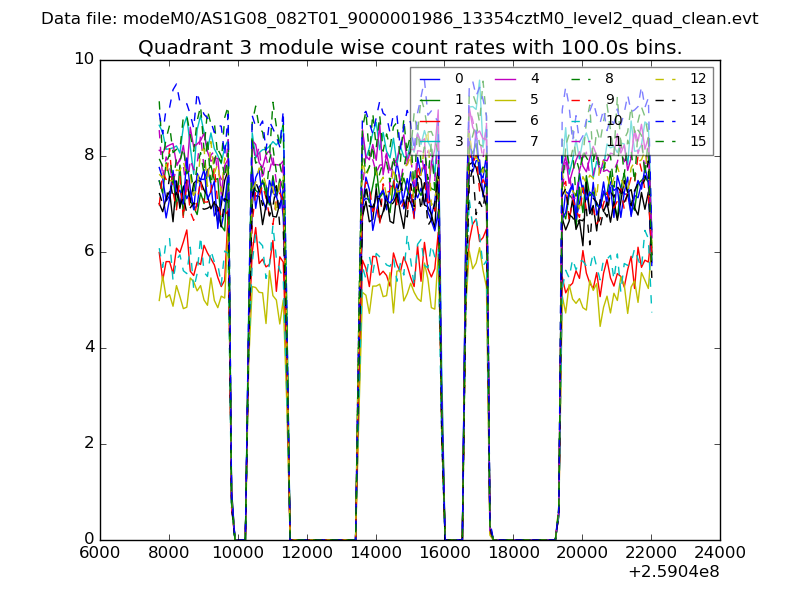
| Module-wise count rates for Quadrant C Data is divided into 100 sec bins |
 |
 |
| Module-wise count rates for Quadrant D Data is divided into 100 sec bins |
 |
 |
| Parameter | Plot |
|---|---|
| CZT HV Monitor | 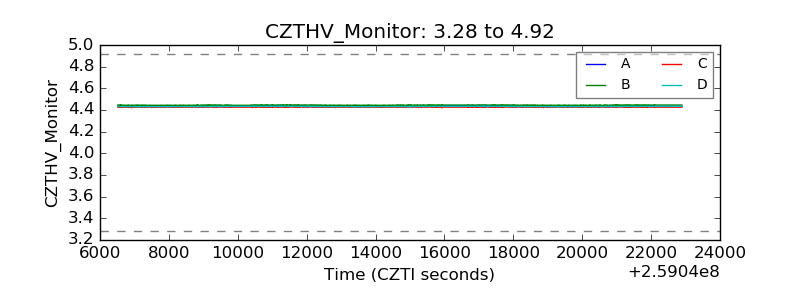 |
| D_VDD |  |
| Temperature 1 | 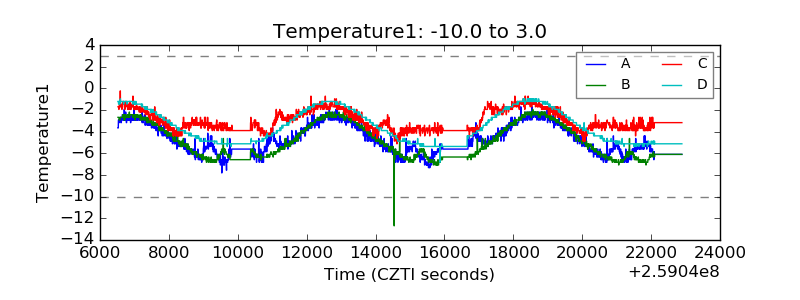 |
| Veto HV Monitor |  |
| Veto LLD |  |
| Alpha Counter | 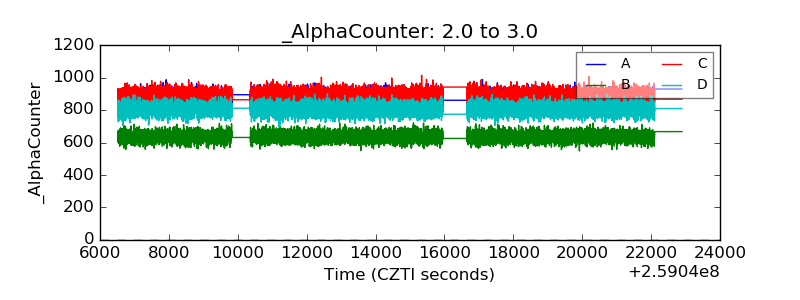 |
| _CPM_Rate | 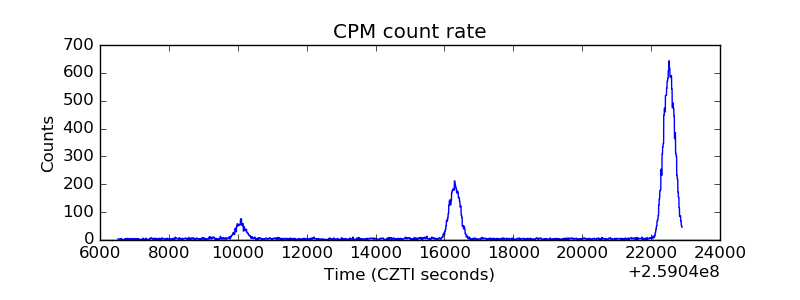 |
| CZT Counter |  |
| +2.5 Volts monitor |  |
| +5 Volts monitor | 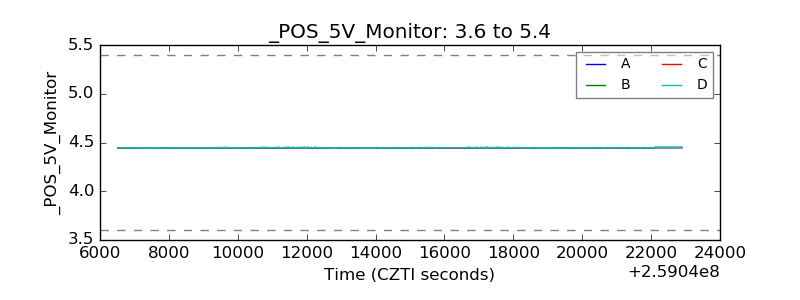 |
| _ROLL_ROT | 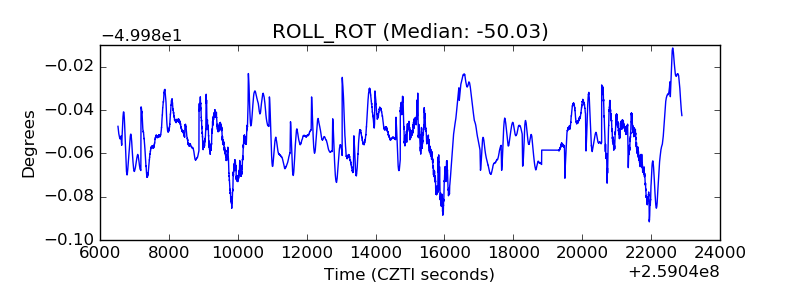 |
| _Roll_DEC | 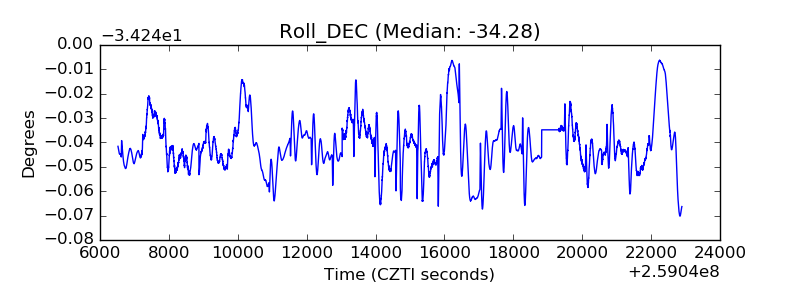 |
| _Roll_RA |  |
| Veto Counter | 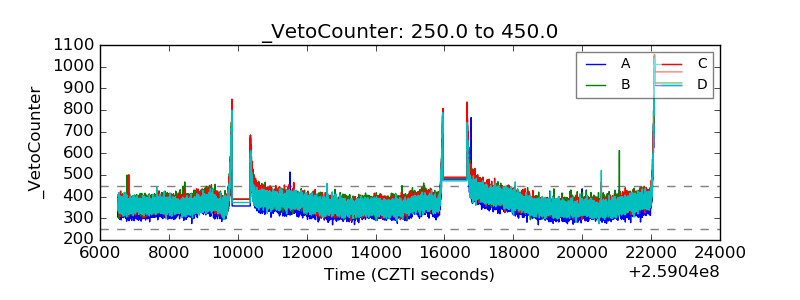 |