| Param | Original file | Final file |
|---|---|---|
| Filename | modeM0/AS1G08_082T01_9000001986_13357cztM0_level2.evt | modeM0/AS1G08_082T01_9000001986_13357cztM0_level2_quad_clean.evt |
| Size (bytes) | 529,297,920 | 74,473,920 |
| Size | 504.8 MB | 71.0 MB |
| Events in quadrant A | 3,409,453 | 451,134 |
| Events in quadrant B | 3,603,358 | 460,201 |
| Events in quadrant C | 3,446,916 | 449,844 |
| Events in quadrant D | 5,108,837 | 419,515 |
| Mode M9 | |||
|---|---|---|---|
| Quadrant | BADHDUFLAG | Total packets | Discarded packets |
| A | 0 | 17 | 0 |
| B | 0 | 17 | 0 |
| C | 0 | 17 | 0 |
| D | 0 | 18 | 0 |
| Mode M0 | |||
|---|---|---|---|
| Quadrant | BADHDUFLAG | Total packets | Discarded packets |
| A | 0 | 14629 | 3 |
| B | 0 | 15119 | 2 |
| C | 0 | 14748 | 2 |
| D | 0 | 19815 | 2 |
| Mode SS | |||
|---|---|---|---|
| Quadrant | BADHDUFLAG | Total packets | Discarded packets |
| A | 0 | 140 | 0 |
| B | 0 | 140 | 0 |
| C | 0 | 140 | 0 |
| D | 0 | 140 | 0 |
| Quadrant | Total seconds | Saturated seconds | Saturation percentage |
|---|---|---|---|
| A | 6798 | 90 | 1.323919% |
| B | 6798 | 107 | 1.573992% |
| C | 6798 | 81 | 1.191527% |
| D | 6798 | 261 | 3.839365% |
Noise dominated data is calculated using 1-second bins in cleaned event files. If a bin has >2000 counts, and if more than 50% of those come from <1% of pixels, then it is considered to be noise-dominated and hence unusable.
| Quadrant | # 1 sec bins | Bins with >0 counts | Bins with >2000 counts | High rate bins dominated by noise | Noise dominated (total time) | Noise dominated (detector-on time) | Marked lightcurve |
|---|---|---|---|---|---|---|---|
| A | 7934 | 6800 | 1 | 1 | 0.01% | 0.01% | 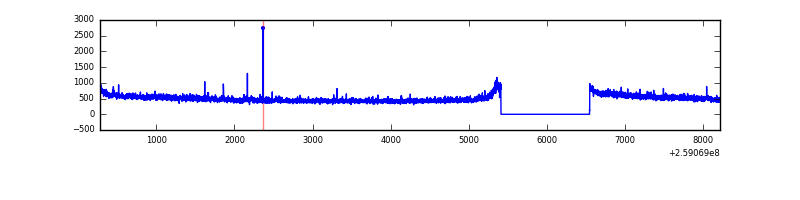 |
| B | 7934 | 6800 | 10 | 10 | 0.13% | 0.15% | 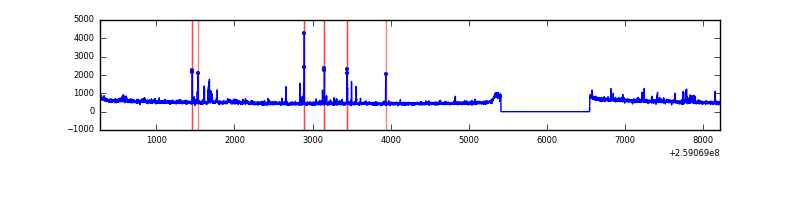 |
| C | 7934 | 6800 | 1 | 1 | 0.01% | 0.01% | 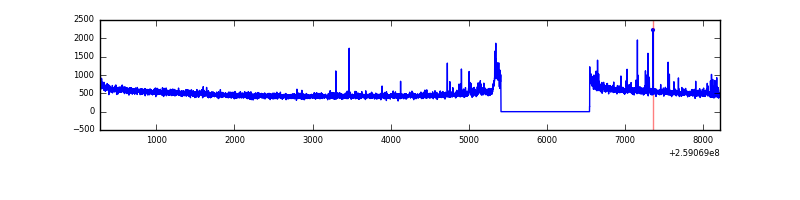 |
| D | 7934 | 6800 | 203 | 203 | 2.56% | 2.99% | 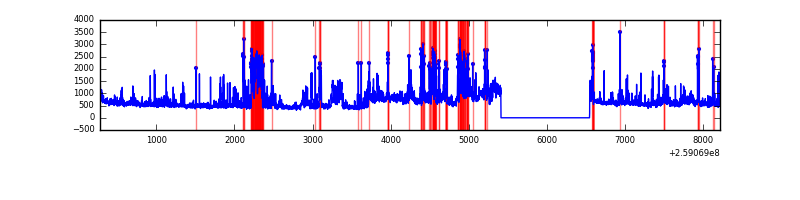 |
Top three noisy pixels from each quadrant. If the there are fewer than three noisy pixels in the level2.evt file, extra rows are filled as -1
| Pixel properties | Quadrant properties | ||||||
|---|---|---|---|---|---|---|---|
| Quadrant | DetID | PixID | Counts | Sigma | Mean | Median | Sigma |
| A | 1 | 162 | 17496 | 94.44 | 871 | 852 | 176.2 |
| A | 8 | 15 | 13896 | 74.01 | 871 | 852 | 176.2 |
| A | 9 | 143 | 11154 | 58.45 | 871 | 852 | 176.2 |
| B | 3 | 64 | 73572 | 443.98 | 872 | 852 | 163.8 |
| B | 0 | 230 | 55282 | 332.31 | 872 | 852 | 163.8 |
| B | 4 | 142 | 20962 | 122.78 | 872 | 852 | 163.8 |
| C | 14 | 220 | 84254 | 432.88 | 842 | 849 | 192.7 |
| C | 3 | 233 | 76212 | 391.14 | 842 | 849 | 192.7 |
| C | 13 | 61 | 6147 | 27.5 | 842 | 849 | 192.7 |
| D | 1 | 52 | 982404 | 4928.48 | 830 | 804 | 199.2 |
| D | 13 | 249 | 487641 | 2444.34 | 830 | 804 | 199.2 |
| D | 8 | 195 | 189786 | 948.85 | 830 | 804 | 199.2 |
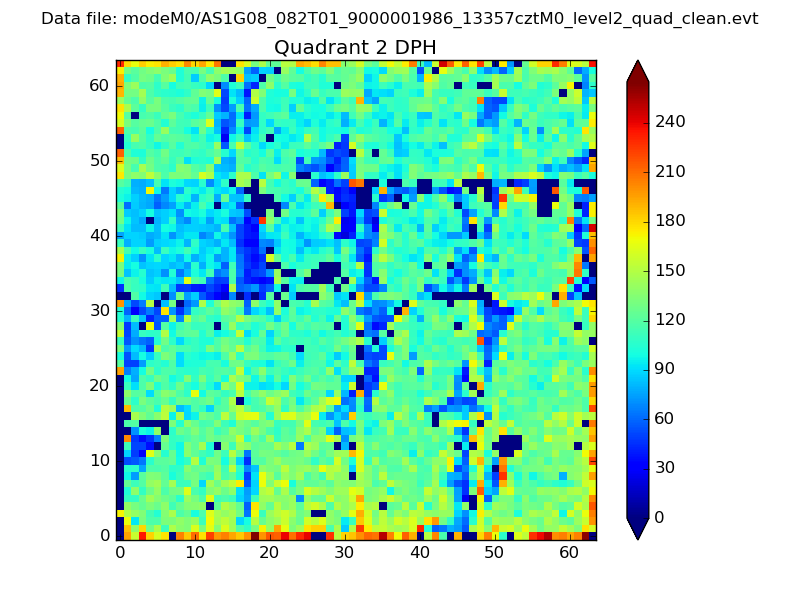
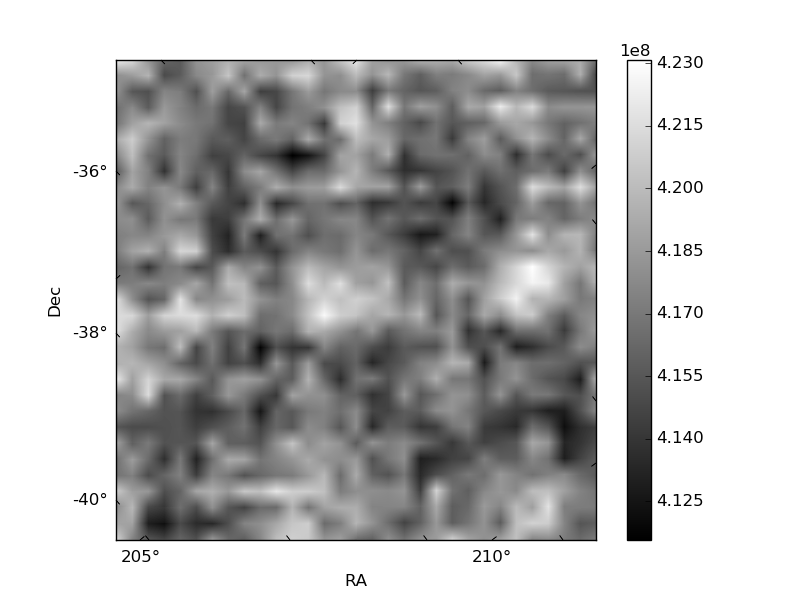
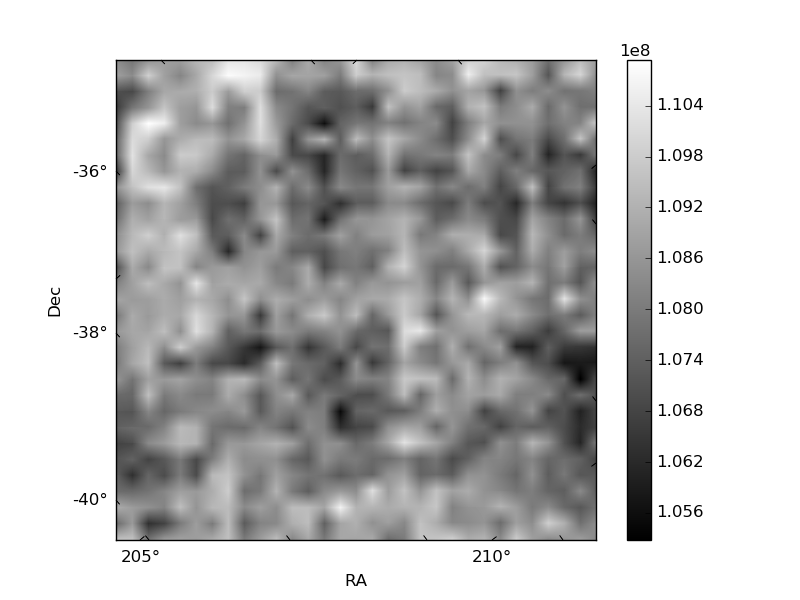
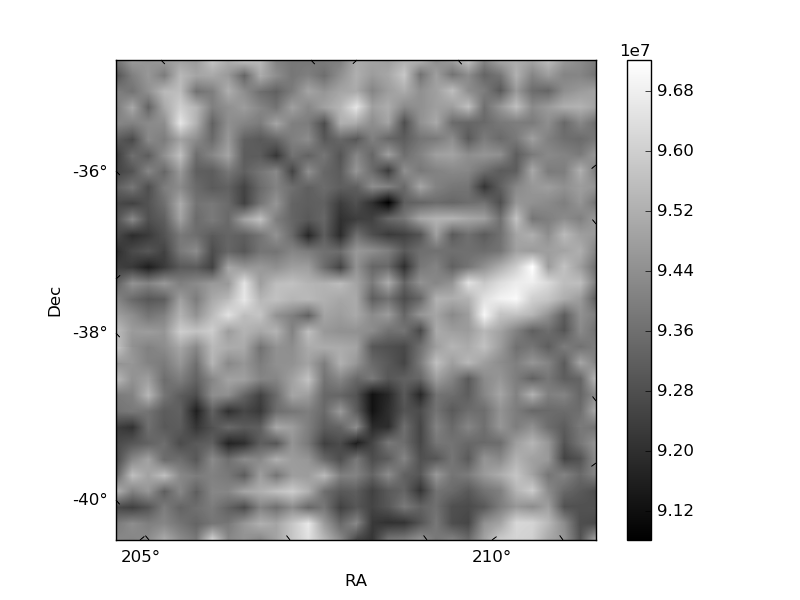
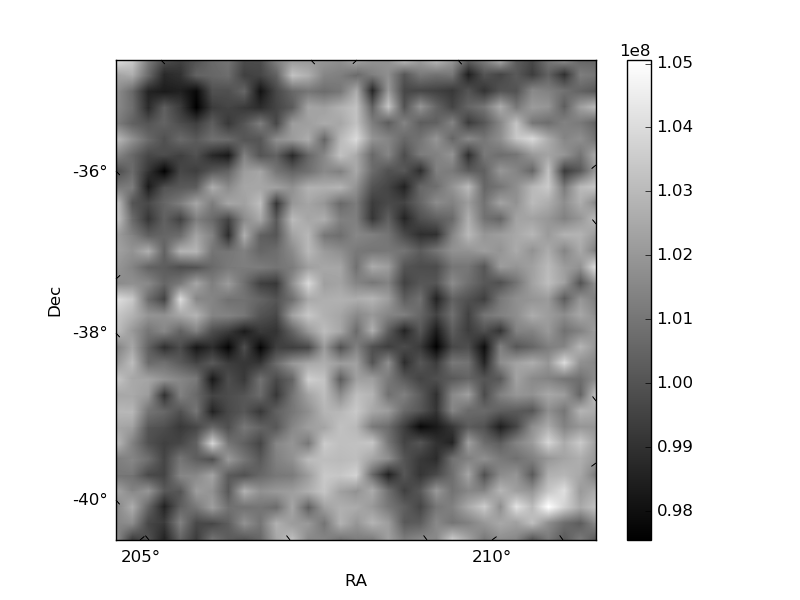
Histogram calculated using DETX and DETY for each event in the final _common_clean file
| Quadrant A | 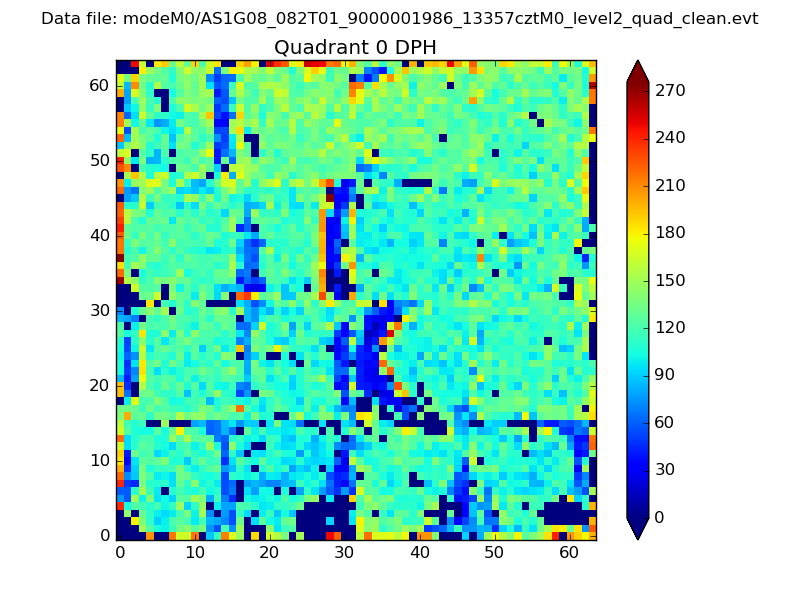 |
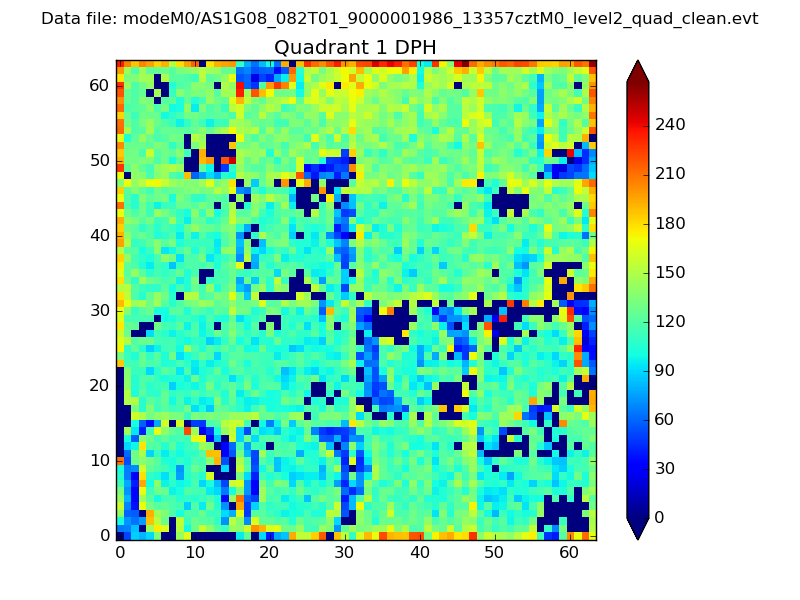 |
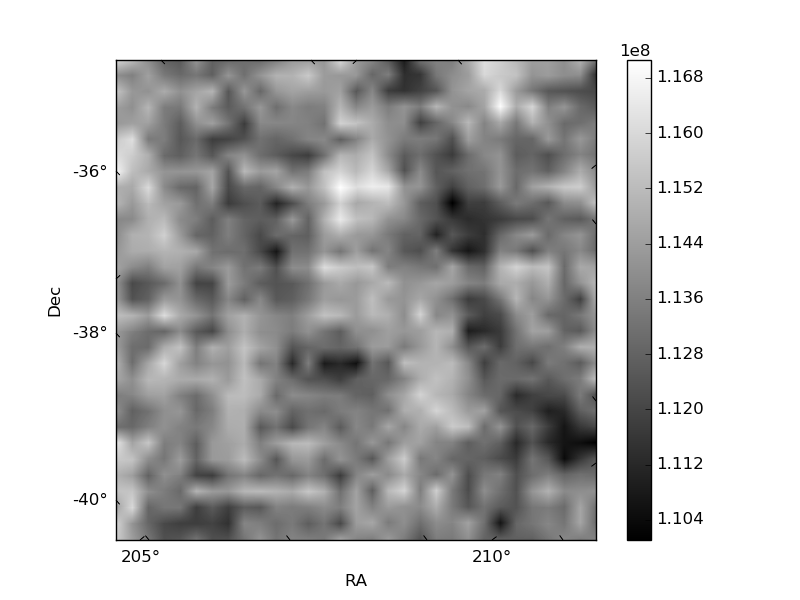
Quadrant B |
|---|---|---|---|
| Quadrant D | 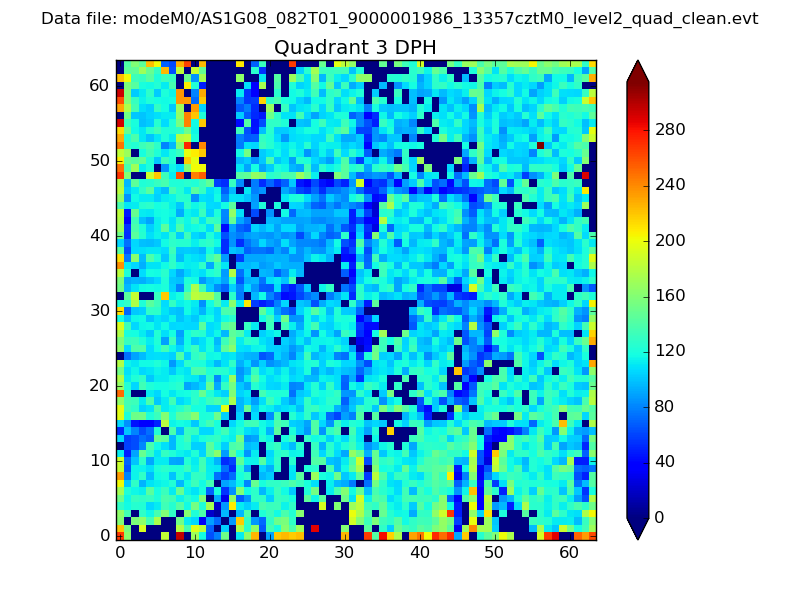 |
 |
Quadrant C |
| Plot type | Count rate plots | Images |
|---|---|---|
| Comparison with Poisson distribution Blue bars denote a histogram of data divided into 1 sec bins. Red curve is a Poisson curve with rate = median count rate of data. |
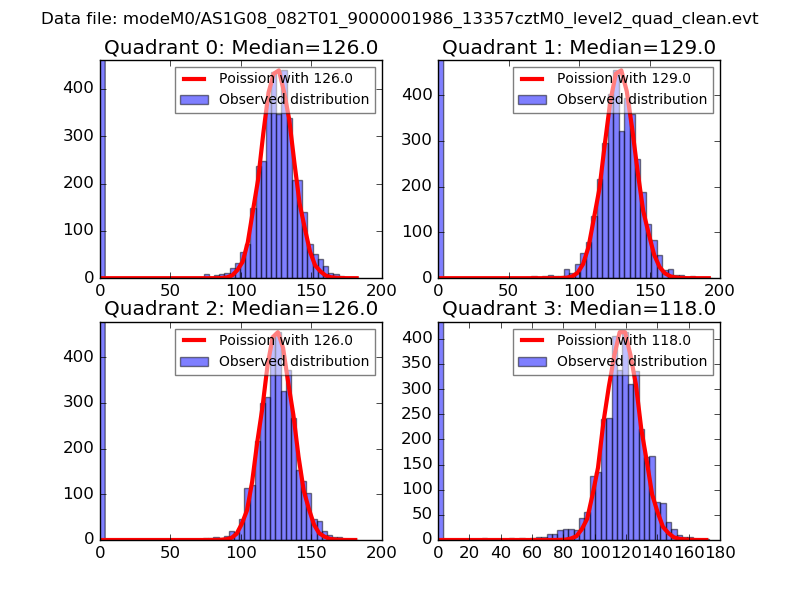 |
 |
| Quadrant-wise count rates Data is divided into 100 sec bins |
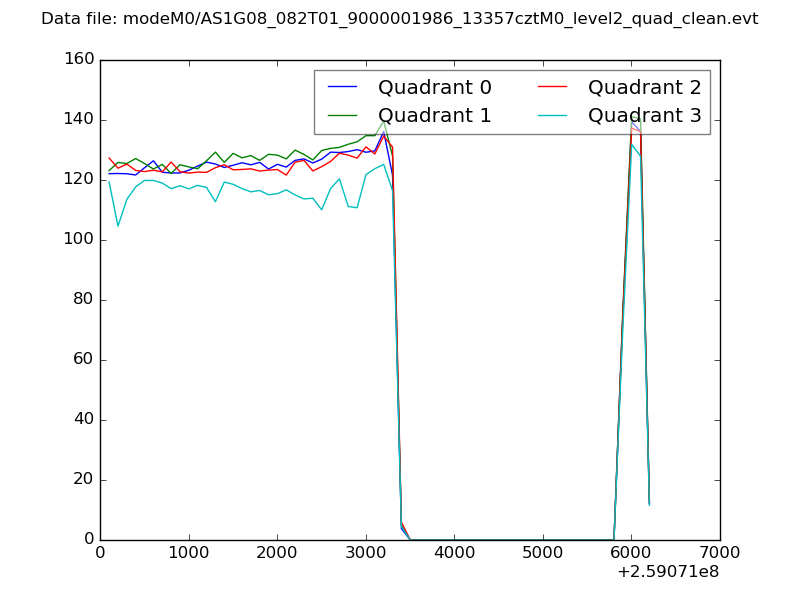 |
|
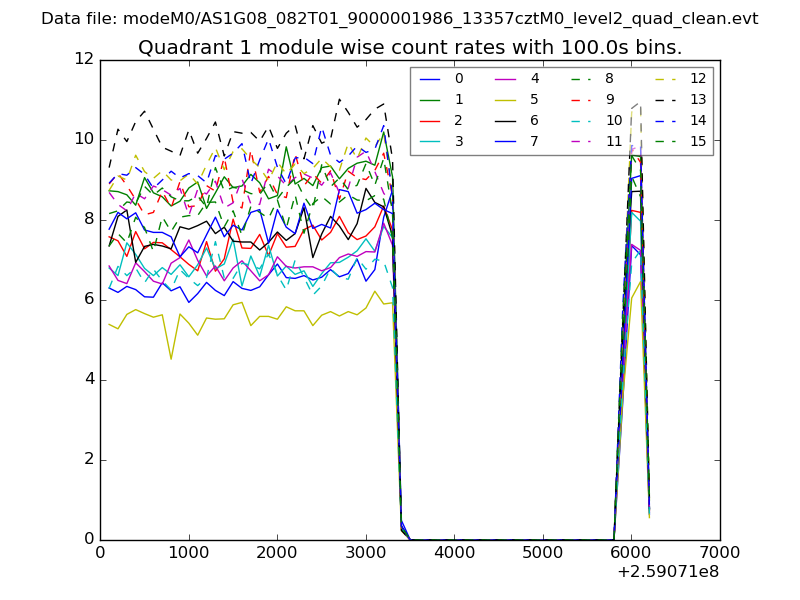
| Module-wise count rates for Quadrant A Data is divided into 100 sec bins |
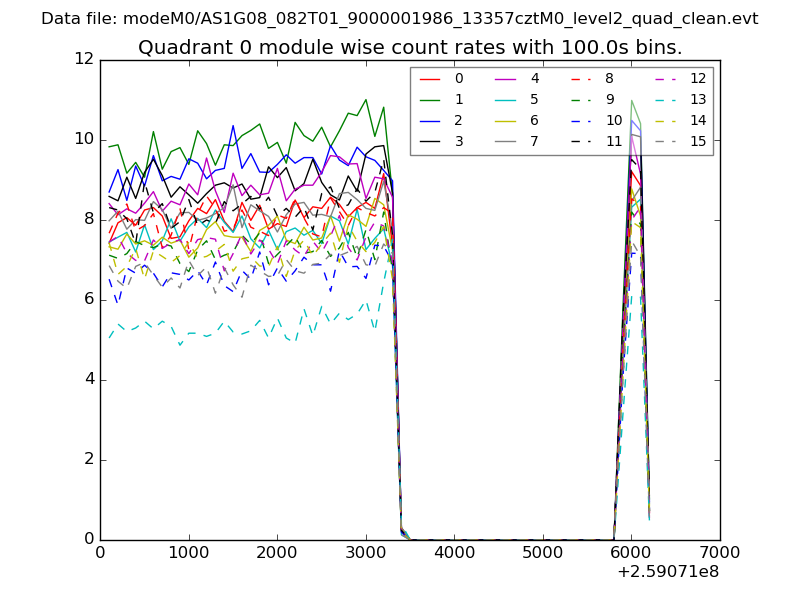 |
 |
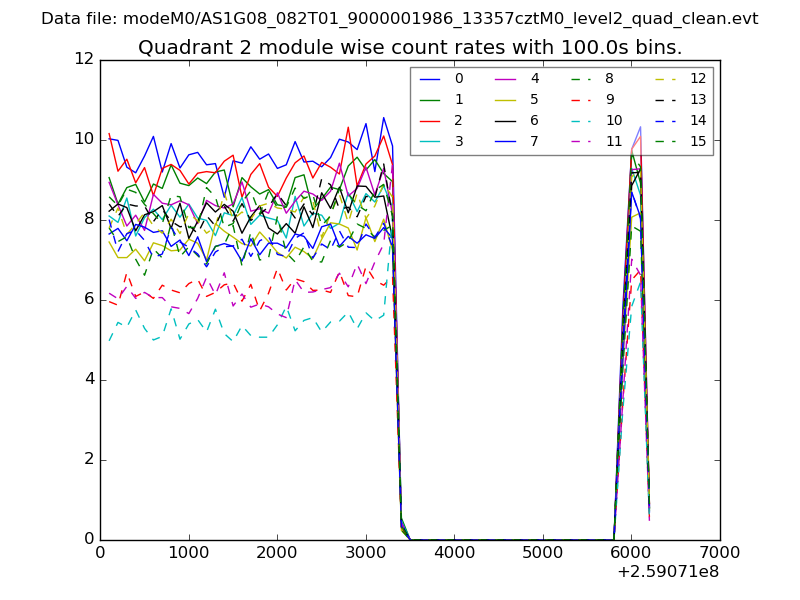
| Module-wise count rates for Quadrant B Data is divided into 100 sec bins |
 |
 |
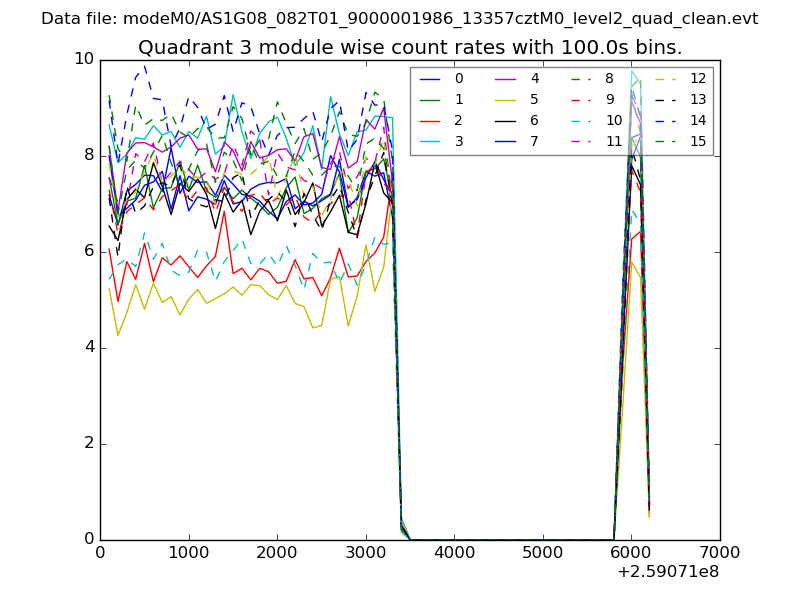
| Module-wise count rates for Quadrant C Data is divided into 100 sec bins |
 |
 |
| Module-wise count rates for Quadrant D Data is divided into 100 sec bins |
 |
 |
| Parameter | Plot |
|---|---|
| CZT HV Monitor | 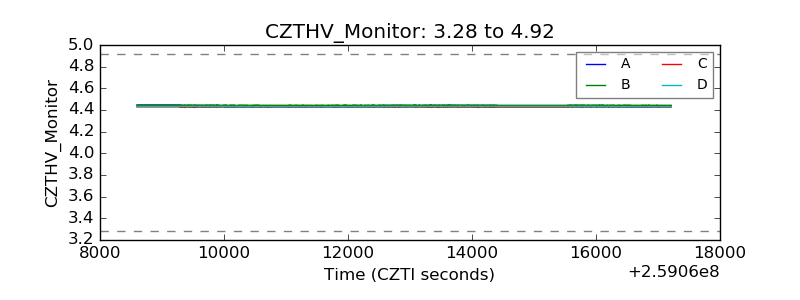 |
| D_VDD | 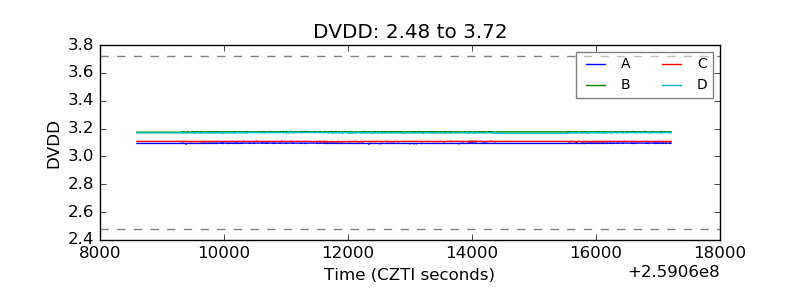 |
| Temperature 1 | 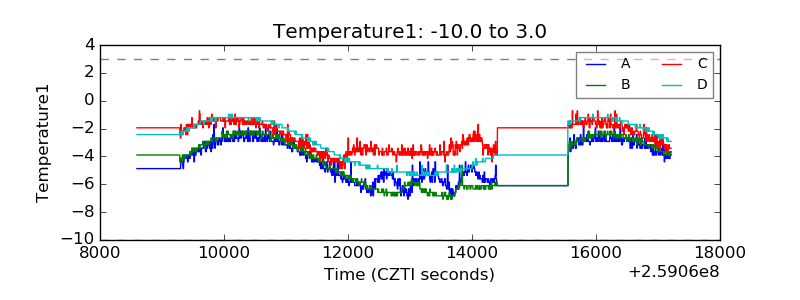 |
| Veto HV Monitor | 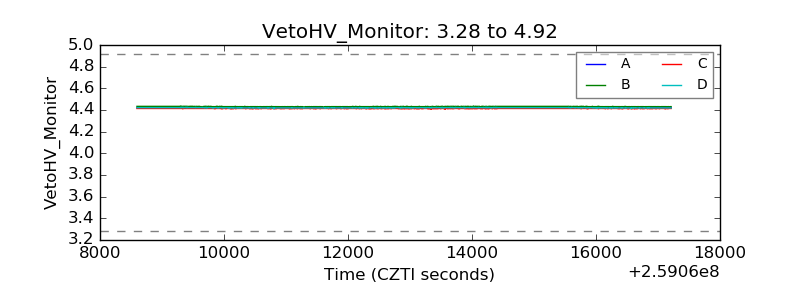 |
| Veto LLD | 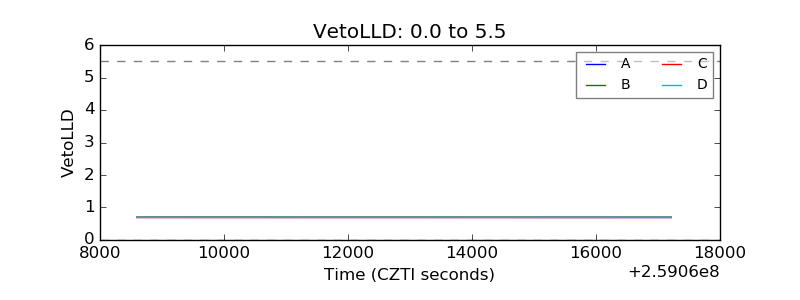 |
| Alpha Counter | 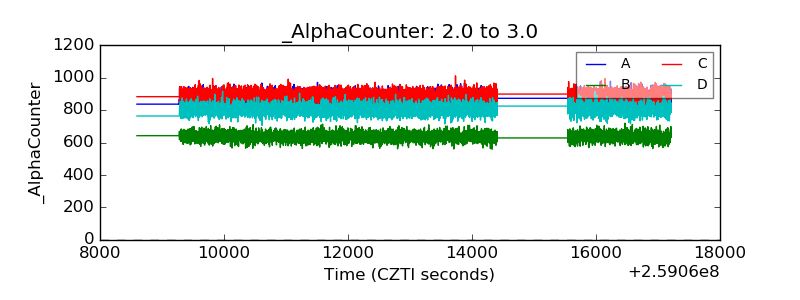 |
| _CPM_Rate | 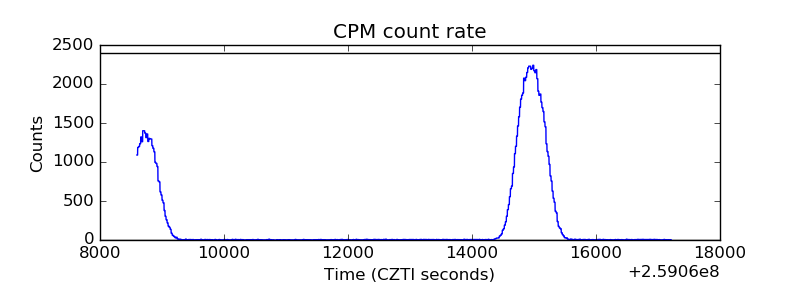 |
| CZT Counter | 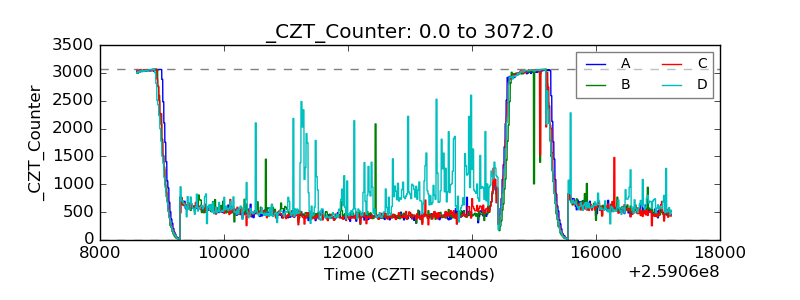 |
| +2.5 Volts monitor | 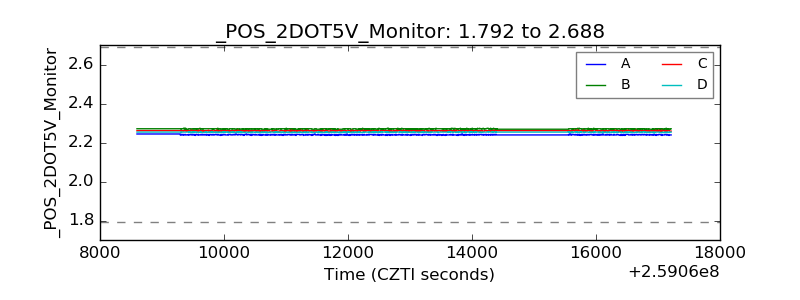 |
| +5 Volts monitor | 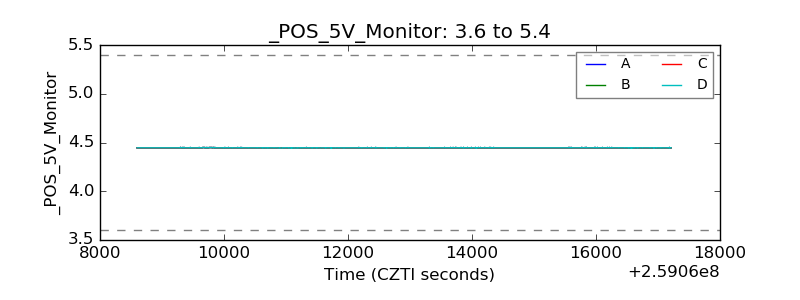 |
| _ROLL_ROT | 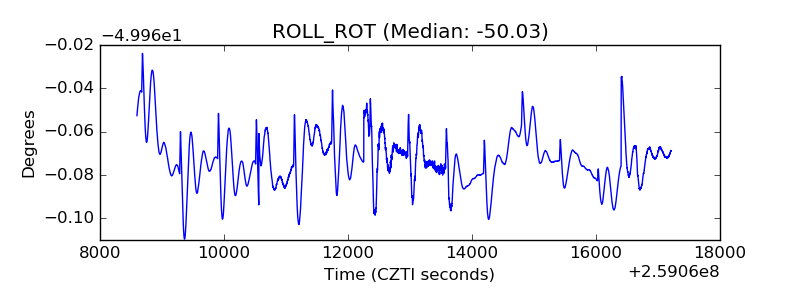 |
| _Roll_DEC | 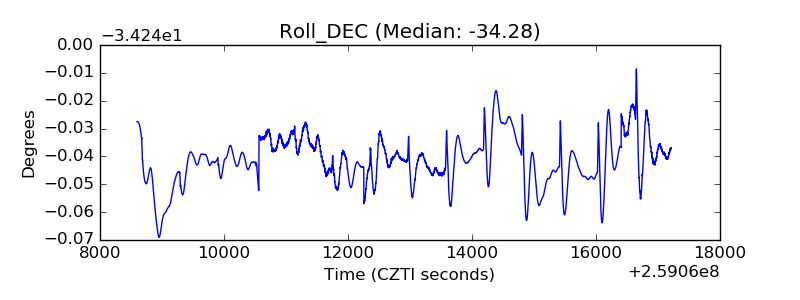 |
| _Roll_RA | 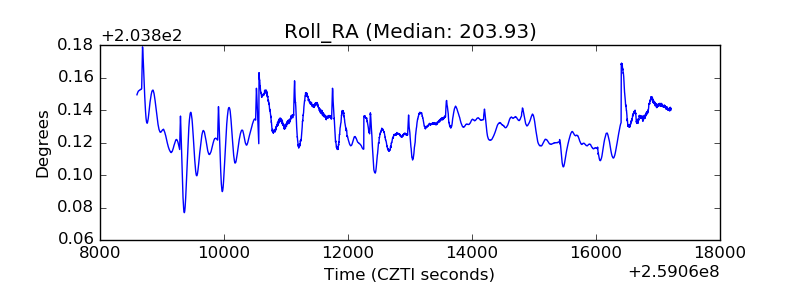 |
| Veto Counter | 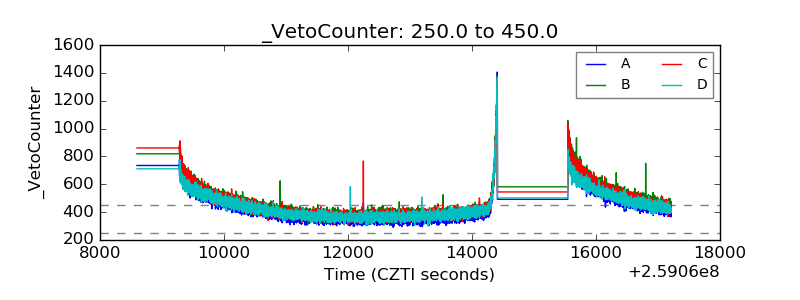 |