| Param | Original file | Final file |
|---|---|---|
| Filename | modeM0/AS1G08_082T01_9000001986_13358cztM0_level2.evt | modeM0/AS1G08_082T01_9000001986_13358cztM0_level2_quad_clean.evt |
| Size (bytes) | 467,236,800 | 87,782,400 |
| Size | 445.6 MB | 83.7 MB |
| Events in quadrant A | 3,201,742 | 566,019 |
| Events in quadrant B | 3,335,958 | 575,420 |
| Events in quadrant C | 3,349,219 | 554,587 |
| Events in quadrant D | 3,839,773 | 526,739 |
| Mode M9 | |||
|---|---|---|---|
| Quadrant | BADHDUFLAG | Total packets | Discarded packets |
| A | 0 | 13 | 0 |
| B | 0 | 13 | 0 |
| C | 0 | 13 | 0 |
| D | 0 | 13 | 0 |
| Mode M0 | |||
|---|---|---|---|
| Quadrant | BADHDUFLAG | Total packets | Discarded packets |
| A | 0 | 13654 | 2 |
| B | 0 | 13984 | 1 |
| C | 0 | 13914 | 1 |
| D | 0 | 15621 | 1 |
| Mode SS | |||
|---|---|---|---|
| Quadrant | BADHDUFLAG | Total packets | Discarded packets |
| A | 0 | 126 | 0 |
| B | 0 | 126 | 0 |
| C | 0 | 126 | 0 |
| D | 0 | 126 | 0 |
| Quadrant | Total seconds | Saturated seconds | Saturation percentage |
|---|---|---|---|
| A | 6244 | 67 | 1.073030% |
| B | 6244 | 95 | 1.521461% |
| C | 6244 | 56 | 0.896861% |
| D | 6244 | 118 | 1.889814% |
Noise dominated data is calculated using 1-second bins in cleaned event files. If a bin has >2000 counts, and if more than 50% of those come from <1% of pixels, then it is considered to be noise-dominated and hence unusable.
| Quadrant | # 1 sec bins | Bins with >0 counts | Bins with >2000 counts | High rate bins dominated by noise | Noise dominated (total time) | Noise dominated (detector-on time) | Marked lightcurve |
|---|---|---|---|---|---|---|---|
| A | 7495 | 6246 | 0 | 0 | 0.00% | 0.00% | 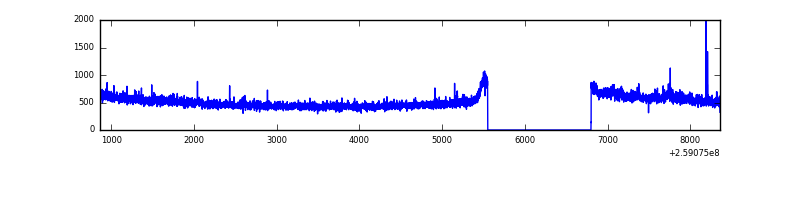 |
| B | 7495 | 6246 | 12 | 12 | 0.16% | 0.19% | 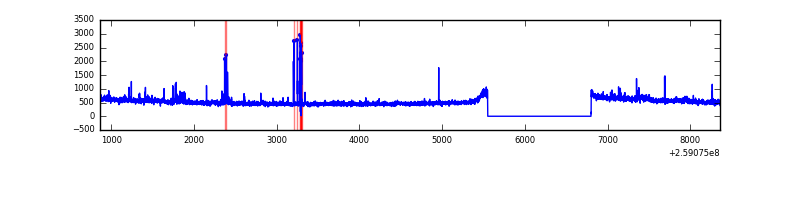 |
| C | 7495 | 6246 | 3 | 3 | 0.04% | 0.05% | 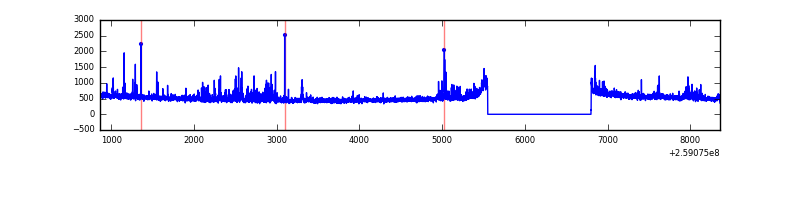 |
| D | 7495 | 6246 | 52 | 52 | 0.69% | 0.83% | 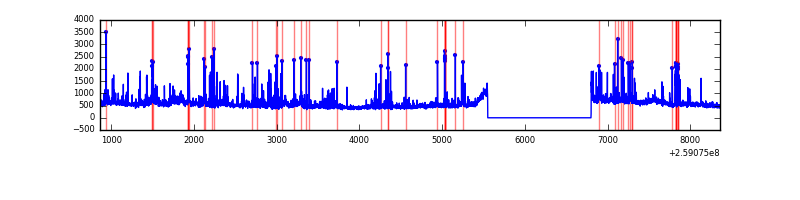 |
Top three noisy pixels from each quadrant. If the there are fewer than three noisy pixels in the level2.evt file, extra rows are filled as -1
| Pixel properties | Quadrant properties | ||||||
|---|---|---|---|---|---|---|---|
| Quadrant | DetID | PixID | Counts | Sigma | Mean | Median | Sigma |
| A | 8 | 15 | 25912 | 154.92 | 814 | 801 | 162.1 |
| A | 1 | 162 | 17770 | 104.69 | 814 | 801 | 162.1 |
| A | 5 | 98 | 8972 | 50.41 | 814 | 801 | 162.1 |
| B | 3 | 64 | 80734 | 528.46 | 815 | 797 | 151.3 |
| B | 4 | 142 | 30324 | 195.2 | 815 | 797 | 151.3 |
| B | 0 | 230 | 27738 | 178.11 | 815 | 797 | 151.3 |
| C | 14 | 220 | 230387 | 1290.96 | 780 | 788 | 177.9 |
| C | 3 | 233 | 80114 | 446.03 | 780 | 788 | 177.9 |
| C | 13 | 61 | 5538 | 26.71 | 780 | 788 | 177.9 |
| D | 13 | 249 | 393518 | 2149.17 | 770 | 751 | 182.8 |
| D | 8 | 195 | 353640 | 1930.96 | 770 | 751 | 182.8 |
| D | 5 | 222 | 76404 | 413.96 | 770 | 751 | 182.8 |
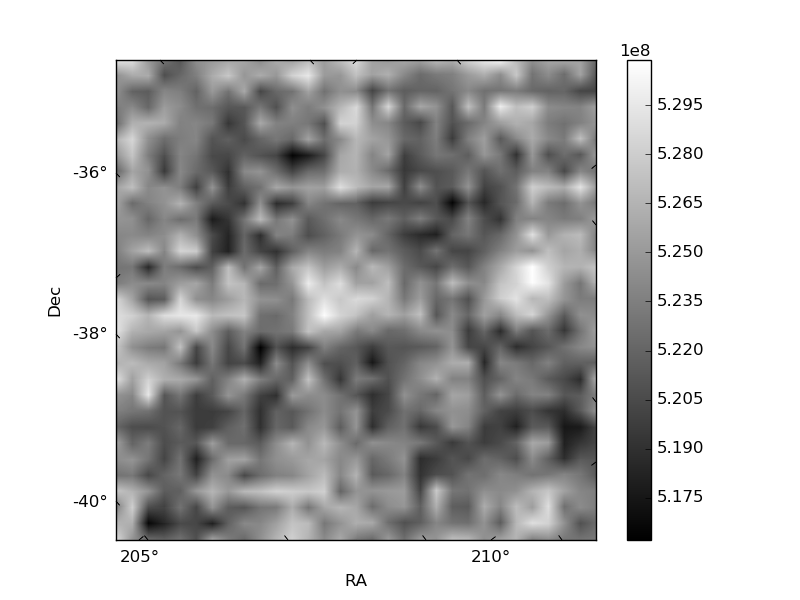
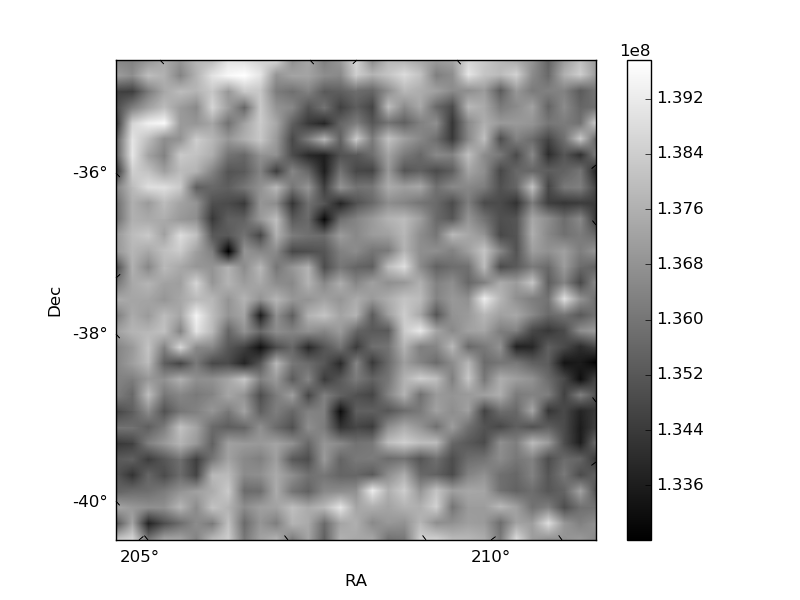
Histogram calculated using DETX and DETY for each event in the final _common_clean file
| Quadrant A | 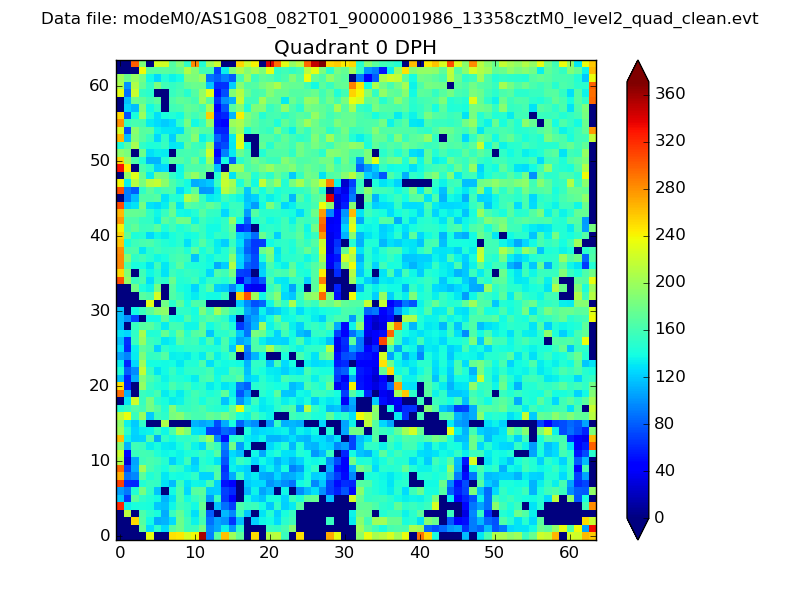 |
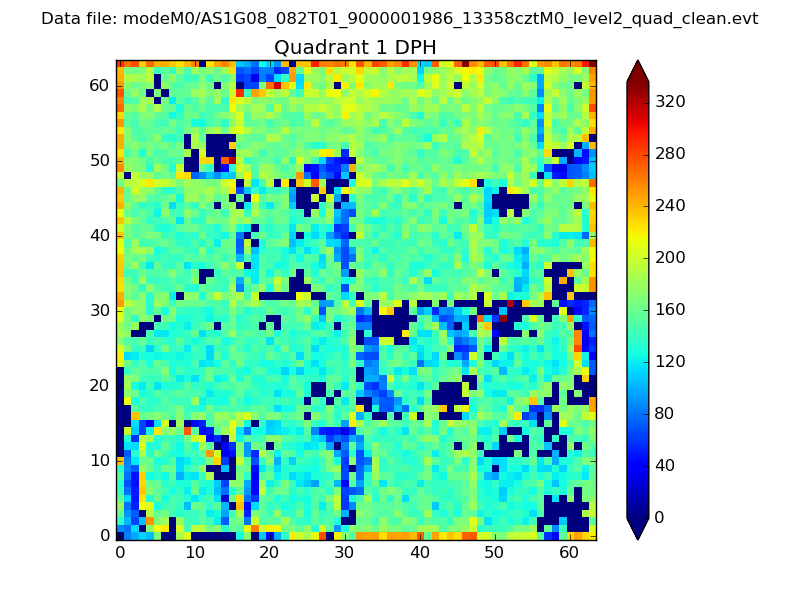 |
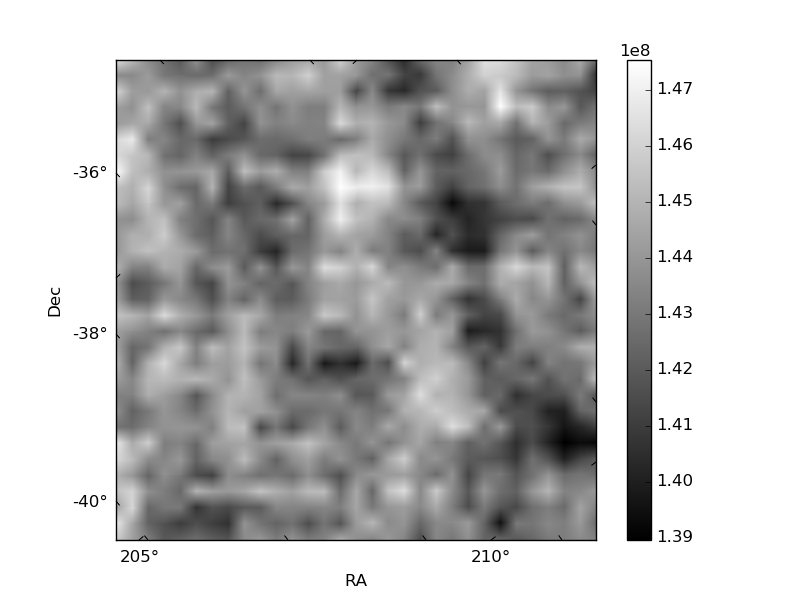
Quadrant B |
|---|---|---|---|
| Quadrant D | 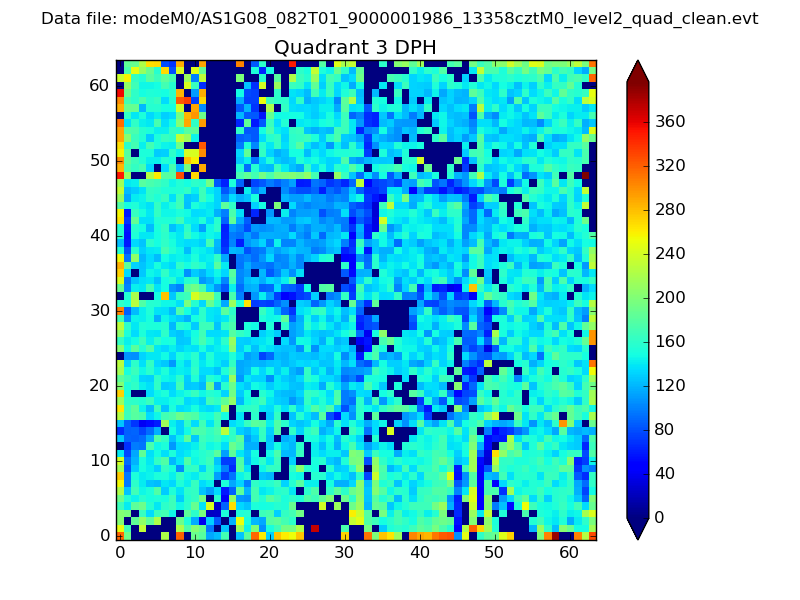 |
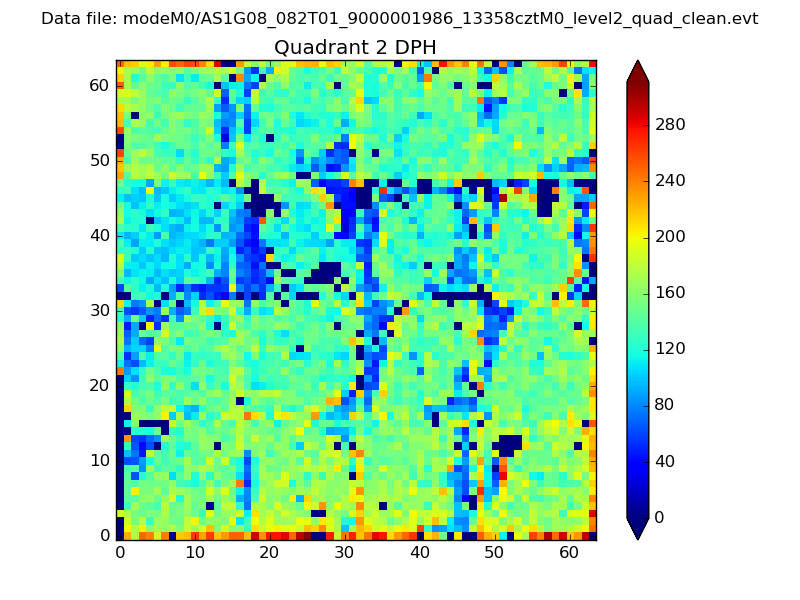 |
Quadrant C |
| Plot type | Count rate plots | Images |
|---|---|---|
| Comparison with Poisson distribution Blue bars denote a histogram of data divided into 1 sec bins. Red curve is a Poisson curve with rate = median count rate of data. |
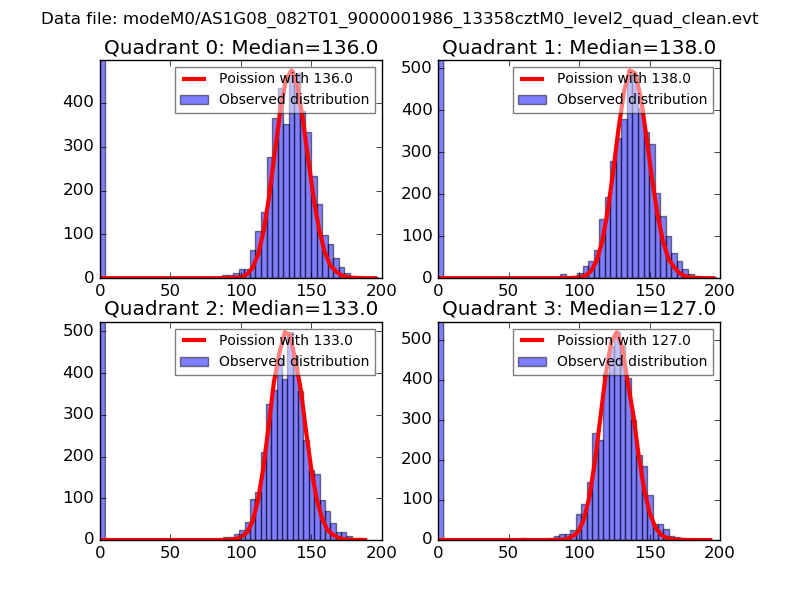 |
 |
| Quadrant-wise count rates Data is divided into 100 sec bins |
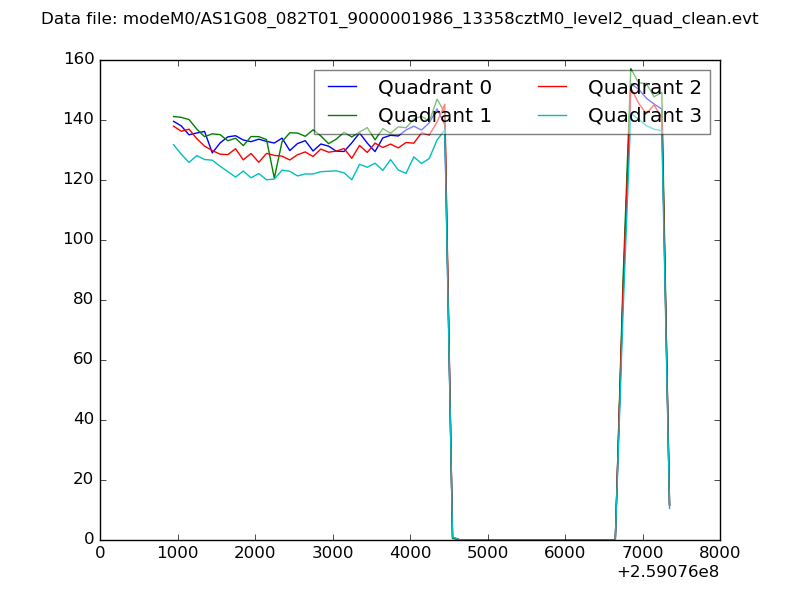 |
|
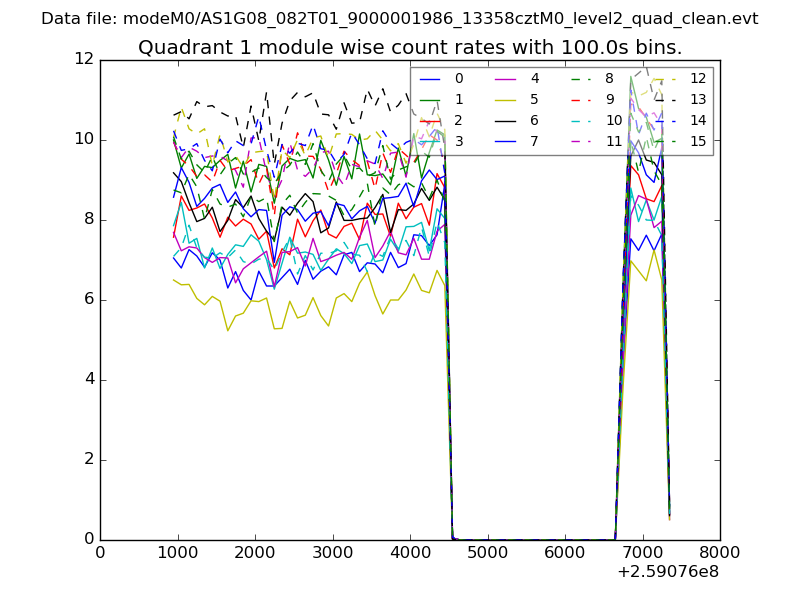
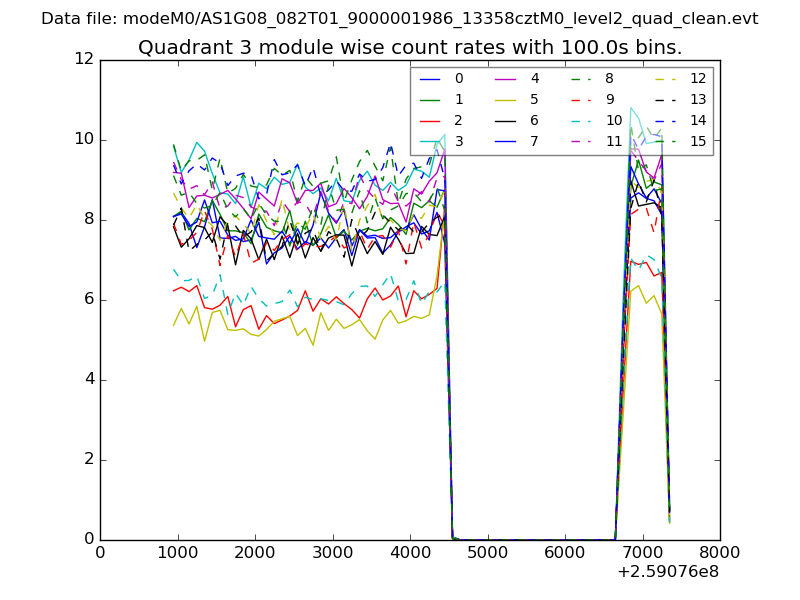
| Module-wise count rates for Quadrant A Data is divided into 100 sec bins |
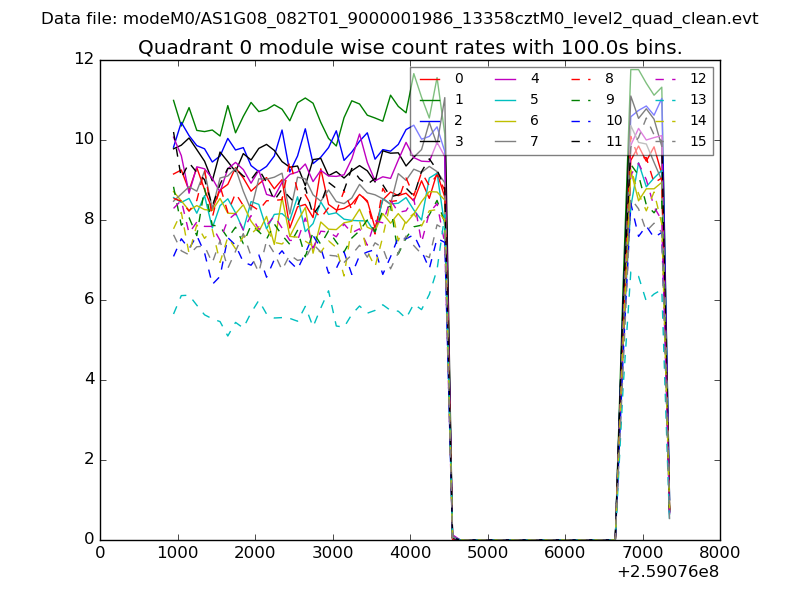 |
 |
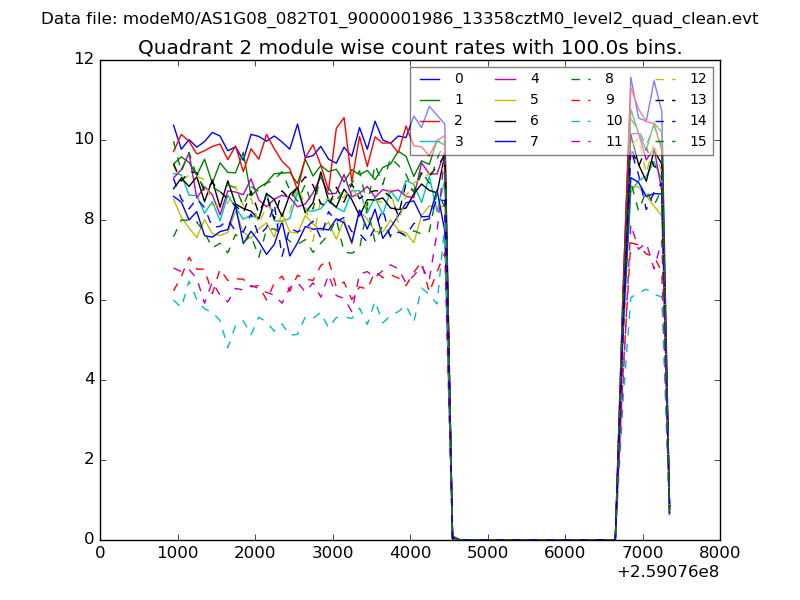
| Module-wise count rates for Quadrant B Data is divided into 100 sec bins |
 |
 |
| Module-wise count rates for Quadrant C Data is divided into 100 sec bins |
 |
 |
| Module-wise count rates for Quadrant D Data is divided into 100 sec bins |
 |
 |
| Parameter | Plot |
|---|---|
| CZT HV Monitor | 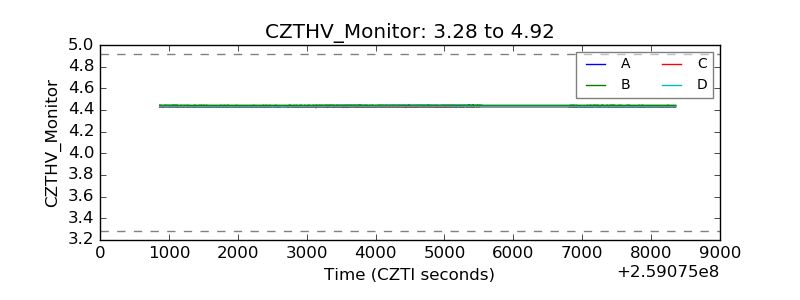 |
| D_VDD | 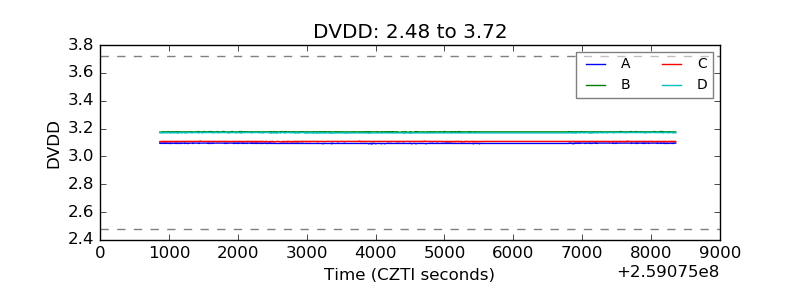 |
| Temperature 1 | 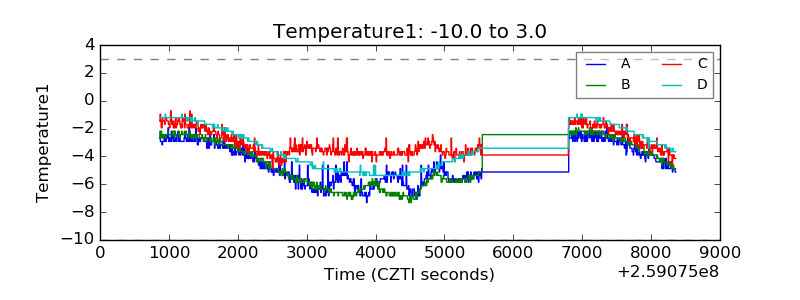 |
| Veto HV Monitor | 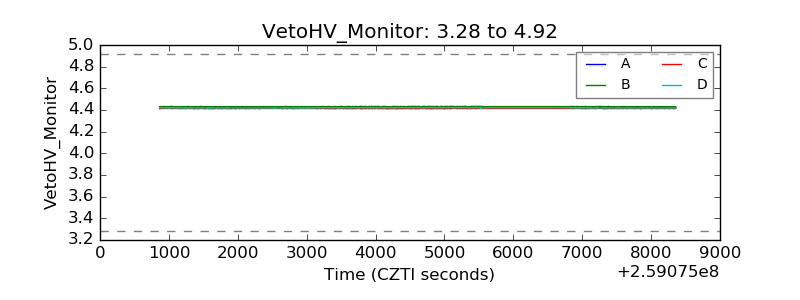 |
| Veto LLD | 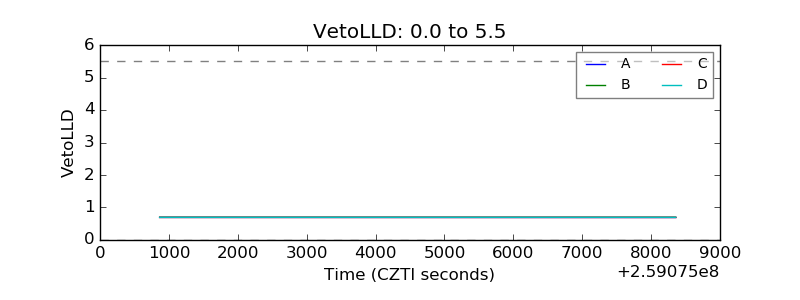 |
| Alpha Counter | 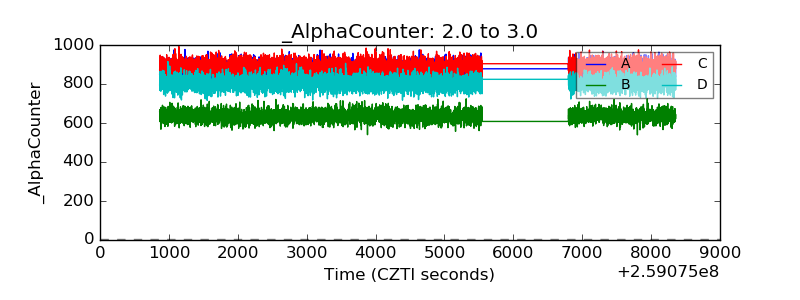 |
| _CPM_Rate | 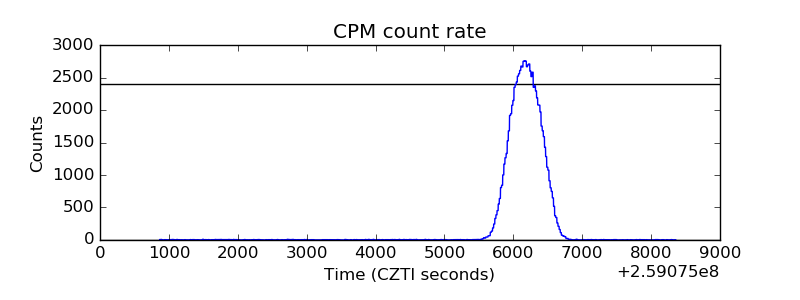 |
| CZT Counter | 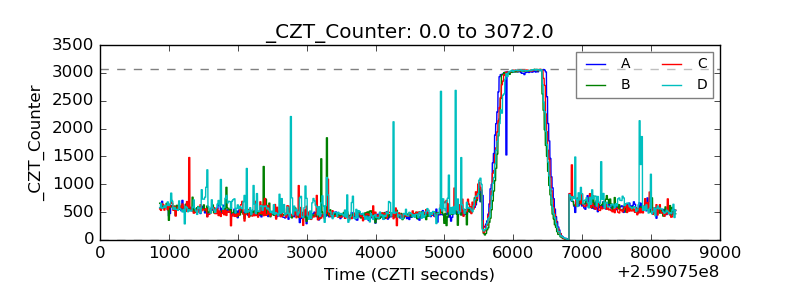 |
| +2.5 Volts monitor |  |
| +5 Volts monitor | 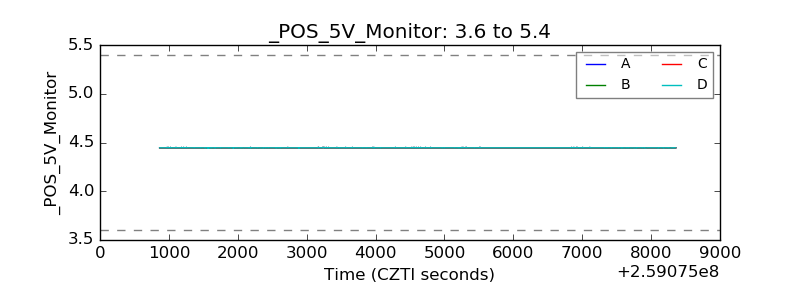 |
| _ROLL_ROT | 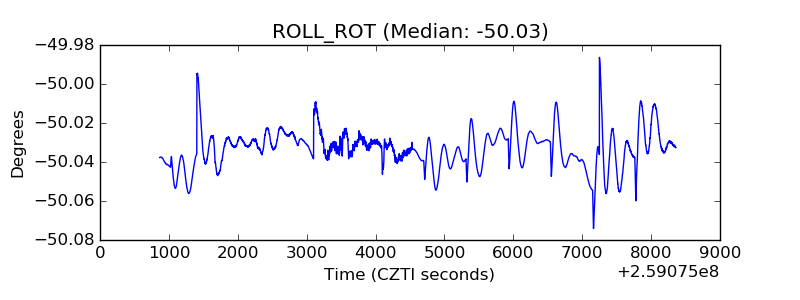 |
| _Roll_DEC | 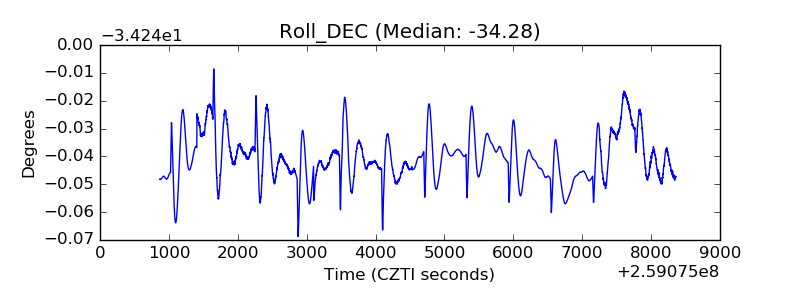 |
| _Roll_RA | 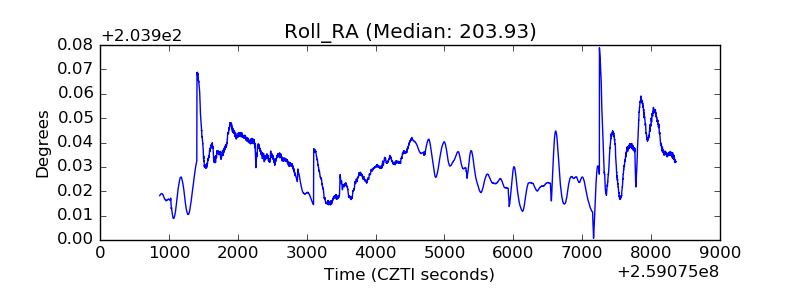 |
| Veto Counter | 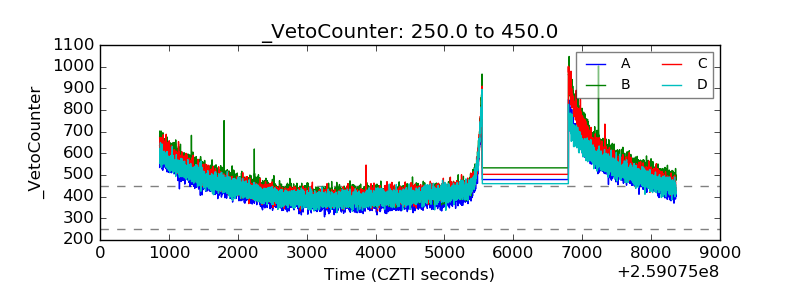 |