| Param | Original file | Final file |
|---|---|---|
| Filename | modeM0/AS1G08_082T01_9000001986_13359cztM0_level2.evt | modeM0/AS1G08_082T01_9000001986_13359cztM0_level2_quad_clean.evt |
| Size (bytes) | 444,888,000 | 93,458,880 |
| Size | 424.3 MB | 89.1 MB |
| Events in quadrant A | 3,176,725 | 610,306 |
| Events in quadrant B | 3,247,293 | 628,264 |
| Events in quadrant C | 3,334,138 | 597,816 |
| Events in quadrant D | 3,305,656 | 572,685 |
| Mode M9 | |||
|---|---|---|---|
| Quadrant | BADHDUFLAG | Total packets | Discarded packets |
| A | 0 | 13 | 0 |
| B | 0 | 13 | 0 |
| C | 0 | 13 | 0 |
| D | 0 | 13 | 0 |
| Mode M0 | |||
|---|---|---|---|
| Quadrant | BADHDUFLAG | Total packets | Discarded packets |
| A | 0 | 13354 | 3 |
| B | 0 | 13606 | 2 |
| C | 0 | 13761 | 2 |
| D | 0 | 13970 | 2 |
| Mode SS | |||
|---|---|---|---|
| Quadrant | BADHDUFLAG | Total packets | Discarded packets |
| A | 0 | 124 | 0 |
| B | 0 | 124 | 0 |
| C | 0 | 124 | 0 |
| D | 0 | 124 | 0 |
| Quadrant | Total seconds | Saturated seconds | Saturation percentage |
|---|---|---|---|
| A | 6027 | 82 | 1.360544% |
| B | 6027 | 86 | 1.426912% |
| C | 6027 | 59 | 0.978928% |
| D | 6027 | 100 | 1.659200% |
Noise dominated data is calculated using 1-second bins in cleaned event files. If a bin has >2000 counts, and if more than 50% of those come from <1% of pixels, then it is considered to be noise-dominated and hence unusable.
| Quadrant | # 1 sec bins | Bins with >0 counts | Bins with >2000 counts | High rate bins dominated by noise | Noise dominated (total time) | Noise dominated (detector-on time) | Marked lightcurve |
|---|---|---|---|---|---|---|---|
| A | 7353 | 6029 | 0 | 0 | 0.00% | 0.00% | 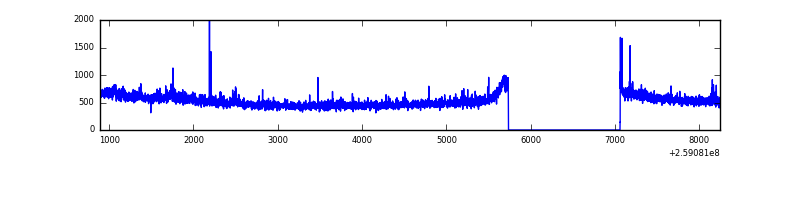 |
| B | 7353 | 6029 | 8 | 8 | 0.11% | 0.13% | 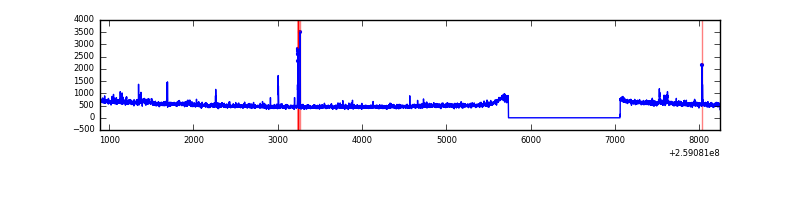 |
| C | 7353 | 6029 | 8 | 8 | 0.11% | 0.13% | 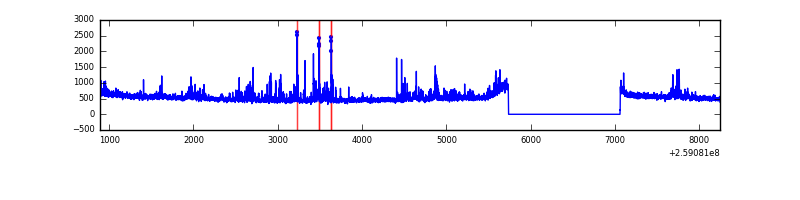 |
| D | 7353 | 6029 | 27 | 27 | 0.37% | 0.45% | 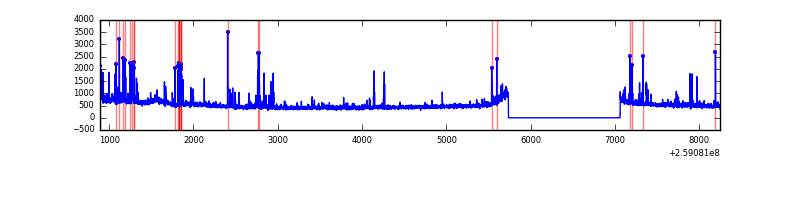 |
Top three noisy pixels from each quadrant. If the there are fewer than three noisy pixels in the level2.evt file, extra rows are filled as -1
| Pixel properties | Quadrant properties | ||||||
|---|---|---|---|---|---|---|---|
| Quadrant | DetID | PixID | Counts | Sigma | Mean | Median | Sigma |
| A | 8 | 15 | 38302 | 235.77 | 798 | 782 | 159.1 |
| A | 1 | 162 | 28873 | 176.52 | 798 | 782 | 159.1 |
| A | 9 | 143 | 18248 | 109.76 | 798 | 782 | 159.1 |
| B | 3 | 64 | 35481 | 232.14 | 803 | 787 | 149.5 |
| B | 0 | 197 | 23165 | 149.73 | 803 | 787 | 149.5 |
| B | 4 | 142 | 22964 | 148.39 | 803 | 787 | 149.5 |
| C | 14 | 220 | 293565 | 1676.82 | 764 | 772 | 174.6 |
| C | 3 | 233 | 59965 | 339.0 | 764 | 772 | 174.6 |
| C | 13 | 61 | 5573 | 27.5 | 764 | 772 | 174.6 |
| D | 13 | 249 | 186704 | 1041.51 | 757 | 738 | 178.6 |
| D | 8 | 195 | 126884 | 706.49 | 757 | 738 | 178.6 |
| D | 1 | 52 | 84410 | 468.61 | 757 | 738 | 178.6 |
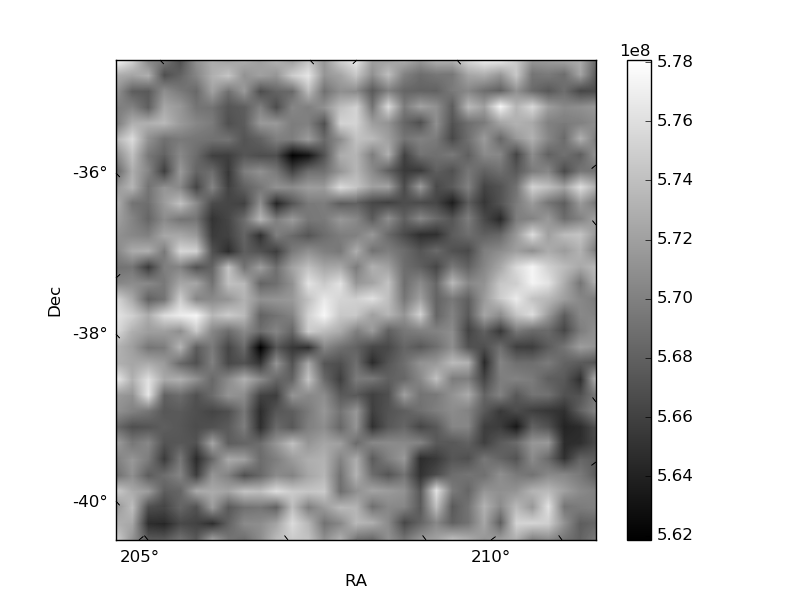
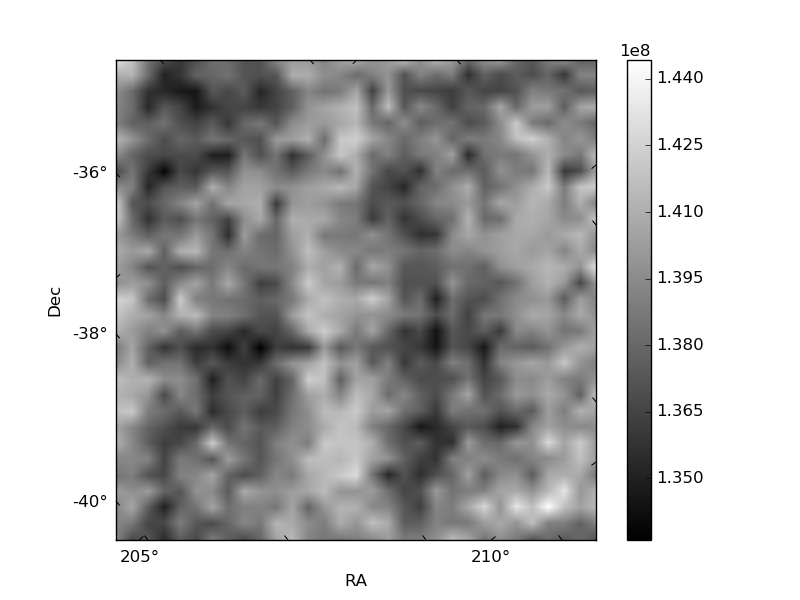
Histogram calculated using DETX and DETY for each event in the final _common_clean file
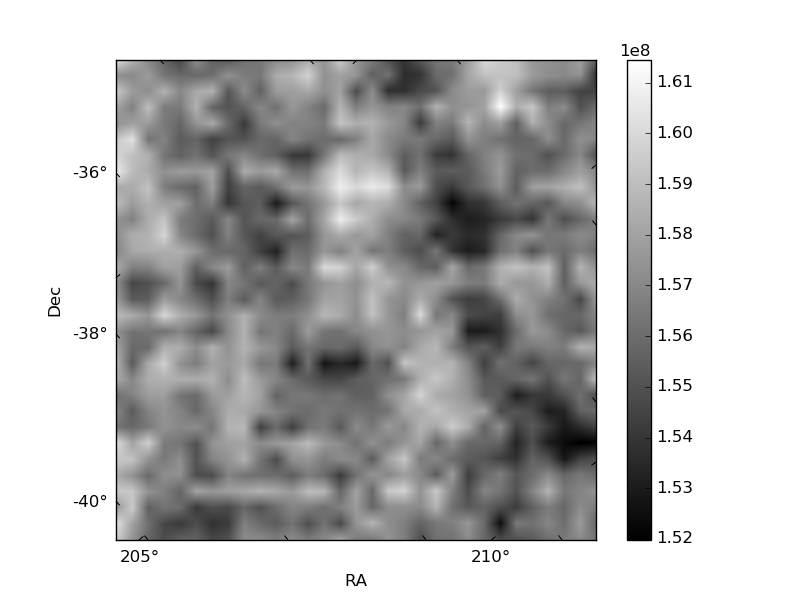
| Quadrant A | 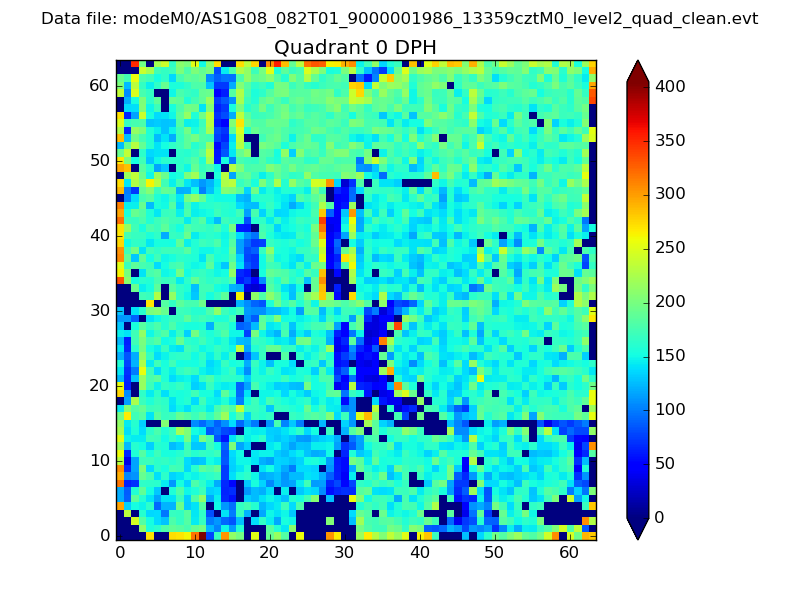 |
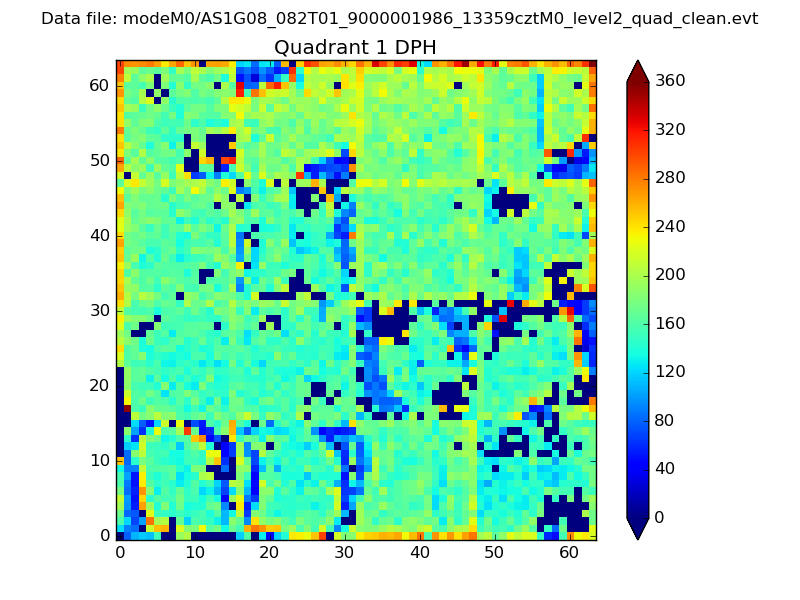 |
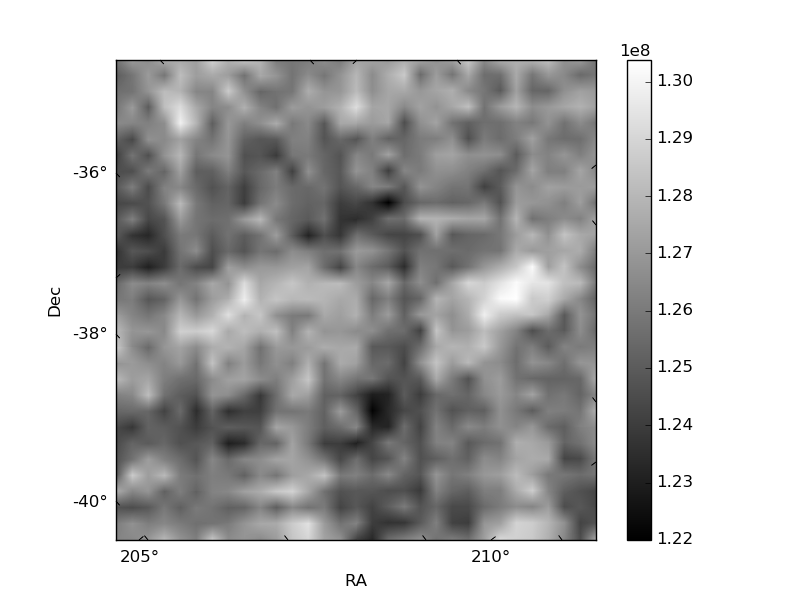
Quadrant B |
|---|---|---|---|
| Quadrant D | 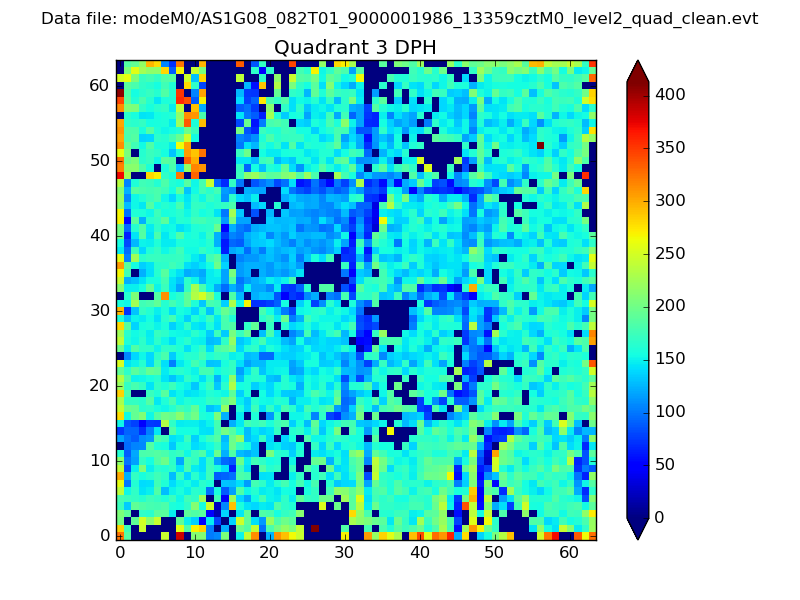 |
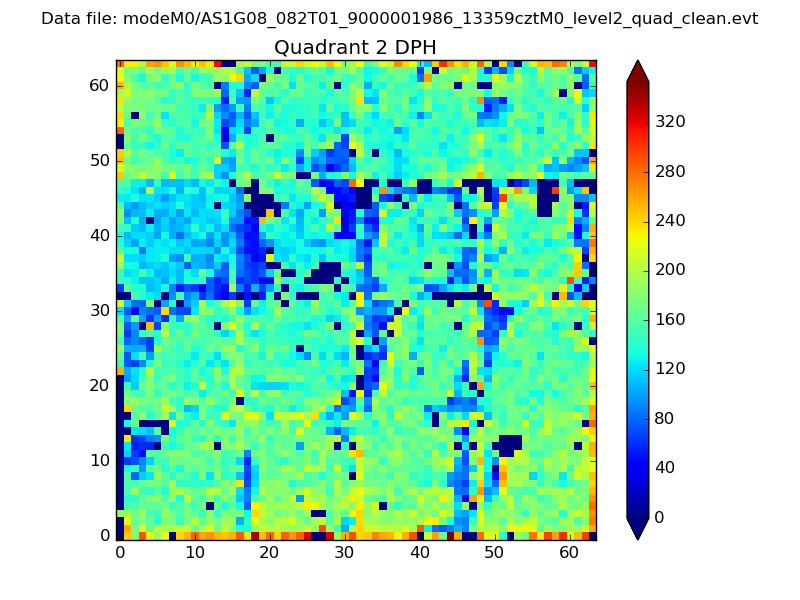 |
Quadrant C |
| Plot type | Count rate plots | Images |
|---|---|---|
| Comparison with Poisson distribution Blue bars denote a histogram of data divided into 1 sec bins. Red curve is a Poisson curve with rate = median count rate of data. |
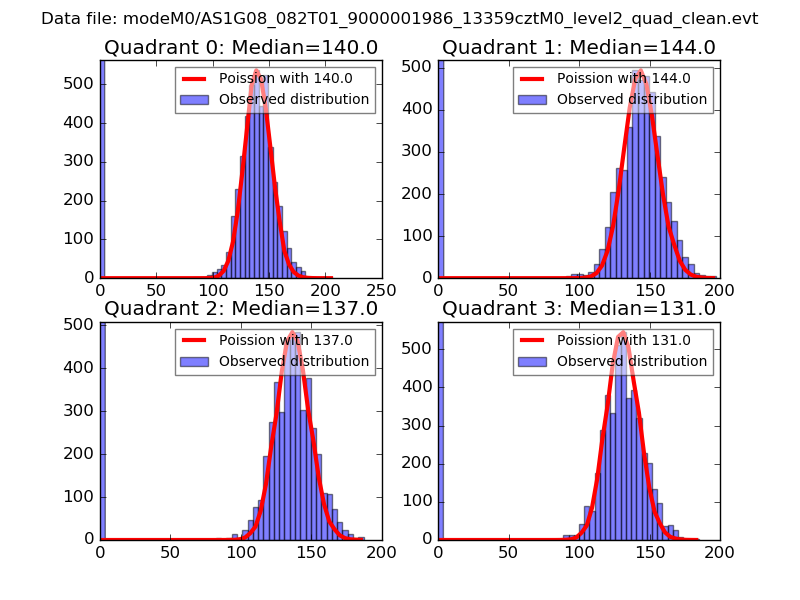 |
 |
| Quadrant-wise count rates Data is divided into 100 sec bins |
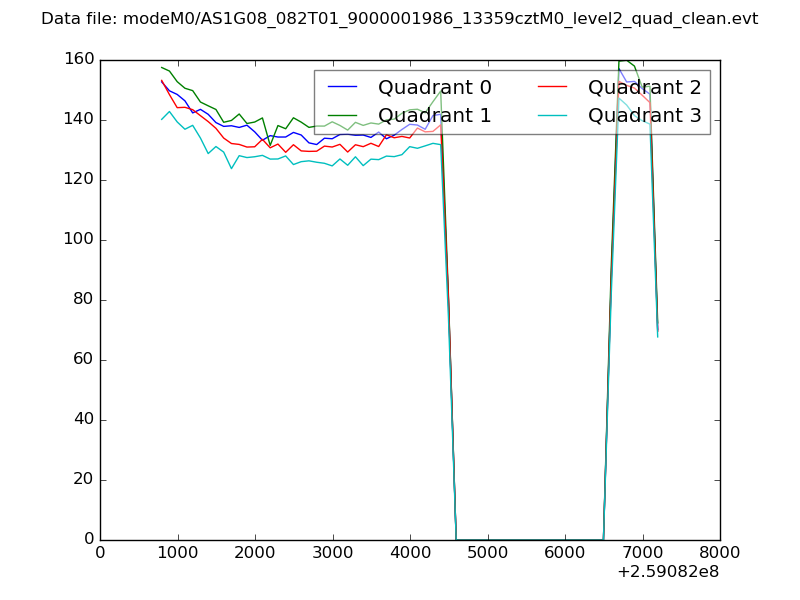 |
|
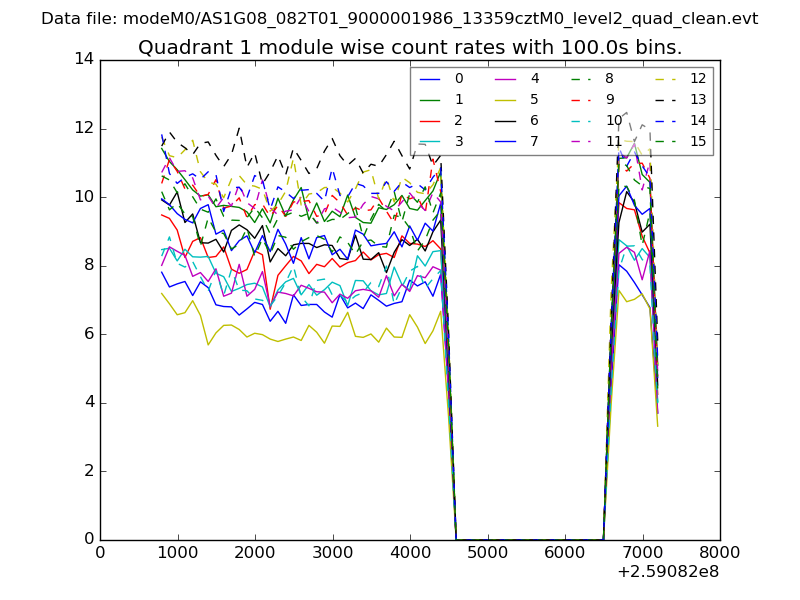
| Module-wise count rates for Quadrant A Data is divided into 100 sec bins |
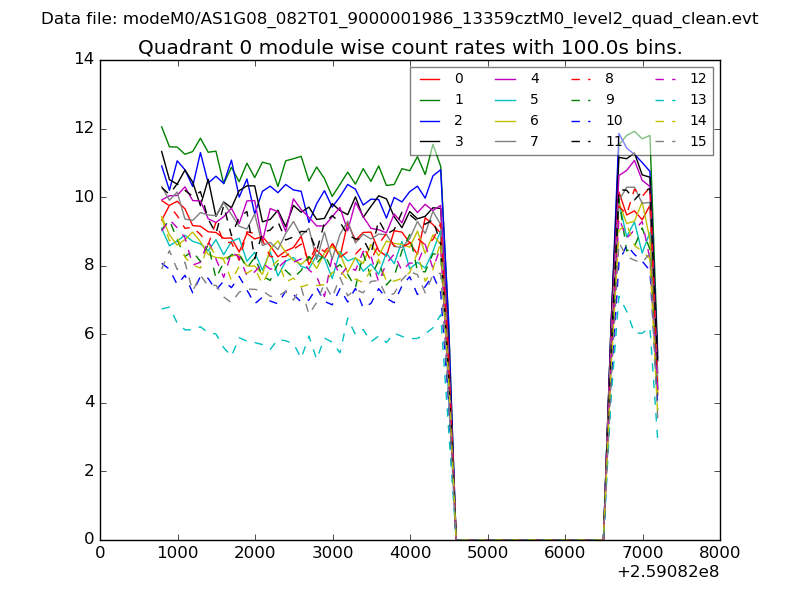 |
 |
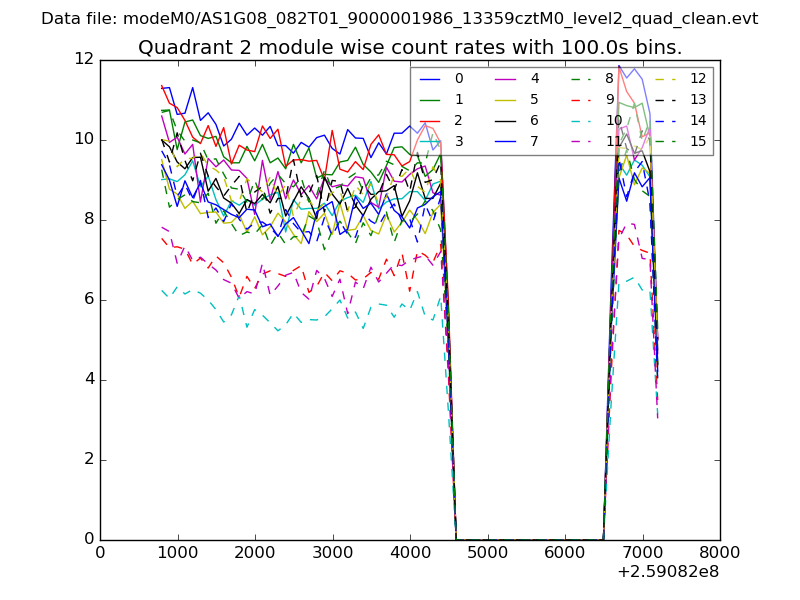
| Module-wise count rates for Quadrant B Data is divided into 100 sec bins |
 |
 |
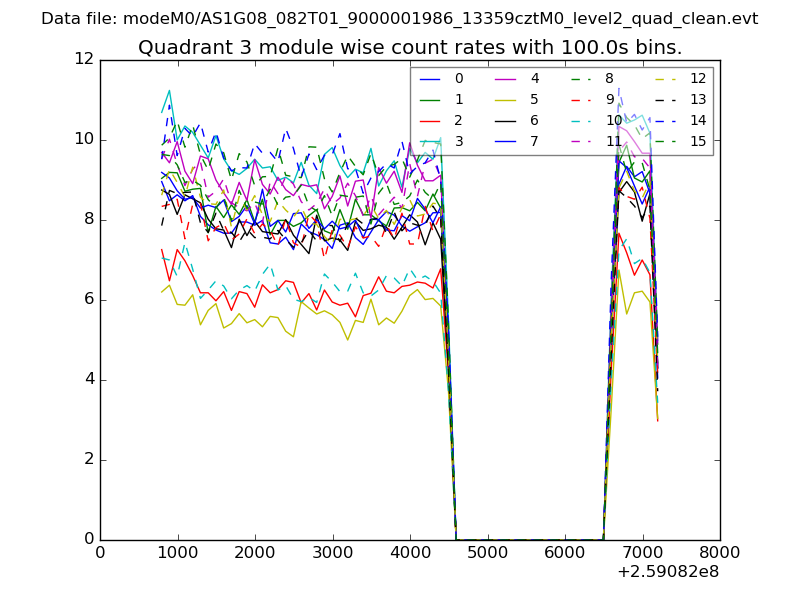
| Module-wise count rates for Quadrant C Data is divided into 100 sec bins |
 |
 |
| Module-wise count rates for Quadrant D Data is divided into 100 sec bins |
 |
 |
| Parameter | Plot |
|---|---|
| CZT HV Monitor | 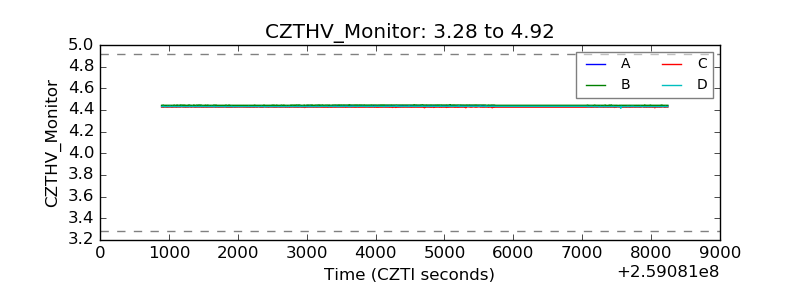 |
| D_VDD | 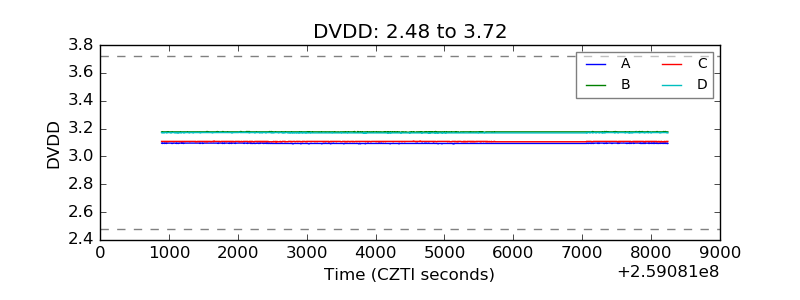 |
| Temperature 1 | 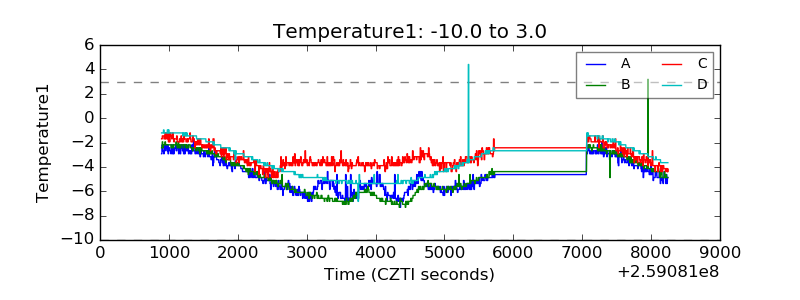 |
| Veto HV Monitor | 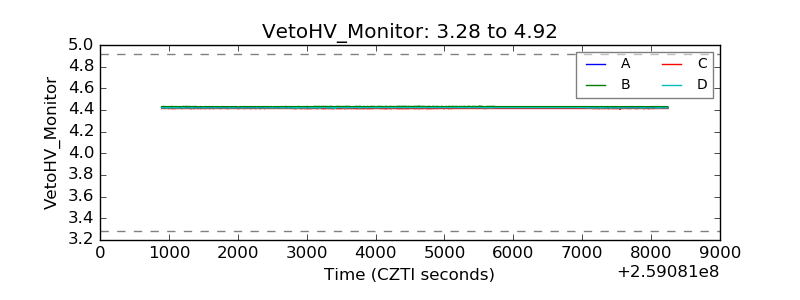 |
| Veto LLD | 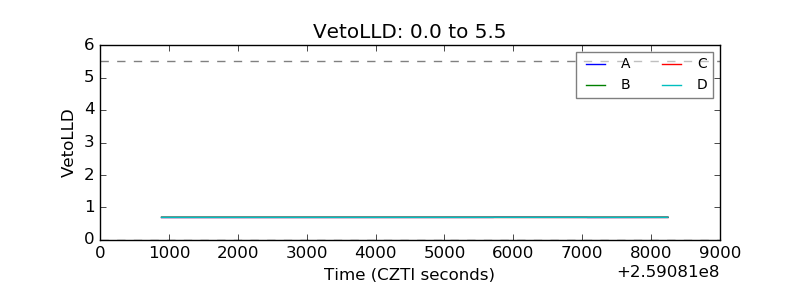 |
| Alpha Counter | 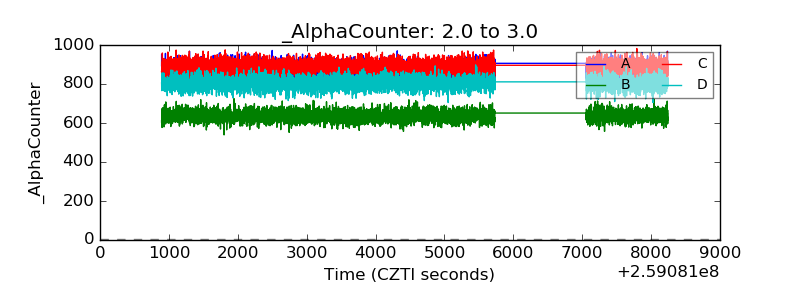 |
| _CPM_Rate | 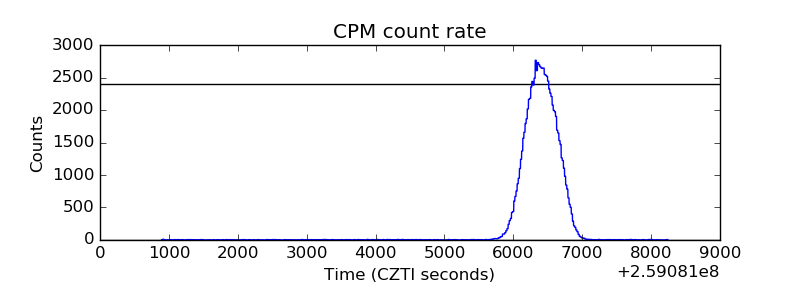 |
| CZT Counter | 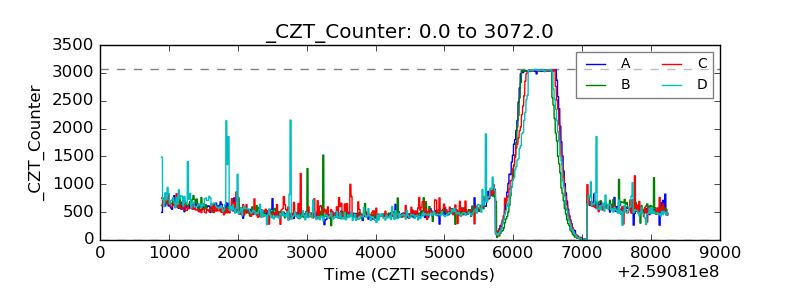 |
| +2.5 Volts monitor | 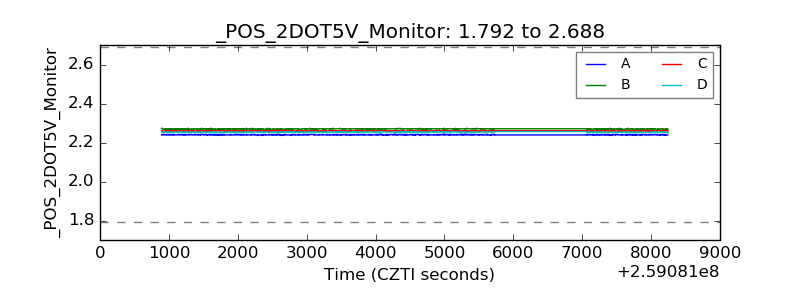 |
| +5 Volts monitor | 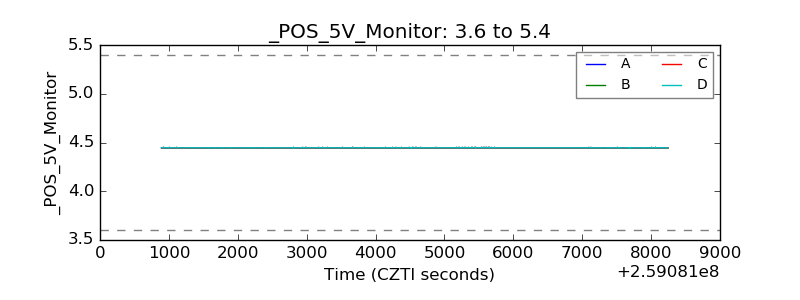 |
| _ROLL_ROT | 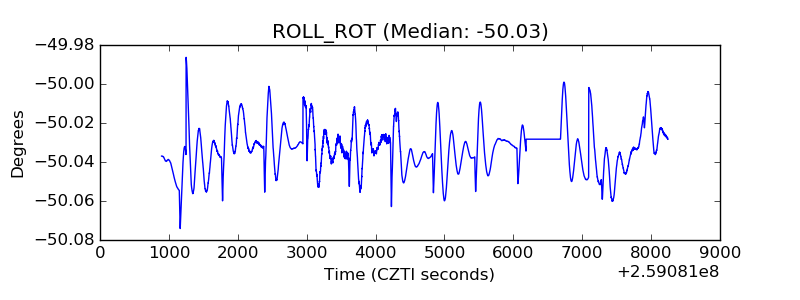 |
| _Roll_DEC | 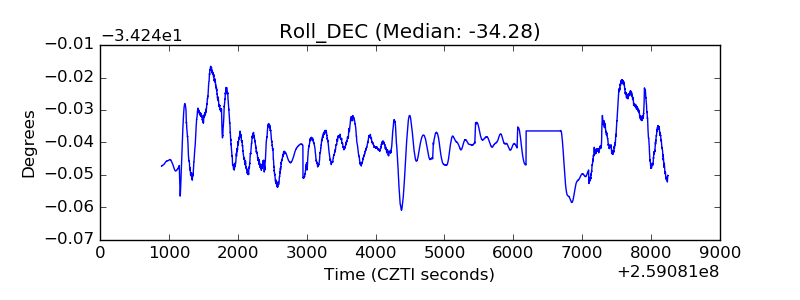 |
| _Roll_RA | 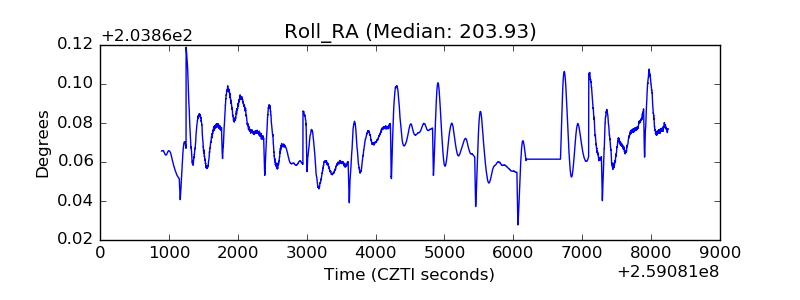 |
| Veto Counter | 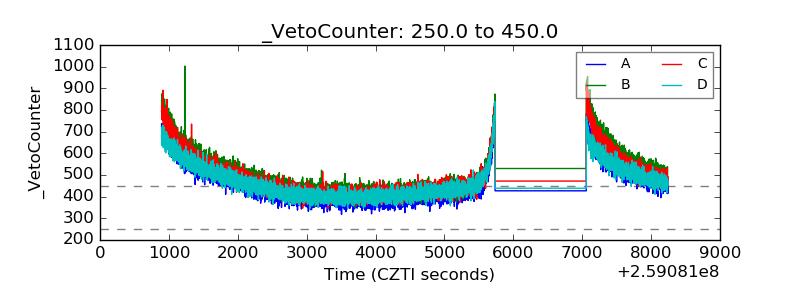 |