| Param | Original file | Final file |
|---|---|---|
| Filename | modeM0/AS1G08_082T01_9000001986_13360cztM0_level2.evt | modeM0/AS1G08_082T01_9000001986_13360cztM0_level2_quad_clean.evt |
| Size (bytes) | 440,461,440 | 102,288,960 |
| Size | 420.1 MB | 97.6 MB |
| Events in quadrant A | 3,105,991 | 676,196 |
| Events in quadrant B | 3,235,562 | 699,003 |
| Events in quadrant C | 3,514,136 | 663,872 |
| Events in quadrant D | 3,067,173 | 630,878 |
| Mode M9 | |||
|---|---|---|---|
| Quadrant | BADHDUFLAG | Total packets | Discarded packets |
| A | 0 | 17 | 0 |
| B | 0 | 17 | 0 |
| C | 0 | 17 | 0 |
| D | 0 | 18 | 0 |
| Mode M0 | |||
|---|---|---|---|
| Quadrant | BADHDUFLAG | Total packets | Discarded packets |
| A | 0 | 13111 | 3 |
| B | 0 | 13551 | 2 |
| C | 0 | 14339 | 2 |
| D | 0 | 13295 | 2 |
| Mode SS | |||
|---|---|---|---|
| Quadrant | BADHDUFLAG | Total packets | Discarded packets |
| A | 0 | 124 | 0 |
| B | 0 | 124 | 0 |
| C | 0 | 124 | 0 |
| D | 0 | 124 | 0 |
| Quadrant | Total seconds | Saturated seconds | Saturation percentage |
|---|---|---|---|
| A | 6132 | 56 | 0.913242% |
| B | 6132 | 72 | 1.174168% |
| C | 6132 | 75 | 1.223092% |
| D | 6132 | 38 | 0.619700% |
Noise dominated data is calculated using 1-second bins in cleaned event files. If a bin has >2000 counts, and if more than 50% of those come from <1% of pixels, then it is considered to be noise-dominated and hence unusable.
| Quadrant | # 1 sec bins | Bins with >0 counts | Bins with >2000 counts | High rate bins dominated by noise | Noise dominated (total time) | Noise dominated (detector-on time) | Marked lightcurve |
|---|---|---|---|---|---|---|---|
| A | 7518 | 6134 | 0 | 0 | 0.00% | 0.00% | 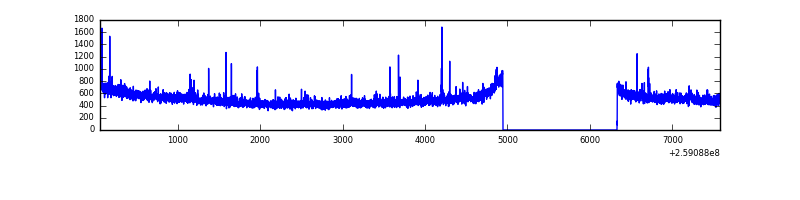 |
| B | 7518 | 6134 | 4 | 4 | 0.05% | 0.07% | 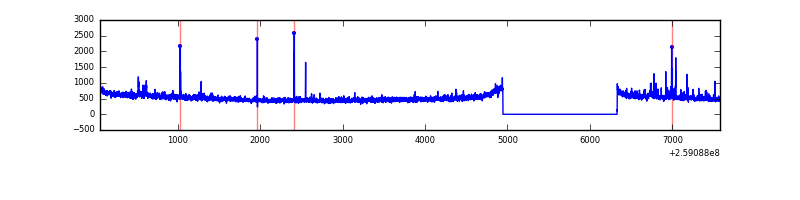 |
| C | 7518 | 6134 | 49 | 49 | 0.65% | 0.80% | 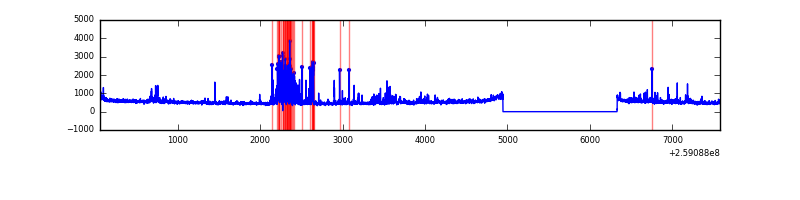 |
| D | 7518 | 6134 | 12 | 12 | 0.16% | 0.20% | 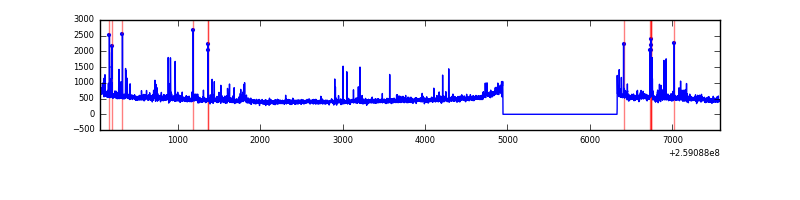 |
Top three noisy pixels from each quadrant. If the there are fewer than three noisy pixels in the level2.evt file, extra rows are filled as -1
| Pixel properties | Quadrant properties | ||||||
|---|---|---|---|---|---|---|---|
| Quadrant | DetID | PixID | Counts | Sigma | Mean | Median | Sigma |
| A | 9 | 143 | 22917 | 140.06 | 788 | 775 | 158.1 |
| A | 1 | 162 | 19366 | 117.6 | 788 | 775 | 158.1 |
| A | 15 | 69 | 11783 | 69.63 | 788 | 775 | 158.1 |
| B | 3 | 64 | 41564 | 272.6 | 799 | 782 | 149.6 |
| B | 0 | 197 | 33832 | 220.91 | 799 | 782 | 149.6 |
| B | 3 | 209 | 21143 | 136.1 | 799 | 782 | 149.6 |
| C | 14 | 220 | 476492 | 2735.19 | 759 | 766 | 173.9 |
| C | 3 | 233 | 72227 | 410.87 | 759 | 766 | 173.9 |
| C | 13 | 61 | 5408 | 26.69 | 759 | 766 | 173.9 |
| D | 1 | 52 | 121435 | 679.16 | 749 | 730 | 177.7 |
| D | 8 | 195 | 47836 | 265.05 | 749 | 730 | 177.7 |
| D | 13 | 249 | 24473 | 133.59 | 749 | 730 | 177.7 |
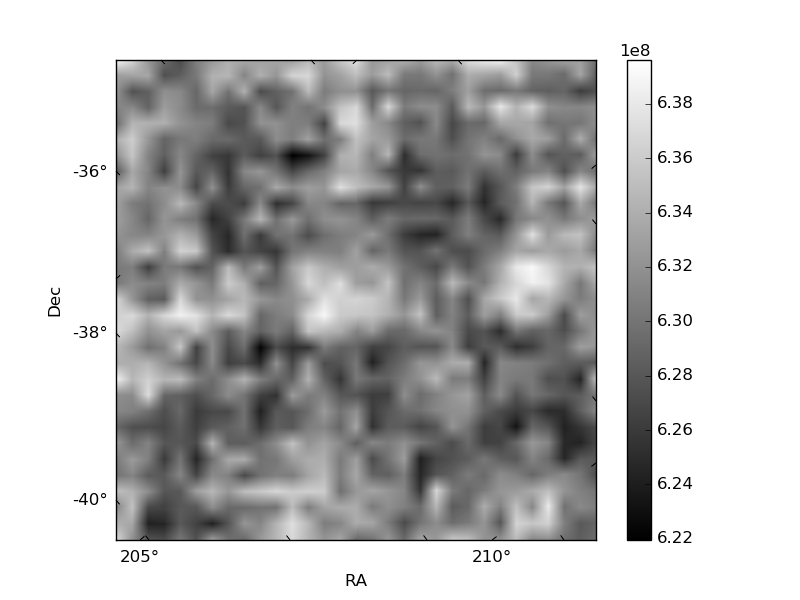
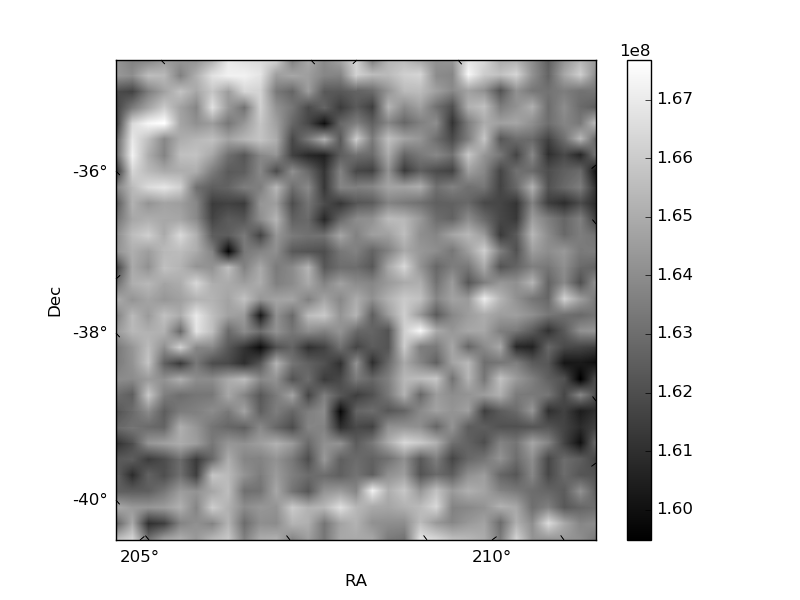
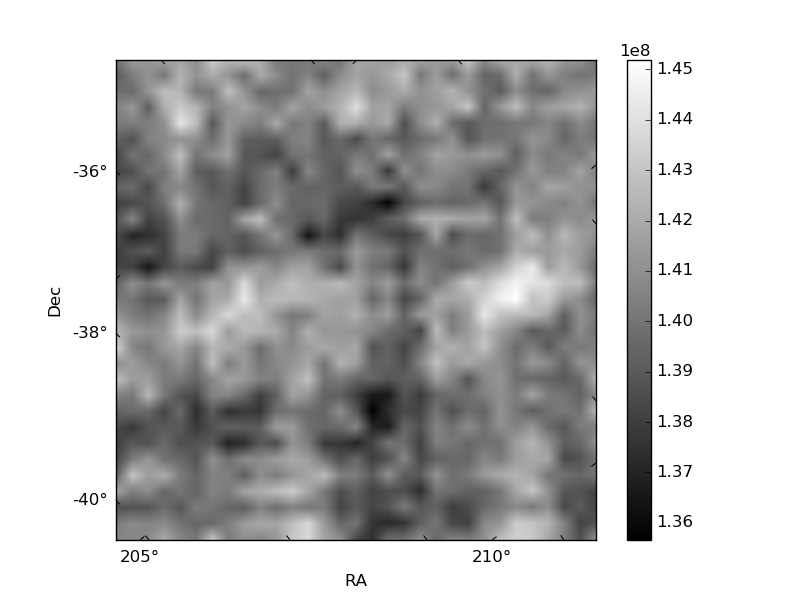
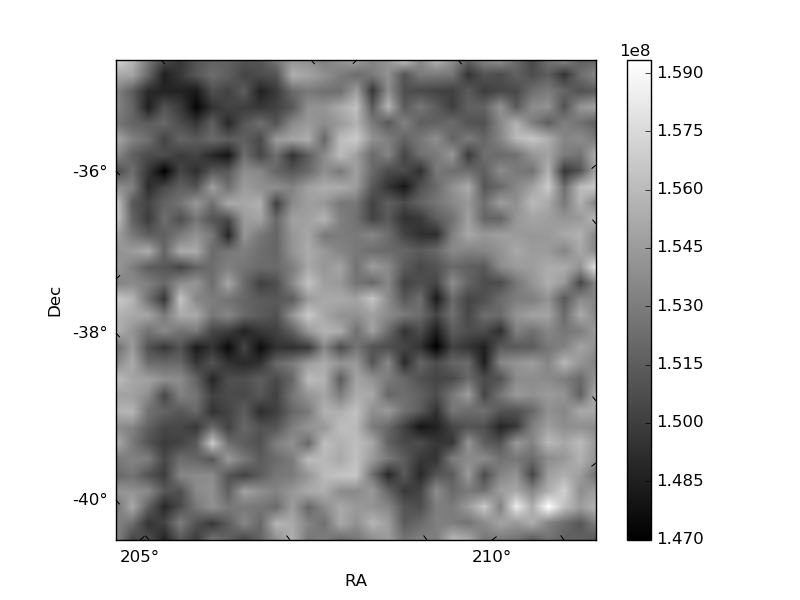
Histogram calculated using DETX and DETY for each event in the final _common_clean file
| Quadrant A | 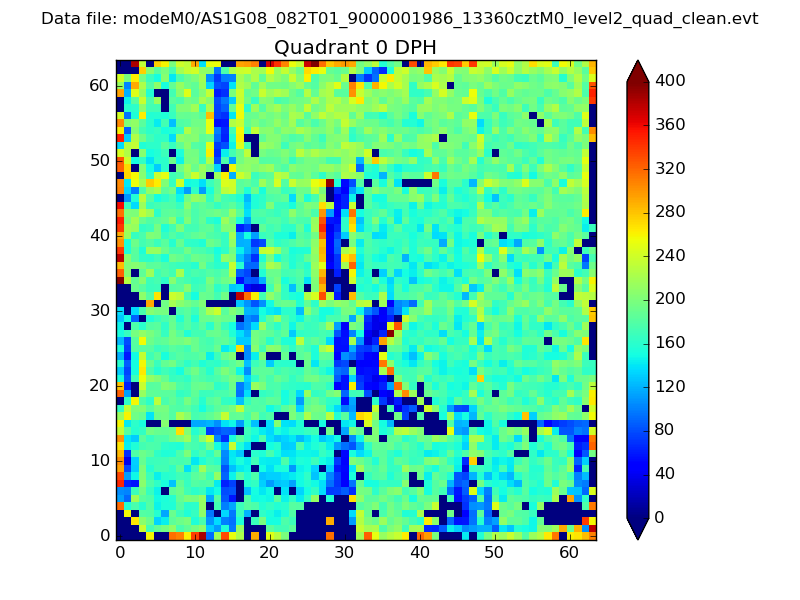 |
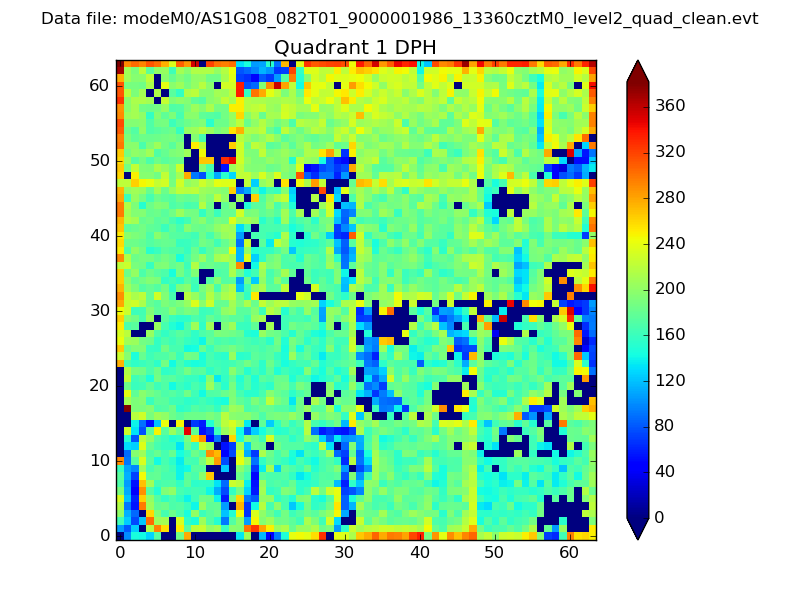 |
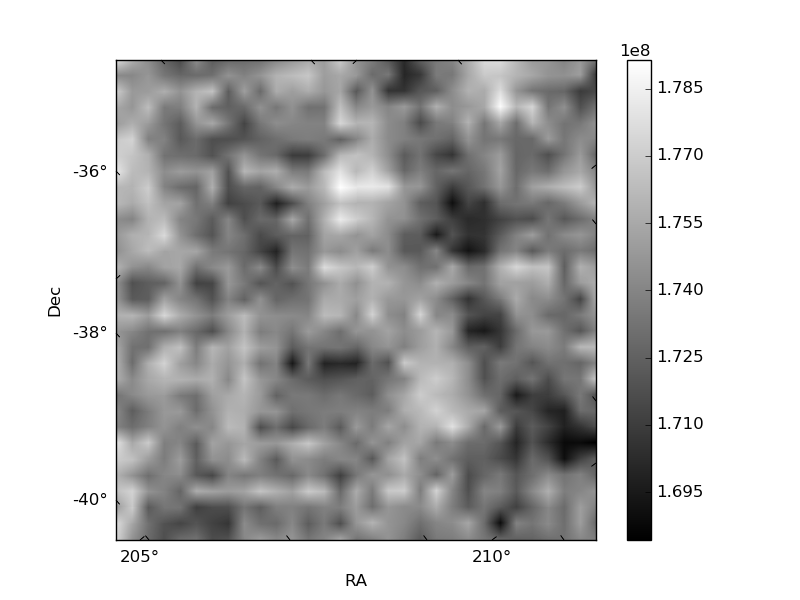
Quadrant B |
|---|---|---|---|
| Quadrant D | 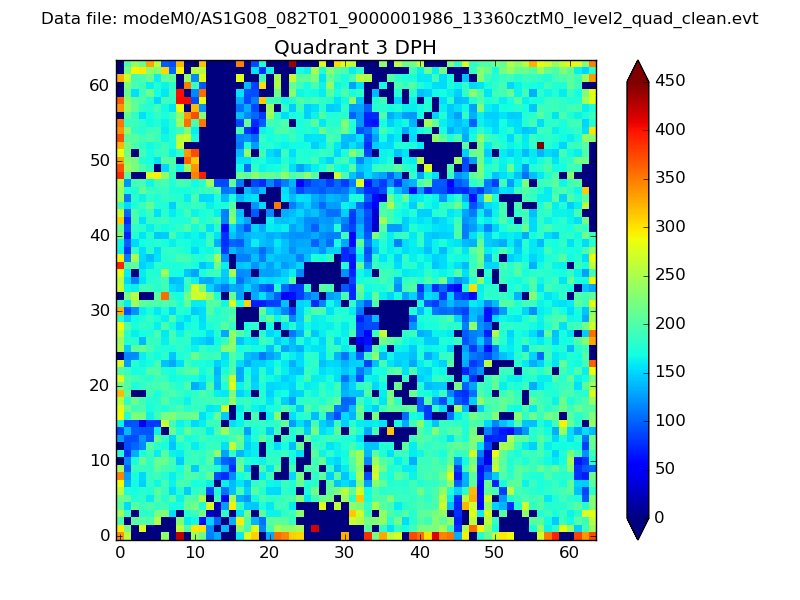 |
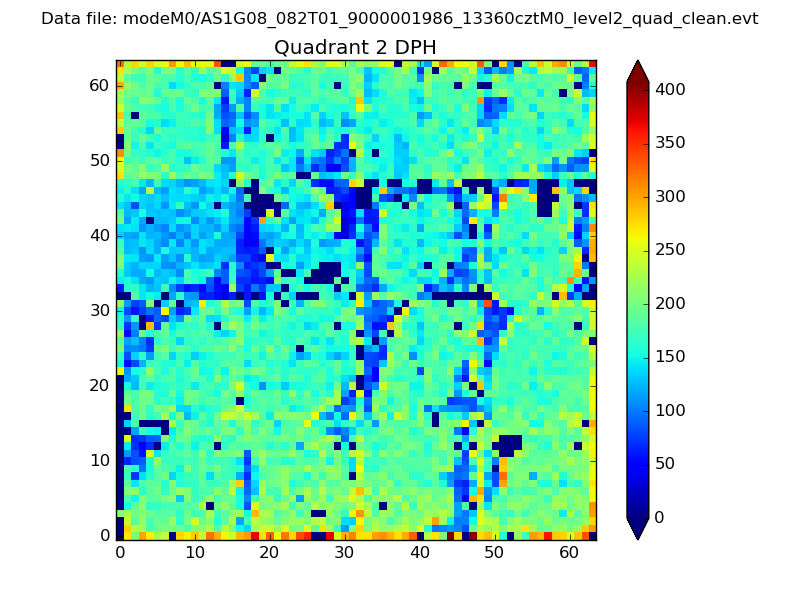 |
Quadrant C |
| Plot type | Count rate plots | Images |
|---|---|---|
| Comparison with Poisson distribution Blue bars denote a histogram of data divided into 1 sec bins. Red curve is a Poisson curve with rate = median count rate of data. |
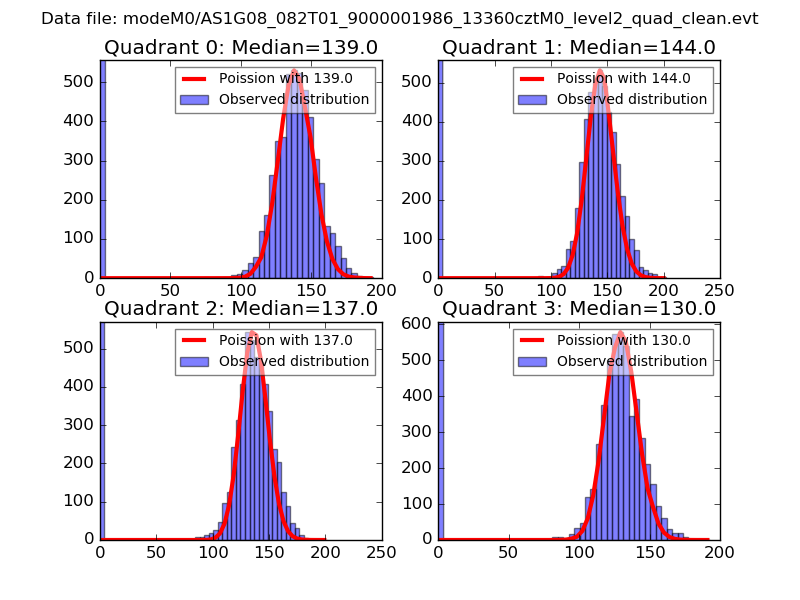 |
 |
| Quadrant-wise count rates Data is divided into 100 sec bins |
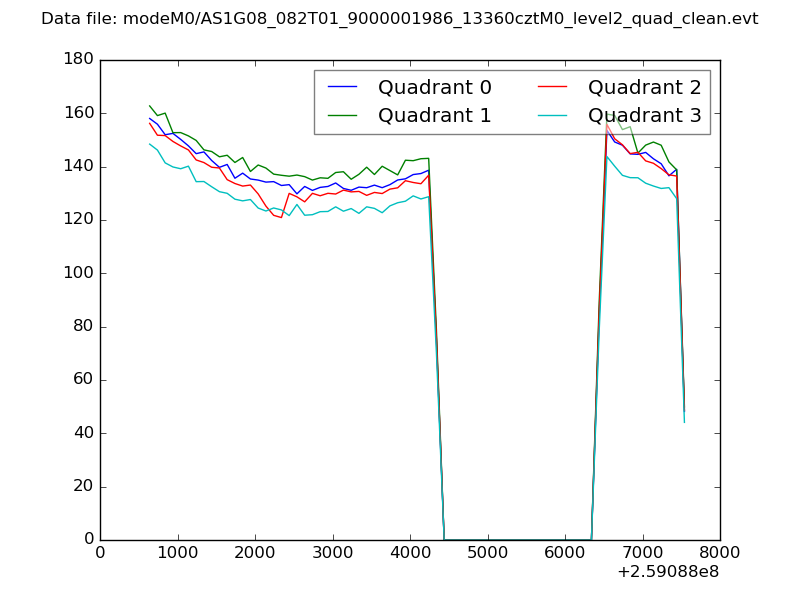 |
|
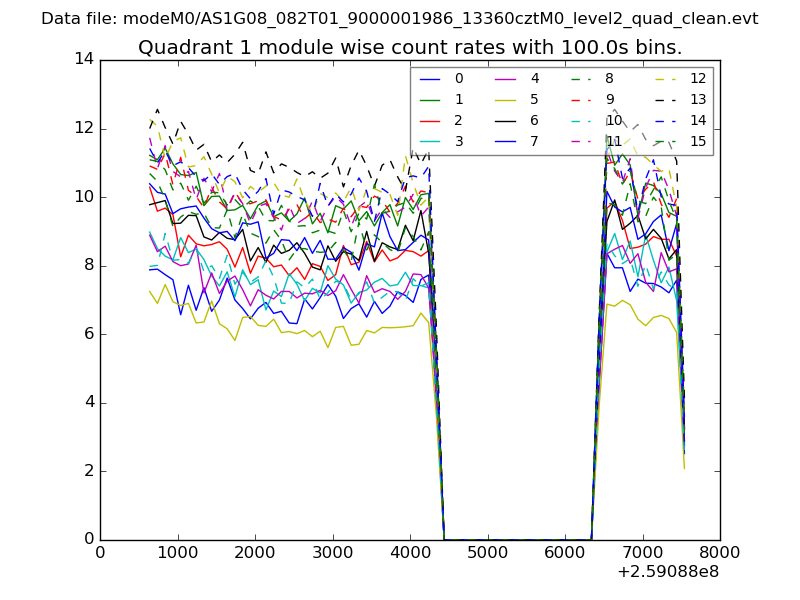
| Module-wise count rates for Quadrant A Data is divided into 100 sec bins |
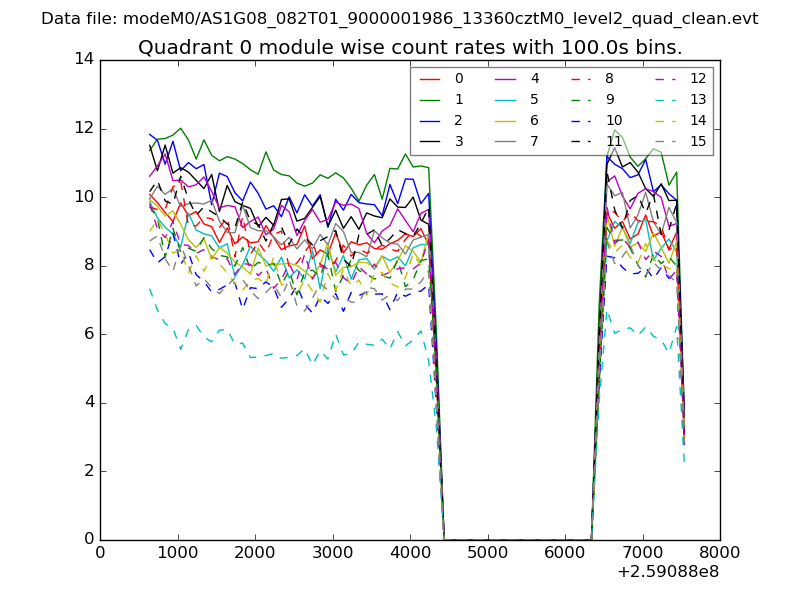 |
 |
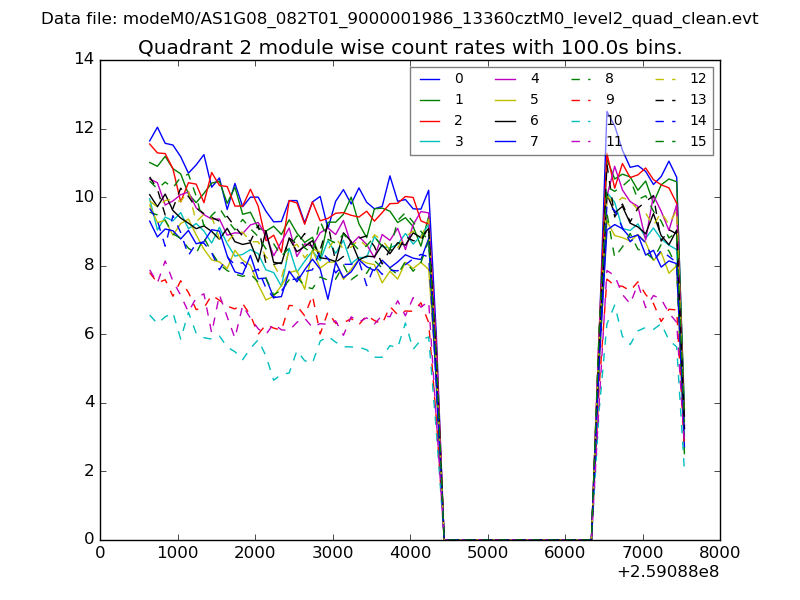
| Module-wise count rates for Quadrant B Data is divided into 100 sec bins |
 |
 |
| Module-wise count rates for Quadrant C Data is divided into 100 sec bins |
 |
 |
| Module-wise count rates for Quadrant D Data is divided into 100 sec bins |
 |
 |
| Parameter | Plot |
|---|---|
| CZT HV Monitor |  |
| D_VDD | 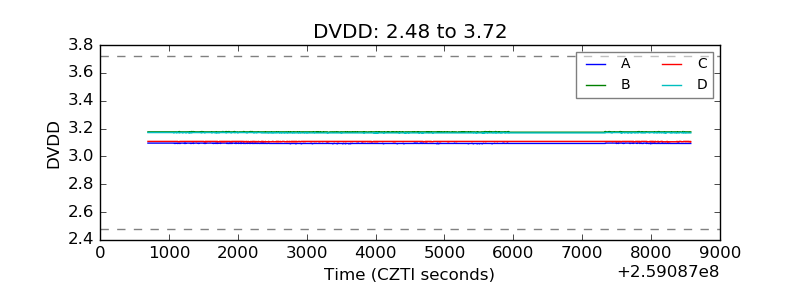 |
| Temperature 1 |  |
| Veto HV Monitor | 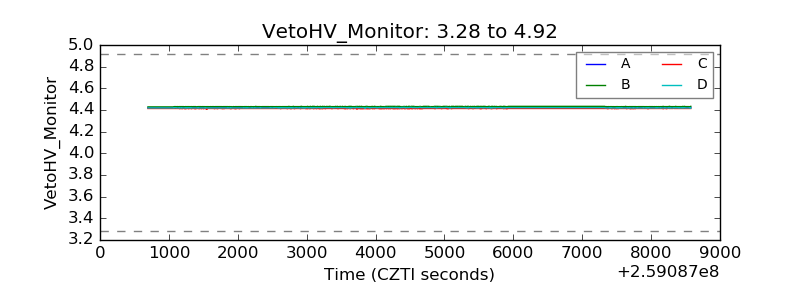 |
| Veto LLD | 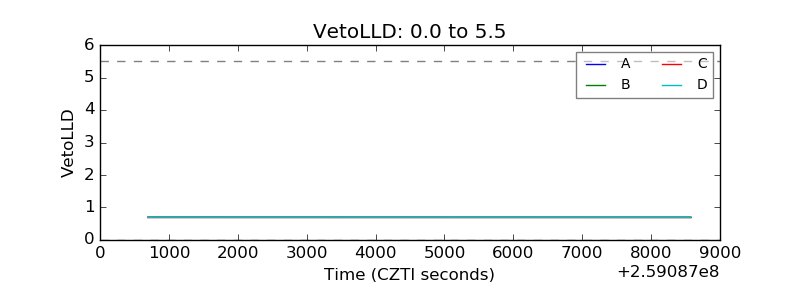 |
| Alpha Counter | 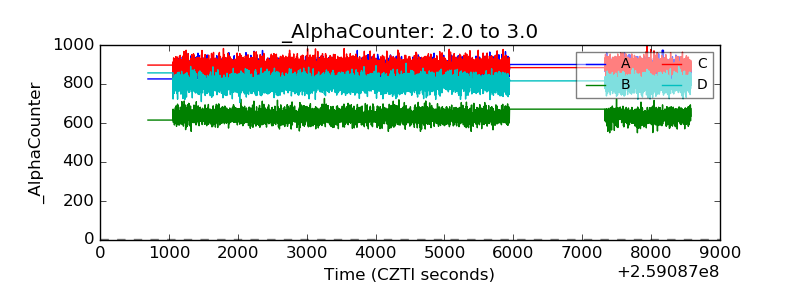 |
| _CPM_Rate | 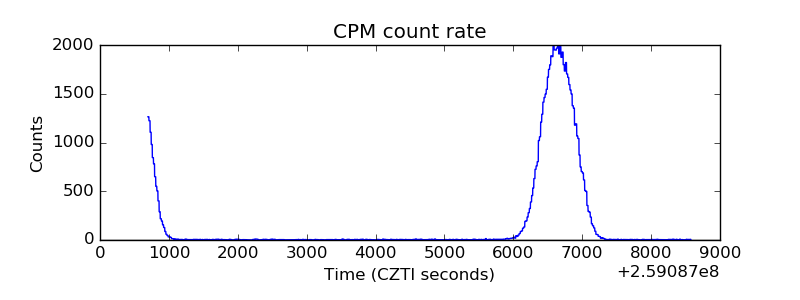 |
| CZT Counter | 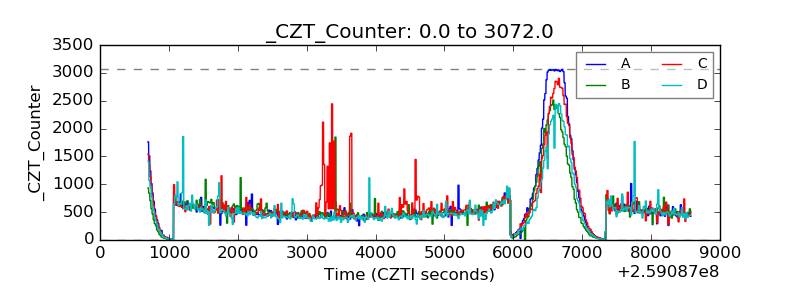 |
| +2.5 Volts monitor |  |
| +5 Volts monitor |  |
| _ROLL_ROT | 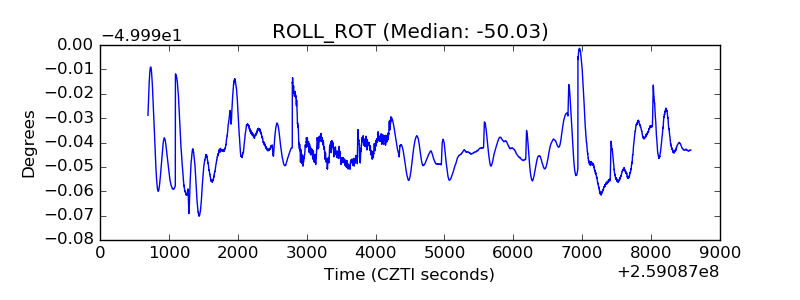 |
| _Roll_DEC |  |
| _Roll_RA | 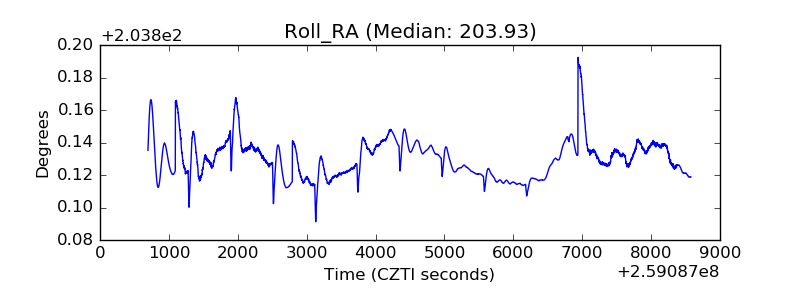 |
| Veto Counter | 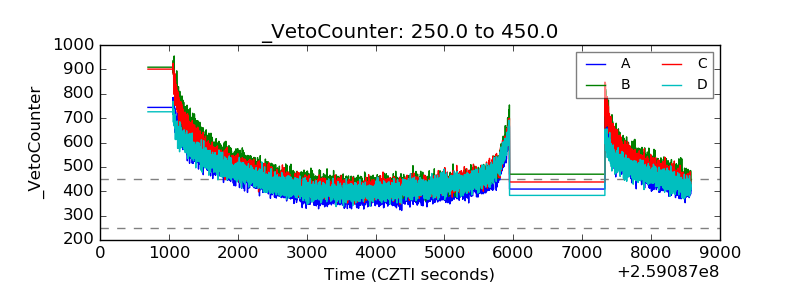 |